
Classification of low-density EEG for epileptic seizures by energy and fractal features based on EMD
2020-09-21 08:53:06LuisAlfredoMoctezumaMartaMolinas
Luis Alfredo Moctezuma, Marta Molinas
Department of Engineering Cybernetics, Norwegian University of Science and Technology, Trondheim 7434, Norway.
Abstract We are here to present a new method for the classification of epileptic seizures from electroencephalogram(EEG) signals. It consists of applying empirical mode decomposition (EMD) to extract the most relevant intrinsic mode functions (IMFs) and subsequent computation of the Teager and instantaneous energy, Higuchi and Petrosian fractal dimension, and detrended fluctuation analysis (DFA) for each IMF. We validated the method using a public dataset of 24 subjects with EEG signals from 22 channels and showed that it is possible to classify the epileptic seizures, even with segments of six seconds and a smaller number of channels (e.g., an accuracy of 0.93 using five channels). We were able to create a general machine-learning-based model to detect epileptic seizures of new subjects using epileptic-seizure data from various subjects, after reducing the number of instances,based on the k-means algorithm.
Keywords: epileptic seizure, electroencephalograms, empirical mode decomposition, detrended fluctuation analysis, energy distribution, fractal dimension
Introduction
Humans of all ages and both sexes may experience sudden seizures, presenting as electrical discharges of a set of neurons inside the brain. Such unprovoked seizures represent a widespread disorder, known as epilepsy, and affect people around the world[1].
Epileptic seizures are generally manually detected by neurophysiologists through continuous monitoring of electroencephalogram (EEG) signals. The epileptiform can be categorized into ictal, interictal,and postictal periods, which are often time-consuming to identify by visual inspection. This may result in an incorrect interpretation of the EEG signals and inappropriate management of patients (caused by under/over medication)[2]. Proper detection can facilitate the treatment of patients and improve the diagnosis of epilepsy. Epileptic events are attributed to localized disturbances in various areas of the brain[3].The epileptogenic focus in approximately 33% of epilepsy patients is located in the temporal lobe[4]and their condition is referred to as temporal-lobe epilepsy(TLE)[5].
Studies on automatic classification and detection of epileptic seizures based on EEG, using supervised,semi-supervised, and deep-learning techniques, have increased during the last few years. However,comparisons between experiments, even using the same datasets, have provided conflicting results. In one study, the authors used intracranial EEG (iEEG)signals from only five subjects with only 20 epileptic seizures for each[6]. Thus, they had data for only 100 epileptic seizures and EEG signals from the epileptogenic zone during free intervals as seizure-free periods. They reported an accuracy of 99.6% from only one channel, using a neural network. However,this approach is known to work better using a large amount of data during the training process, as it learns only by weight adjustment and requires all the possibilities to be trained. In another study, the authors used the same dataset and performed five levels of discrete wavelet transform (DWT)decomposition and fuzzy approximate entropy for feature extraction[7].
The use of frequency and amplitude features has also been reported for the characterization of epileptic seizures based on EEG analysis[8]. However, this is not a robust approach to extract features and more complex analysis is necessary to increase classification accuracy. Methods based on DWT for feature extraction have been reported in the literature[9], but this approach generally requires a pre-processing stage and pre-definition of the best mother wavelet, which can vary depending on the subject and the task.
Literature review suggests that there are still improvements to be done in the feature extraction stage for representing the seizure and seizure-free periods correctly, thus creating robust machine-learning models for automatic detection of epilepsy. Some of the state-of-the-art methods have been tested in small datasets, showing good accuracy for classification of epileptic seizures from the same subject, but for a reallife implementation, the models must be sometimes created using EEG data from other subjects.
Here, we tested a general machine-learning-based model for classifying epileptic seizures and for detecting new subjects after reducing the number of channels. We also set up a subject-specific approach and compared it with other state-of-the-art approaches using the same dataset.
Materials and methods
Dataset
The use of free and public EEG-signal datasets of epileptic seizures is important for the comparison of any proposed method and its performance. Several appropriate datasets are available, of which the most used are from the PhysioNet[10]and EPILEPSIAE[11]projects. However, most datasets now consist of private repositories or access is limited by specific software, making future comparisons difficult. Public low-density EEG datasets of epileptic seizures are also available, but since the approach followed in this paper consists of testing the minimum number of channels necessary to detect epileptic seizures, a highdensity EEG dataset is necessary.
The public dataset used in this paper comes from the PhysioNet project[10]and is partially described[12].It consists of bipolar EEG signals of 24 patients that were recorded from 22 channels (FP1-F7, F7-T7, T7-P7, P7-O1, FP1-F3, F3-C3, C3-P3, P3-O1, FP2-F4,F4-C4, C4-P4, P4-O2, FP2-F8, F8-T8, P8-O2, FZ-CZ,CZ-PZ, P7-T7, T7-FT9, FT9-FT10, FT10-T8, and T8-P8), with a sampling frequency of 256 Hz using the 10-20 international system, and collected at the Children's Hospital Boston. The EEG recordings are from pediatric subjects with intractable seizures who were monitored for several days following the withdrawal of anti-seizure medication to characterize their seizures and assess their candidacy for surgical intervention. Several important details for this work are shown inTable 1, including the duration (inseconds) of the EEG signal for each epileptic event.However, we also considered six-second segments of the epileptic seizures to compare the seizures between subjects with similar components.
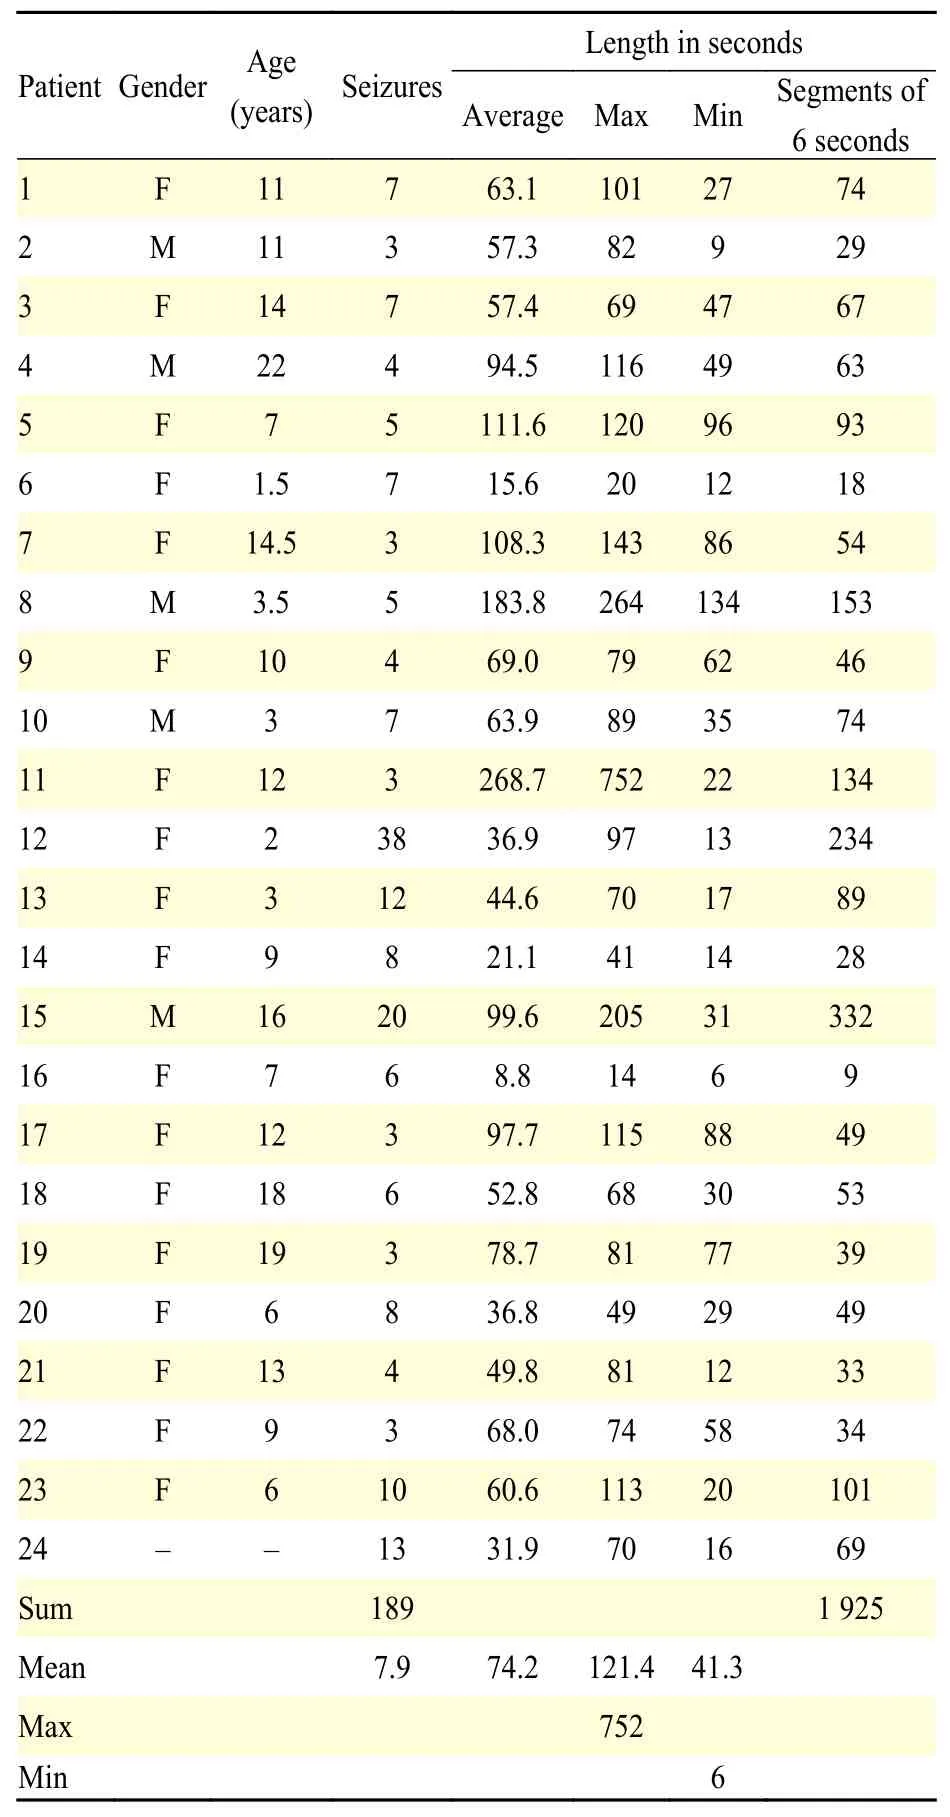
Table 1 Details of the epileptic-seizure data[12]
Empirical mode decomposition (EMD)
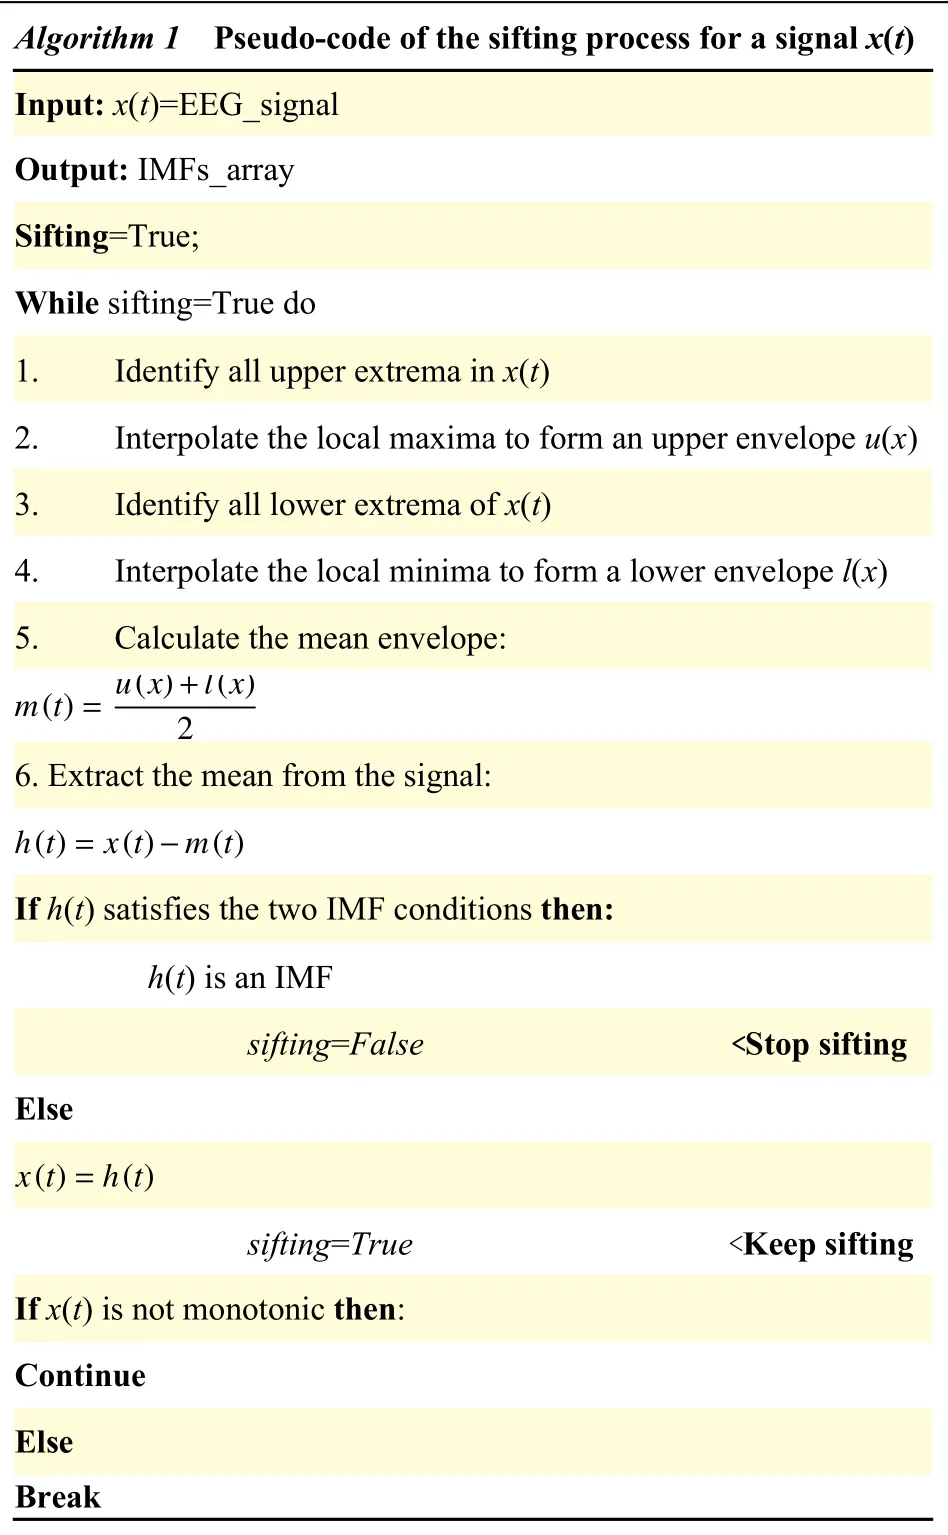
The EMD method has been successfully used to decompose non-linear and non-stationary data into a finite set of oscillatory components, known as intrinsic mode functions (IMFs), by applying the sifting process[13]. The pseudocode of EMD is presented inAlgorithm 1. There are two basic conditions that an IMF must satisfy: (1) The number of extrema and zero crossings must be either equal or different at most by one; (2) At any point, the mean value of the envelope defined by the local maxima and the envelope of the local minima is zero.
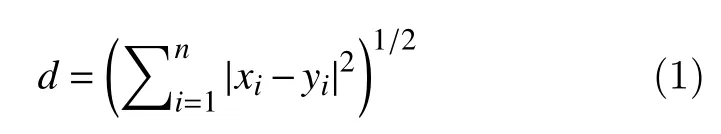
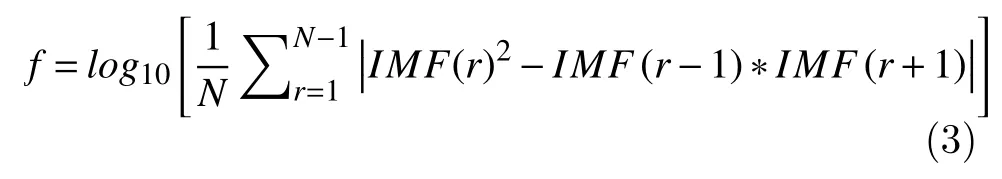
In the sifting process, some IMFs with limited information may appear because the numerical process is susceptible to errors. Thus, a second step to select the most relevant IMFs is necessary. An accepted metric to select such IMFs is based on the Minkowski distance. This is possible because redundant IMFs have a shape and frequency contents differ from those of the original signal, which means that inappropriate IMFs present maximum Minkowski distances[14].
?
For a signalxi, the Minkowski distance to an IMF(yi) is computed as follows:
Once the IMFs are selected, it is possible to use this information to characterize the EEG data. It is also possible to obtain certain features to represent the behavior of the signal and reduce the dimensionality of the data. Next, the features used to represent the selected IMFs, are described.
Energy distribution features
The features to represent the energy distribution can be computed to reduce the computational cost and obtain a better representation of the obtained IMFs.
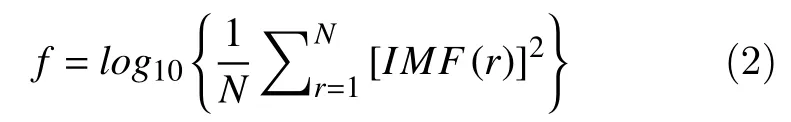
Lets, as below,IMF(r) denote the IMF coefficient of one of the IMFs at positionr, andNis the length of the IMF. The Instantaneous energy feature reflects the amplitude of the signal[15]and can be computed as follows:
In addition to the amplitude analysis, the Teager energy reflects variations in frequency. The Teager energy is a robust parameter, as it attenuates auditory noise[15], and it is computed as follows:
Fractal dimension features
There are several self-similarity features from fractal geometry that are useful to describe the complexity of a signal. Some have been used to directly characterize EEG signals from raw data or using various methods to extract the information. In particular, Higuchi and Petrosian fractal dimensions have been used to characterize non-linear and nonstationary data. These fractal features are described below.
The Higuchi fractal dimension algorithm approximates the mean length of the curve using segments ofksamples and estimates the dimension of a time-varying signal directly in the time domain[16].Consider a finite set of observations taken at regular intervals:X(1),X(2),X(3)...,X(N). Taking this time series as a starting point, a new seriescan be constructed as follows:

wherem=1, 2, 3, …, k indicates the initial time,k=1, …,kmaxthe interval time andkmaxis a free parameter which in this work was set at 10. Then, the length of the curve associated with each time seriescan be computed as:

The Higuchi fractal dimension takes the mean length of the curve for eachkas the average value ofform=1,2,3,..,kand which is calculated as:
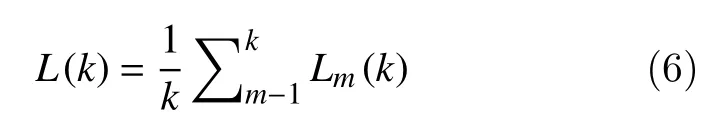
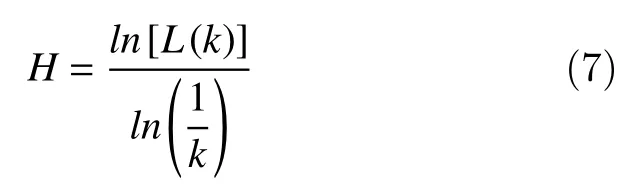
With the obtained array of mean valuesL(k), the Higuchi fractal dimension is estimated as the slope of the method of least-squares from the plot ofln[L(k)]against
Some studies have usedkmaxvalues between 6 to 16. The choice ofkmaxhas a crucial role in the Higuchi fractal dimension estimation[17]. In this work, the optimal value ofkmaxhas not been considered but in the future work we will take into account improvements in this respect.
The Petrosian fractal dimension provides a rapid computation of the fractal dimension of a given signal by translating the series into a binary sequence[18]. The binary sequence is formed by assigning a '1' for every difference between consecutive samples in the time series that exceeds a standard deviation magnitude,otherwise is assigned a '0'. Then, the fractal dimension is computed as follows:
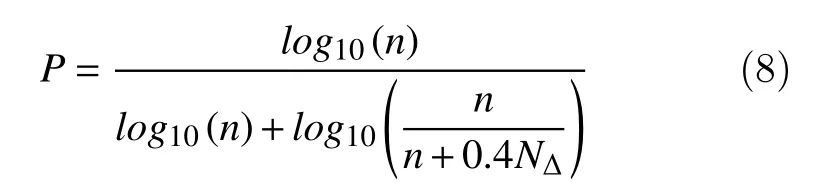
wherenis the length of the sequence andNΔthe number of sign changes in the binary sequence.
Detrended fluctuation analysis
Detrended fluctuation analysis (DFA) is a method to analyze a feature of a fractal for which the pieces are scaled by different amounts in the x- and ydirections of a signal that has been used to analyze a non-stationary signal[19]. The DFA method is used to quantify the long-range temporal correlations (LRTC)with less strict assumptions of the signal stationarity relative to the autocorrelation function[20].
The step by step method is as follows:
1. A time seriesXof sizek, is integrated as follows:
whereX(i) represents thei-thelement of the time seriesXand
2. The second step consists of dividing the time series intoNwindows of lengthl, and the root-meansquare of the integrated series is then subtracted from the local trend in every window:

The numberNlrepresents the total number of windows. The local trendXl(i) is obtained from a linear regression over the time series in the window.
3. The previous step is repeated for several window lengths (l), and the relationship betweenF(l) andlis described by a power law as follows:
The scaling exponent α, which is a generalization of the Hurst exponent, is calculated as the slope of a straight line fit to the log-log graph oflagainstF(l)using least squares.
Method for feature extraction from the EEG raw data
The method for feature extraction from the raw signal is shown inFig. 1. The method used is described in detail[20], but in this study, DFA is also included since it is itself a good feature candidate to characterize epileptic seizures with the quantification of LRTC.
The general method consists of applying EMD to extract IMFs and then computed the Minkowski distance to select the 2 most relevant IMFs[14]. Then, 5 values are computed for each selected IMF: Teager and instantaneous energy, Higuchi and Petrosian fractal dimension and DFA. This process is repeated for each channel to extract 10 features and then all the features are concatenated to obtain a single feature vector for each instance, representing thus the EEG signal for each epileptic seizure or seizure-free period.
Depending on the number of channels used in each experiment, the feature vector size is different. As an example, for 22 channels, the size of the feature vector is 220. The purpose and the process for channel selection are explained later.
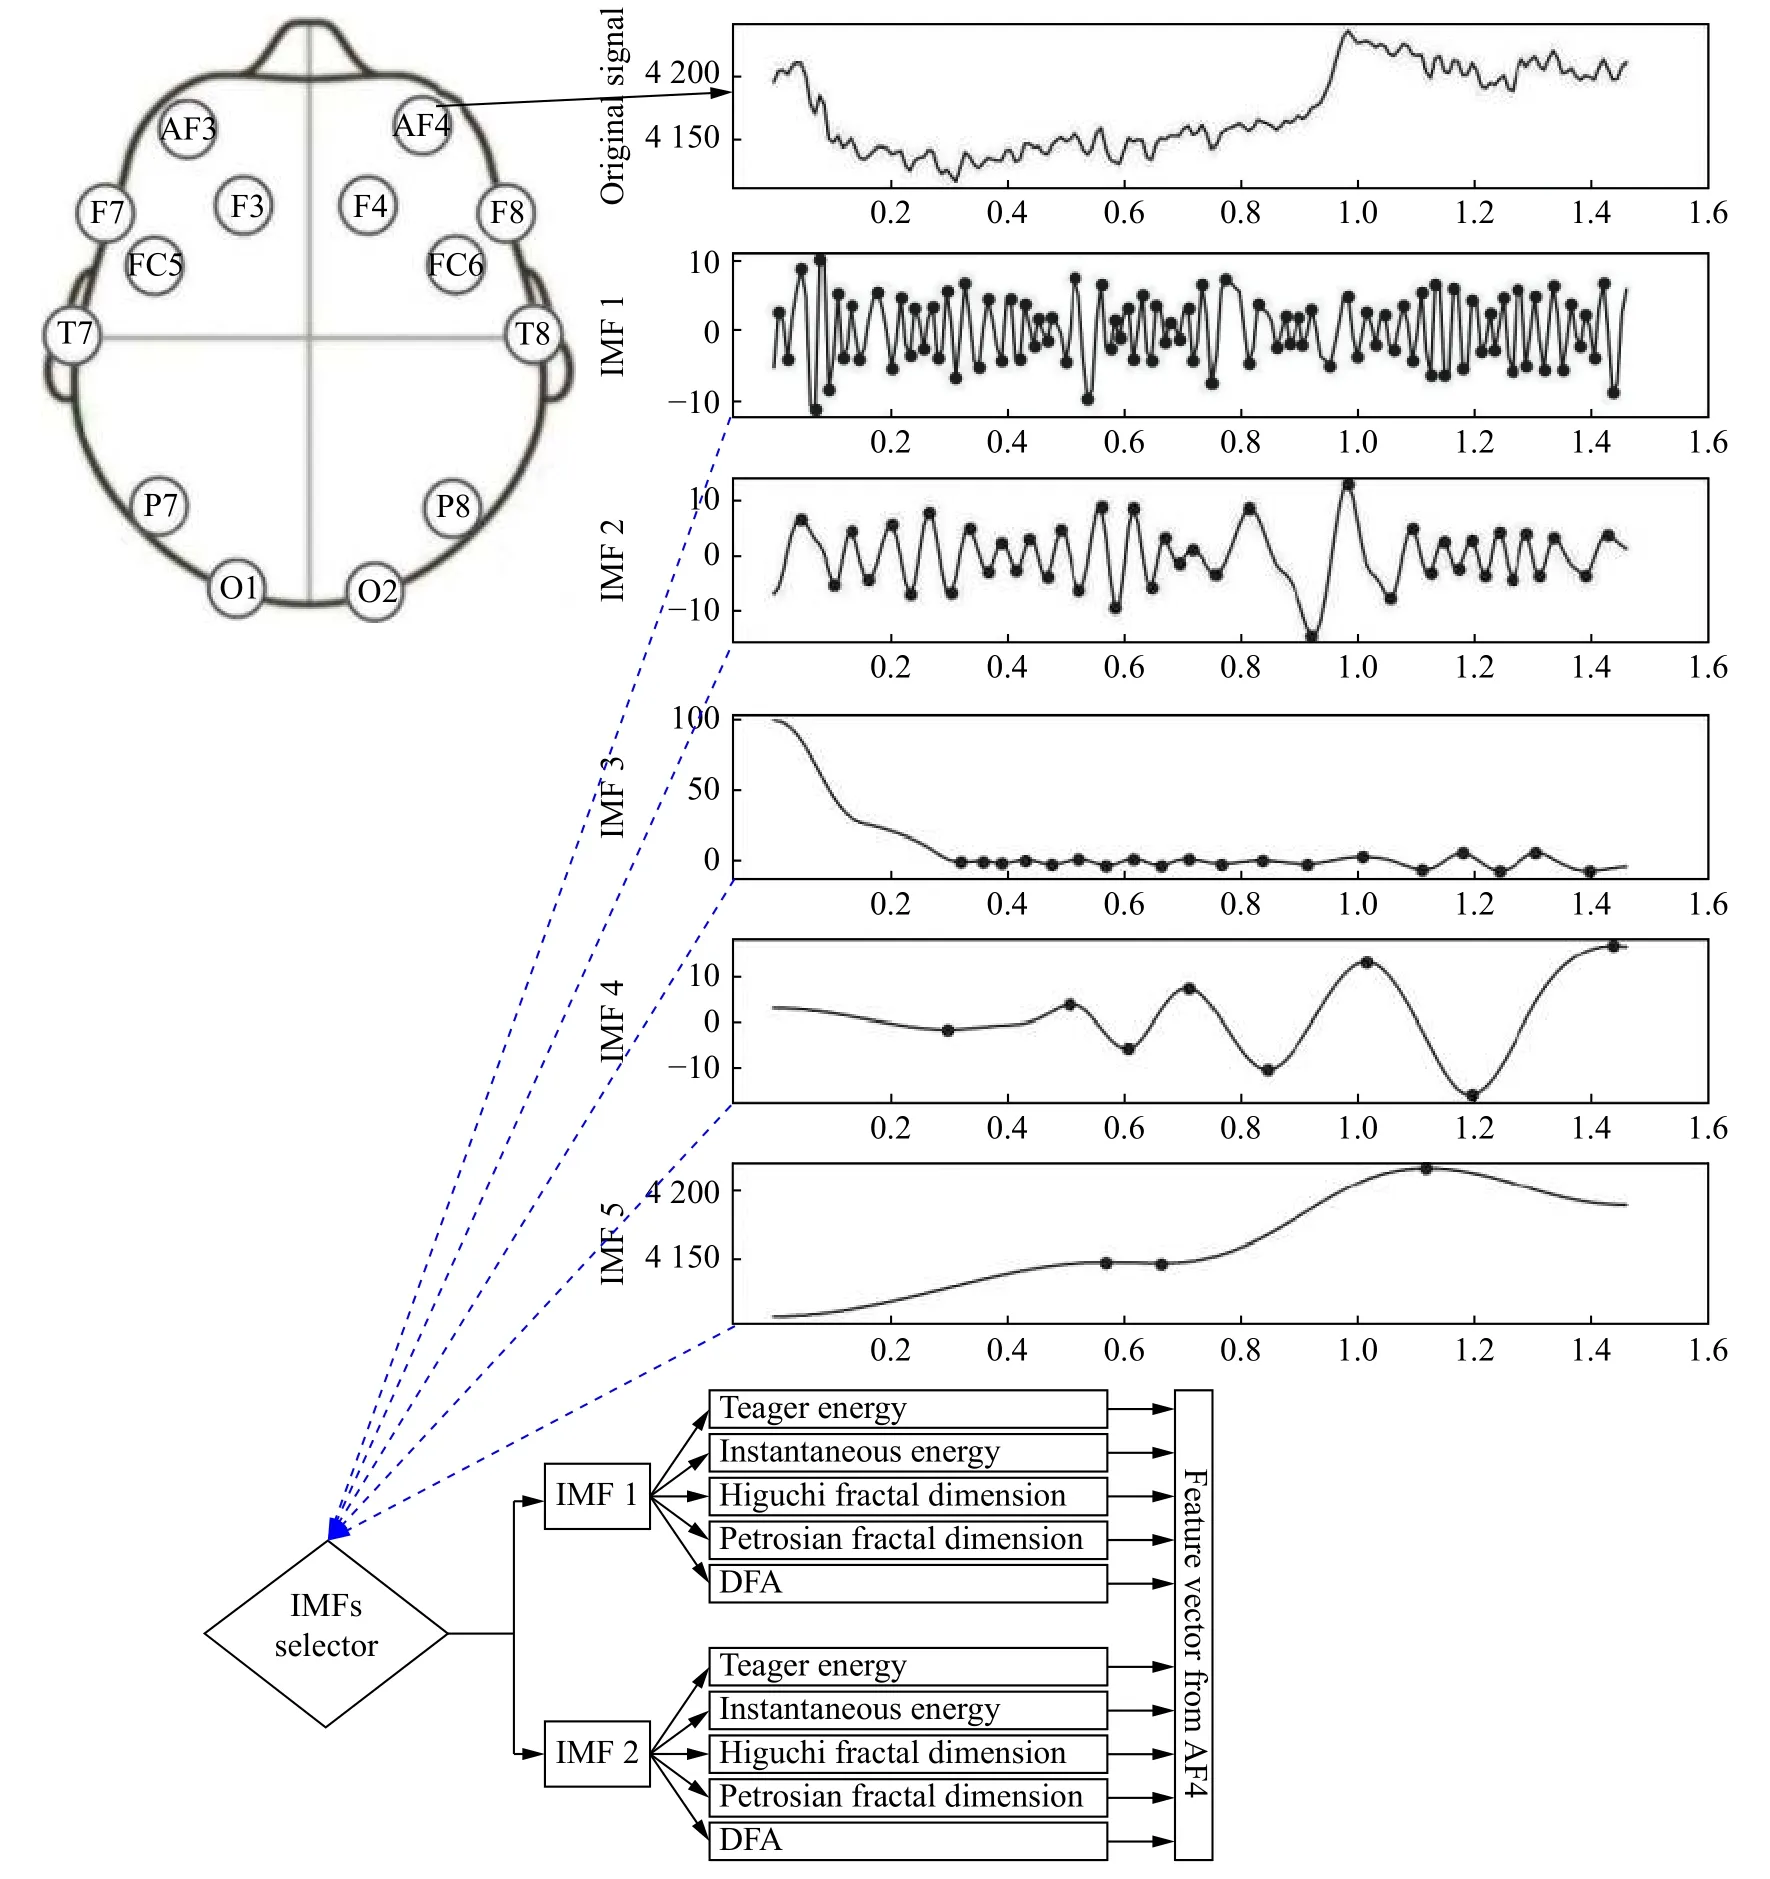
Fig. 1 An illustrative example using the method for feature extraction from the monopolar channel AF4.
The placement of the electrodes on the scalp was based on the 10-20 international system for monopolar EEG channels (Fig. 1) but the dataset used for the experiments was based on bipolar electrodes, as already mentioned.
Classification
It should be noted that the dataset used was created carefully to obtain a balanced dataset. It means that for each epileptic seizure, a seizure-free instance is added into the dataset.
Another approach that improves/helps the real-time response of machine-/deep-learning based braincomputer interface (BCI) systems, in addition to the use of low-density EEG data, is the classifier's computational cost. In this context, a good candidate is the well-known support vector machine (SVM)classifier, as it provides a global solution, the classification complexity does not depend on the feature dimension, and the sensitivity of adding features is relatively low[21].
The obtained vectors were used as input to the SVM algorithm using 10-fold cross-validation to obtain the accuracy metric and thus evaluate the classifier's performance.
Channel reduction criteria
We tested the use of a smaller number of surface electrodes for the detection of epileptic seizures. Thus,the greedy algorithm presented in[22]and used in[23]was adapted to remove channels step-by-step(backward-elimination).
The goal was to test all combinations, removing one channel at a time (k-combinations:k=1), and use them to extract features and for classification. Then, we selected the subset of channels which gave the highest accuracy in the classification step, corresponding to the local maximum. After that, the procedure was repeated with the subset of channels obtained while the length of the subset was still greater than one channel.
Results
We performed classification experiments using the characterized EEG signals and reduction of the number of instances based on clustering and developed and tested a method for creating a general model to detect epileptic seizures.
EEG-based classification of epileptic seizures and seizure-free periods
We analyzed the difference between the application of the method for feature extraction and classification using the complete signal (the duration of the epileptic seizures and the seizure-free periods was the same)and only six-second segments. For the six-second segments, we also analyzed whether the sample rate of the EEG-based epileptic seizure and seizure-free period affect classification or whether similar accuracy can be obtained using fewer data points, by subsampling at 128 Hz.
We first assessed the average accuracy of the method for 24 subjects using all 22 channels (Fig. 2).The accuracy was the lowest using the complete signal, probably because feature extraction was based on the analysis of segments of different lengths. The use of six-second segments improved the accuracy to 91% for sampling rates of both 256 Hz and 128 Hz.
We also tested the use of fewer channels for the classification of epileptic seizures (Fig. 3). The lowest number of channels that could be used while retaining good accuracy was eight for the six-second segments with subsampling at 128 Hz. However, the use of even just five channels resulted in an only 1% reduction in accuracy, while the computational cost for feature extraction was 37.5% lower.

Fig. 2 Average accuracy of epileptic seizure classification for 24 subjects by SVM using the complete signal and six-second segments (with a sample rate of 256 Hz and 128 Hz).
The average accuracy was affected by the results of several subjects in whom the accuracy was low in the classification. For example, the accuracy in subject 13 was approximately 0.65 in all cases (reducing the number of channels).
Only the results of experiments using the sixsecond segments at a sample rate of 128 Hz are further described, as these conditions provided the best results and the time for feature extraction was shorter.
Detection of epileptic seizures for a patient using data from 1.5 years before
In the description of the dataset, the authors mentioned that subject 1 and subject 21 are the same person, but the EEG signals of subject 21 were recorded 1.5 years after those of subject 1. The problem of transfer learning is well-known for some applications. We thus attempted to use the previous knowledge to classify the epileptic seizures of the same subject.
The problem of transfer learning and the accuracy obtained using a trained model with new data of the subject is illustrated inFig. 4. Data from subject 21 was used to create a model by SVM and then the use of that model to classify the seizures of subject 1. The accuracy of the created model for this approach was 0.82, and the accuracy classifying new data from subject 21 was 0.68. Data from subject 1 was used to create a model by SVM and the use of that model to classify the seizures of subject 21. The accuracy of the model created for this approach was 0.95, and the accuracy classifying new data from subject 1 was 0.61.

Fig. 3 Average accuracy of epileptic seizure classification for 24 subjects using SVM during channel reduction.
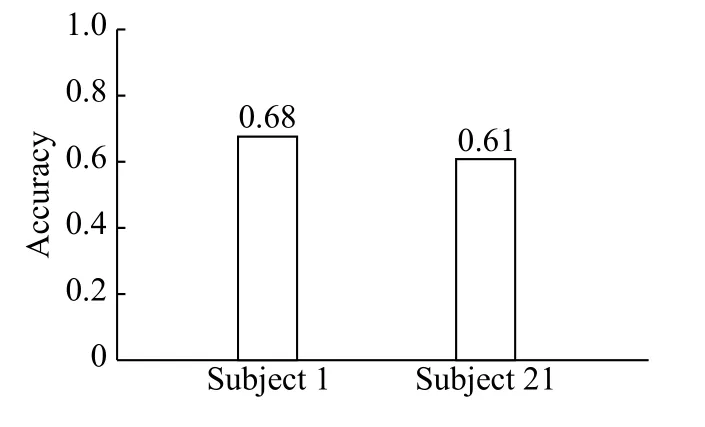
Fig. 4 Classification of epileptic seizures of subject 1 using the ML-based model of subject 21, and the epileptic seizures of subject 21 using the ML-based model of subject 1.
Improving the accuracy of classification for data from 1.5 years before
We performed 10-fold cross-validation using the data of subject 1, 21, and those of both subjects(Fig. 5). It was possible to obtain an accuracy of 0.95 when combining the data, even using only five channels.
However, the main issue of session-session transfer learning concerns the number of instances that are necessary to add to the model to recognize unknown data from new sessions,e.g., how many instances from subject 21 are necessary to add to the model of subject 1 to recognize epileptic seizures and seizurefree periods from 1.5 years before. We thus tested the accuracy obtained when using all the data of subject 1 and that from the epileptic seizures of subject 21 incrementally (Fig. 6). The experiment was carried out using 22 channels to show that the model can be used to detect new epileptic seizures when adding instances from the new session (1.5 years later). The effect of adding one seizure and one seizure-free period was different from that of adding two seizures and two seizure-free periods, according to the size of the seizures, because, as previously mentioned, the models were created with segments of six seconds.These results suggest the possibility of creating a general model to detect epileptic seizures of unknown subjects.
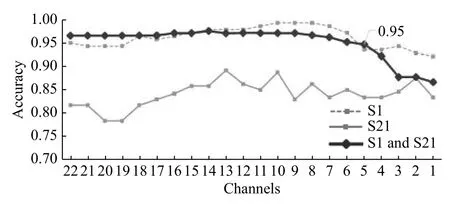
Fig. 5 Accuracy obtained with data from subject 1 (S1), subject 21 (S21), and data from both subjects using SVM, during channel reduction.
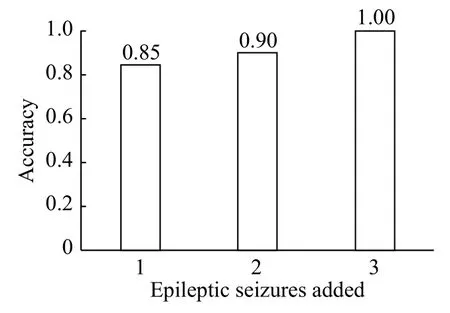
Fig. 6 Accuracy obtained in the classification of epileptic seizures and seizure-free periods of subject 1 and after adding 1, 2, and 3 instances of subject 21 using the SVM classifier.
A general model for epileptic seizure detection removing instances using k-means clustering
We created a general model to detect epileptic seizures and tested its feasibility by considering only subjects for whom the accuracy of classification was ≥0.90 after 10-fold cross-validation using 22 channels: subjects 1, 3, 4, 5, 7, 9, 10, 11, 15, 19, 22,23, and 24.
The first step was to select the best instances for each subject and then this subset of instances to create a general model. The general model was created from the instances using the k-means clustering algorithm to obtain the instances that were not clearly separate and selecting only those from the clusters that were unmixed or removing those that were not dominant from each cluster (Fig. 7).
We first used the elbow method to automatically select the number of clusters. The elbow method uses the within-cluster sum of errors, which is the sum of the distance between each point of a cluster from the cluster centroid[24]. Drawing a straight line from point 1 toN(orange line inFig. 8), whereNis the maximum number of clusters, and calculating the distance from each point (corresponding to the number of clusters used) to this line, the point with the largest distance is the optimal k for the k-means algorithm. As an example, the maximum distance is reached using 11 clusters based on the feature vectors from the previously mentioned subjects (Fig. 8).
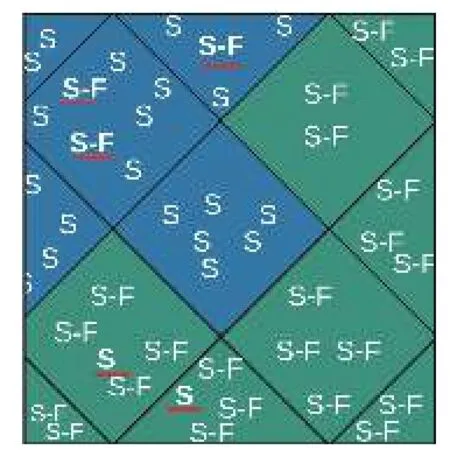
Fig. 7 Illustration of the instance-reduction process, based on removing the non-dominant instances in k-means clusters:those indicated by the red line will be removed (S means epileptic seizure and S-F means seizure-free).
The process to remove the non-dominant instances in each cluster is illustrated by the red lines inFig. 7.After removing these instances, we repeated the clustering process to validate the fact that the instances were now unmixed. The following experiment was then performed, which consisted of assessing the classification accuracy using SVM, with and without instance reduction, using 22 channels(Fig. 9). The accuracy following instance reduction was 0.93, 4% higher than the accuracy obtained for clustering without instance reduction.
Following validation of the accuracy obtained using the EEG data of the previously mentioned subjects by 10-fold cross-validation using SVM (Fig. 9), we tested the ability of the general model to detect epileptic seizures and seizure-free activity in unknown subjects following the method for feature extraction and instance reduction.
We tested the accuracy obtained after creating a model withNsubjects minus subjectiand the accuracy obtained using that model to classify an unknown subject (subjecti) without calibration(Fig. 10).
In general, the accuracy of the created models was >90% but the accuracy of the same model for detecting unknown data was sometimes lower. For example, the accuracy for subjects 15 and 22 was approximately 30% lower than that of the model.
Discussion
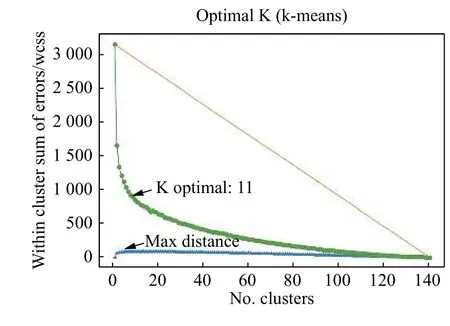
Fig. 8 Selection of the optimal k for the k-means algorithm using the elbow method.
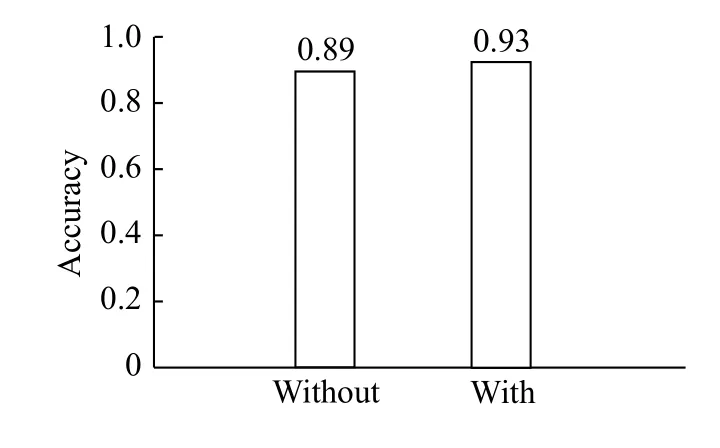
Fig. 9 Accuracy obtained using all the subjects without and with instance reduction.
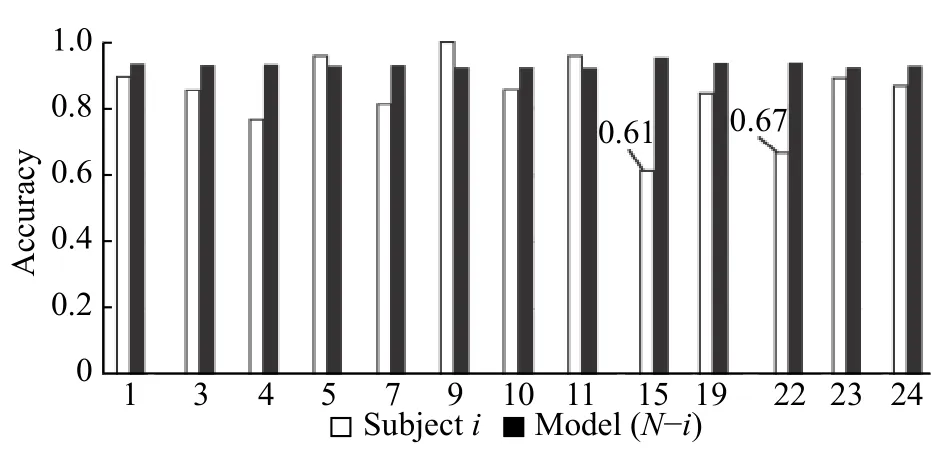
Fig. 10 Accuracy of epileptic seizure classification using SVM with the model created for N-i subjects and evaluation of the model with subject i.
The average accuracy of classification of epileptic seizures and seizure-free periods was up to 94.5% in 24 subjects using EMD-based energy and fractal features. The accuracy obtained in some subjects was up to 98%, whereas it was much lower in several others. This is related to the number of instances for the training stage. These results are of interest for the detection of epileptic seizures tailored to the subject and the monitoring of epileptic events.
In addition to the analysis of subject-tailored models, we also tested the feasibility of a general model. Indeed, our results show that it is possible to detect the seizures of new subjects using the EEG signals collected during those of other subjects, but that it is necessary to add several instances of the new subject to significantly improve the accuracy.Selecting the best-separated instances using the kmeans algorithm improved the accuracy by 4% using 22 channels. However, it may be possible to further improve the accuracy by selecting only the best channels.
The classification of epileptic seizures can be the first step towards the localization of epileptic foci in medical applications and determining the correct medication to give the subject. Real-time detection in itself could be an alternative in managing epilepsy,e.g., sending commands or messages to external devices or individuals. However, the use of dry electrodes for such long-term usage, instead of wet electrodes, will be necessary for these applications.
Our results show the potential of using fewer channels to improve portability and facilitate daily use. In addition to the use of fewer channels, the use of a lower sample rate and a method for feature extraction from the raw EEG signal will provide useful information for classification and detection.Extracting the energy distribution and fractal features of the IMFs has shown that it's possible to characterize epileptic seizures and seizure-free periods for classification.
The problem of transfer learning can be tackled by adding instances from other subjects to a general model (calibration) to detect the epileptic seizures of a new subject. Future steps will also include steps in the presented methodology to test new data with ensemble learning.
This method, along with the use of the appropriate number of channels/instances, the combined knowledge from various areas of science, and advances in portability, new types of electrodes, and new technology for EEG signal acquisition in general,should hasten the development of new tools for medical diagnosis and care, as well as real-time and real-life applications.
Decreasing the computational cost of the method used for feature extraction is important, as the computational cost of the classifier will also decrease,allowing efficient real-time classification for monitoring epileptic seizures. The time to decompose a signal of sizeNby EMD isO(NlogN)[25]. The previous complexity is taken into account for all instances used for training and testing, and is also used in the feature extraction process of new instances in the real-time implementation of the method. The complexity of the classifier for the dataset is only important for creating the model, for which the highest complexity isin the case of the SVM.In addition, the necessary time just to predict the class of a new instance with a SVM isO(1)+O(N)[26].
According to the literature, it is necessary to use multifractal properties to extract more information about non-stationary signals. Thus, multifractal DFA(MF-DFA)[27]and MF detrended moving average(MF-DMA)[28]will be tested and added for feature extraction using the method based on the IMFs and future improvements of epileptic seizure classification and detection for new clinical applications.
The effectiveness of the feature extraction method has been shown in the classification accuracies, which were achieved using 10-fold cross-validation.Additionally, the method used for channel reduction has been shown to have a good performance, since the accuracies using 22 channels or just 5 channels are quite similar (0.97 to 0.93).
The analysis of epileptic seizures includes several linear and non-linear features, which are either mixed or based on the DWT[29]. Chakrabartiet al[30]attempted to closely compare various methods using principal component analysis to reduce the number of channels. However, they used epileptic-seizure data from only 10 subjects. They obtained an accuracy of 0.834 using 12 channels, in contrast to our study, in which we obtained an accuracy of 0.933 with only five channels, on average, for 24 subjects (Fig. 3).
As it was mentioned previously, there are some works presenting several methods using different feature extraction techniques, classification algorithms and experiment setups. In order to provide a general overview of the current state-of-the-art, we are also including some relevant approaches for epileptic seizure classification using the same dataset.Important details are summarized inTable 2for analysis and comparison purposes.
InTable 2, the classification accuracy of our approach is shown using the results from the first experiment exposed here. It should be noted that our experiments were not limited to the comparison with previous works, since we are showing more experiments using transfer learning, channel reduction and instances selection.
According to authors[34], they are obtaining an accuracy of 0.99 using only 5 channels, in contrast to our approach where we are obtaining an accuracy of0.93 using also 5 channels (not necessarily the same channels positions). They are using an imbalanced dataset applying the synthetic minority oversampling technique to obtain a balanced dataset. As it was mentioned previously, our approach was evaluated considering a balanced dataset and the differences between both methods must be tested under the same conditions. This future comparison will be used to improve the accuracy in the case of the subjectspecific model.

Table 2 Comparison of existing methods for epileptic seizures classification using the same dataset[12]
The use of machine or deep learning to detect or predict epileptic seizures with a low number of EEG channels will increase portability and be more userfriendly, thus allowing long-term monitoring outside of the hospital setting. However, there are several challenges to be addressed before real-life implementation, as epilepsy can cause a variety of neurological disorders, such as depression and anxiety. If these types of additional classes are not considered, the classifier will only be able to distinguish between an epileptic seizure and seizurefree, causing more harm than good[36]. In that direction, future efforts must include the analysis of more disorders to classify and predict them from EEG data.
In conclusion, we present a method extracting 5 features from 2 IMFs based on EMD, and it has been successfully used for epileptic seizure classification.The method was performed in several experiments using a different number of channels that were reduced using a backward-elimination greedy algorithm. We used k-means clustering algorithm for instance reduction, increasing the accuracy from 0.89 to 0.93 and creating a general model for epileptic seizure classification.
Future work will focus on comparing the most relevant methods to determine the capabilities of each.They will be compared using a public high-density EEG dataset, as most comparisons are based on different methods and different experimental setups(number of subjects, trials, sessions, channels,etc.),even when using the same dataset, making it difficult to validate a classifier's performance.
Further steps in this research will also focus on testing TLE information and brain-mapping techniques to reduce the number and localization of the channels, testing the resulting method on the dataset used in this paper and various public datasets from the EPILEPSIAE project[11].
Acknowledgments
This work was supported by Enabling Technologies-NTNU under the project "David versus Goliath:single-channel EEG unravels its power through adaptive signal analysis-FlexEEG". The authors want to thank the reviewers for their valuable comments which permitted to improve the presentation of the work.
 THE JOURNAL OF BIOMEDICAL RESEARCH2020年3期
- THE JOURNAL OF BIOMEDICAL RESEARCH的其它文章
- Deep learning approach to detect seizure using reconstructed phase space images
- Epileptic seizure detection using EEG signals and extreme gradient boosting
- Complexity analysis and dynamic characteristics of EEG using MODWT based entropies for identification of seizure onset
- A quadratic linear-parabolic model-based EEG classification to detect epileptic seizures
- An optimized design of seizure detection system using joint feature extraction of multichannel EEG signals
- Hidden Markov model based epileptic seizure detection using tunable Q wavelet transform