
A Survey on Network Operation andMaintenance Quality Evaluation Models
2019-06-16 04:02:02LIULixiaWUMuyangJIFengandLIUZheng
ZTE Communications 2019年4期
LIU Lixia,WU Muyang,JI Feng,and LIU Zheng
(1.ZTE Corporation,Nanjing,Jiangsu 210012,China;2.Nanjing University of Posts and Telecommunications,Nanjing,Jiangsu 210023,China)
Abstract:The evaluation of network operation and maintenance quality is an important reference for carriers to improve their service.However,the traditional evaluation meth?ods involve so much human participation that it cannot cope with the explosive amount of data.Therefore,both the major carriers and researchers are trying to find solutions to evaluate the quality of network operation and maintenance more objectively and accu?rately.In this paper,we analyze the general process of quality evaluation models for net?work operation and maintenance.The process has four steps:1) selection of evaluation indicators; 2) data process for chosen indicators; 3) determination of indicator weights;4) establishment of evaluation models.We further describe the working principle of each step,especially the methods for indicator selection and weight determination.Fi?nally,we review the recently proposed evaluation models and the international stan?dards of network operation and maintenance quality evaluation.
Keywords:quality evaluation; network operation and maintenance; quality of service;indicator selection;weight determination
1 Introduction
Great progress has been made in the research of commu?nication technologies.The coverage of voice network has been expanding,the 4G network has been widely put into use,and the 5G technology is continuously de?veloping [1].With the popularity of mobile communication de?vices,the number of users has also been increasing explosively,which makes the competition among major carriers become fiercer [2].In order to take up more market share,the carriers utilize various approaches such as market research,user ques?tionnaire,drive test,and network quality evaluation.Network quality evaluation is a comprehensive approach,involving quali?ty of service evaluation,the efficiency of maintenance evalua?tion,etc.Quality evaluation is also utilized in education,eco?nomics,management and other fields.It is a good way to assess work results and improve work methods.
In the process of network quality evaluation,we usually use indicators to measure the quality of network in different as?pects.These indicators come from drive test data,ticket data or alarm data supplied by the carriers.However,with the ex?pansion of communication networks and services,various de?vice types and the huge number of devices bring difficulties to traditional evaluation methods for the quality evaluation of op?eration and maintenance.First of all,it is impossible to take all of the original indicators into the evaluation process,since the traditional indicator selection methods need too much re?source and lacks objectivity and comprehensiveness.Second,data heterogeneity caused by different types of devices from different manufacturers makes data integration a challenge.In addition,the expansion of user groups and network scopes,as well as the use of automatic drive test technology,has also brought a surge of data,which inevitably has an impact on the efficiency of calculation.
How to establish a proper and accurate quality evaluation model for network operation and maintenance has become an important issue.The international standard organizations,such as International Telecommunications Union (ITU) and Telecom Management Forum (TMF),have defined the quality of service (QoS) models and the related parameters [3]–[8].Many researchers athome and abroad have proposed their qual?ity evaluation models or methods.This paper conducts a sur?vey on the research about how to evaluate the quality of net?work operation and maintenance and sums up the general con?struction process of the evaluation model.
2 Construction Process of Quality Evalua?tion Model
The methods for obtaining the condition of a network in?clude custom survey,alarm systems,ticket records,drive tests,etc.The alarm systems record the data,such as fault elements,fault occurrence time,failure time,which is the primary refer?ence for carriers to predict and resolve the emergent problems.The ticket records include handling time,reply delay,failure cause,solving methods and influence,which is always used for evaluating maintenance efficiency.The drive test is the most common method in the industry to test the wireless signal.It can provide the signal strength,voice quality,business estab?lishment success rate,average throughput of uplink and down?link,and some other crucial data.The automatic drive test sys?tem has been popular in recent years,making it possible to ex?pand the scope and increase the frequency of the test,therefore get more accurate data and reduce the costs.The explosive growth of the data mentioned above,which is derived from vari?ous sources and has different formats,brings challenges to the traditional manual evaluation methods.
Many researchers have proposed their quality evaluation mod?els and methods,and have improved the key technologies.We summarized the general process of constructing the quality eval?uation model of network operation and maintenance by taking a survey on the state-of-the-art technologies in detail.The process can be divided into the following four steps:
1)Evaluation indicator selection:In this step,we pick up im?portant indicators from the original indicator set to reduce the difficulty of data processing and calculation.At the stage of choosing the indicators,an important principle is that the indi?cators should be as comprehensive as possible without informa?tion overlap.
2) Data process for chosen indicators:The major task is to change data into a unified format which can make it easy to cal?culate and integrate.First we quantify the qualitative data,that is,change the natural language data into numerical terms.And then we process all the data of chosen indicators in a normalized way,so that the data will have the same units of measurement for mathematical operations,such as adding or multiplying.
3)Determination of indicator weights:In this step,we utilize the weight to reflect the importance of the chosen indicator.Then we do some mathematical operations according to the weight of indicators to enhance the accuracy of the evaluation result.Although there are many studies relying on expert expe?rience to specify the weight,those methods may result in differ?ent evaluations for different experts.In this article,we sum up the objective weight determination methods which could re?duce human participation as far as possible to ensure the accu?racy and objectivity of a quality evaluation model.
4)Establishment of evaluation model:The final step is to de?termine the proper evaluation formula.We study on how to combine weights and data and how to combine the scores of each indicator to get the final evaluation results.
When a quality evaluation model is constructed,these four steps are in a linear order.We select the crucial indicator first to reduce the amount of data,which will make the following processes easier.And only the data are standardized to the same dimension can they be utilized to weight calculation and the final integration operation.
3 Evaluation Indicators Selection
The evaluation indicators indicate the evaluation content and the evaluation result is obtained by statistical analysis of the evaluation indicators.With the progress of communication technology,the communication network is becoming complex,and the service provided by carriers diverse,which leads to the increase of the number of relevant indicators.Evaluating all the indicators will result in great computation complexity and information overlap.So we should obtain a smaller indicator set of network operation and maintenance quality evaluation model by filtering the original indicator set.The selected indi?cator set should be concise enough without missing the infor?mation of the original indicator.
Traditionally,the indicator selection is usually completed by experts based on subjective experience.Although the indicator set obtained in this way is concise and specific,it cannot guaran?tee the comprehensiveness and non-overlapping of the indicator information.Several international standard organizations have proposed some general models and the related terminology defi?nitions,but has not given the concrete appraisal target.There?fore,we surveyed the literature[9]–[11]and summed up a num?ber of commonly used indicator selection methods.
LI et al.[9] proposed an indicator classification method which requires multiple data sets to compute the cross-correla?tion coefficients of indicators in different datasets.The crosscorrelation coefficient is usually used in the signal domain to indicate the similarity between two signal curves.We utilize the absolute value form of the cross-correlation coefficient for analyzing.The greater the absolute values of two indicators in?dicate,the more similar they are.The data sequence of an in?dicator is a kind of time series data,which is similar to the dis?crete signal data.The correlation coefficient could be utilized to represent the similarity between two indicators.Suppose two indicatorsxandyare time series data withmsamples re?spectively,then the formula of the correlation between the two indicators could be represented asrxy:
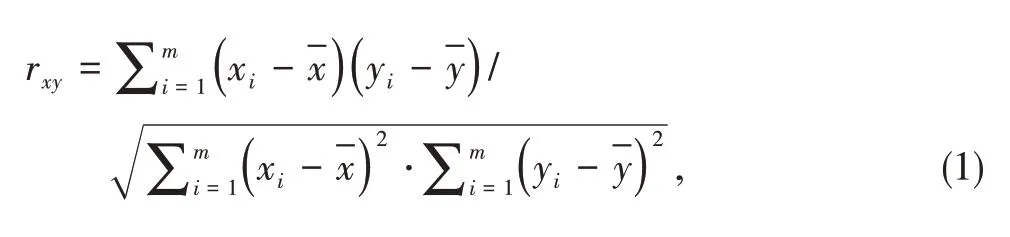
wherexiandyirepresent thei-th sample of indicatorsxandyrespectively,andandare the mean values of these two indi?cators.
According to the law of correlation,two indicators are highly correlated when the absolute value of the correlation number is greater than 0.7 [9].The paper takes many different data sets into account,and calculates the correlation of the chosen indi?cators respectively.Two indicators are similar if they are high?ly correlated in most datasets.Then we can use one of them to represent this class of indicators.
DENG et al.[10] made a detailed description of the condi?tional generalized minimum variance method,which is similar to the method mentioned above.But this method does not involve correlation coefficient in judging the similarity between indica?tors.In this paper,if the value of an indicator set is constant meanwhile the amplitude variation of another indicator set is very small,the two indicator sets have a strong correlation.If we delete one of it,there will be tiny information loss.This method arranges the data sequences of the chosen indicator set as a matrix.The length of each data sequence should be the same.Then it uses the determinant of the matrix,that is,the generalized variance to reflect the change of the indicators.The range of generalized variance is between 0 and 1.The larger the generalized variance is,the more independent the indicator data series is.If the data sequences of two indicators are linearly re?lated,the generalized variance is 0.
After using the method mentioned in literature [9] to divide the indicator set into several classes,the next step is to choose the appropriate indicators in each class to represent the entire class.Similarly,when the two indicator sets have similar infor?mation,we need to determine which one to be deleted in the method in [10].In the industry there is no appropriate method now,but we can use the expert experience to choose the more commonly used and more representative indicators.This meth?od is not only objective and accurate,but also takes the key in?dicators of carriers concerned into account,which accords with economic benefit.
Another method,principal component analysis is mentioned in the literature[11].This method changes a given set of related variables into another set of uncorrelated variables by linear transformation and keeps the total variance of the variables con?stant.The new variables are arranged according to the descend?ing order of variance.The variable with the largest variance is called the first principal component,the variable with the sec?ond variance the second principal component,and so on.The preceding variable has more significant influence on the result of the evaluation and should be retained while the latter variable has less influence and should be discarded.We use the method of characteristic root to determine whether a variable should be retained; that is,if the characteristic root of a variable is greater than 1,it will be retained and vice versa.Although this method is just a rule of thumb,many examples have proved it very sim?ple and reliable.
The indicator classification method based on correlation and the conditional generalized minimum variance method are same in concept.Both the methods remove the indicators which have similar information from the original indicator set.The differ?ence between the two methods is that different parameters are utilized to calculate the similarity between the indicators.The principal component analysis can also get the importance of in?dicators,but it may need a great amount of computation.
4 Data Process for Chosen Indicators
The indicator set may contain some qualitative indicators,which need to be quantified,and then can be combined with oth?er quantitative indicators.Quantitative indicators are indicators which have numerical values while qualitative indicators are in?dicators whose member is the evaluation or description of the subjects.Qualitative indicators usually include categorical and sequential indicators [12].We can use the mean or the median method to quantify the sequential indicators,which has a clear order or degree of relationship between the indicators.Litera?ture [10] uses a median approach.Assuming that an indicator hasnvalues,a1,a2,...,an,after the quantization process the value becomesX1,X2,...,Xn.Assumingaias a normal distribution,we divided theXivalue intonsegments according to a probability distribution,andXiis the median of each segment,whereXfol?lows the N (0,1) distribution.By querying the normal distribu?tion table,we can get the value ofXi.
The value of categorical indicators usually is unstructured and disordered.It is challenging to use objective methods to quantify categorical indicators.Most of the examples rely on expert experience for a rough estimate.This type of data usual?ly appears in coal mining,water conservancy,finance and ser?vices industries.In the network operation and maintenance quality evaluation,this data mainly appears in the manual fillin ticket data,such as“business impact”,“troubleshooting re?sults”and other indicators.ZHANG et al.[13]used a statisti?cal figure collecting method,which is a subjective quantifica?tion approach for qualitative indicators.In this method,the ex?perts give their prediction about the range of the evaluation.The range given by different experts on the same indicators may be different.A smaller range indicates greater accuracy of prediction and vice versa,and thus determines the weight of each expert.By combing the weight,we can get the compre?hensive quantification value,according to statistical figure col?lecting principles.
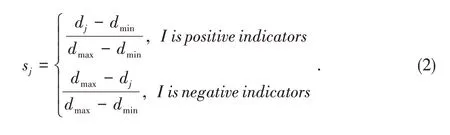
In addition,the selected indicator data needs to be normal?ized.Normalized processing refers to the elimination of the im?pact of the magnitude by changing the actual value of the indi?cators to a normalized form that can be integrated with other in?dicators,which makes it possible to integrate the evaluation of indicators.The normalized processing methods commonly used are the Z-score normalization method and min-max nor?malization method [14].When normalizing the data,we need to divide the indicators into negative indicators and positive in?dicators.The negative indicator means that the increase of in?dicator value has a negative impact on the object,while the positive indicator is the indicator that has a positive impact when its value increases.Assume that the indicatorIhas the data sequenced1,d2,...,dn,where the maximum value isdmaxand the minimum value isdmin.Using the min-max normaliza?tion method,the data can be transformed as a normalized value between [0,1] ass1,s2,...,sn.If the data sequence is all the same,the data will be processed as 1,otherwise,the formula is as follows:
5 Determination of Indicator Weights
The weight determination is the most important step in the con?struction of an evaluation model.A reasonable weight set will en?hance the accuracy of the evaluation results.Traditionally,the weight determination relies on expert experience which requires a lot of human resources and lacks objectivity,and makes it diffi?cult to reflect the differences between indicators.We have inves?tigated and summed up the following several objective ways to de?termine the weight of indicators[10],[15]–[18].
The Analytic Hierarchy Process (AHP) is used to determine the weight [10],[16].There are four methods of AHP:the geo?metric mean method,arithmetic mean method,eigenvector method,and least squares method.The basic principles and steps of these four methods are almost the same,which can be divided into three steps:
1) First of all,construct a hierarchical structure model that can be divided into three levels:the target layer,the criterion layer and the program layer.The number of hierarchical levels is related to the complexity of the problem.In general,the number of layers is not limited,but each element of the level should be less than nine.
2) Construct the judgment matrix for each level mentioned above.And conduct the single level ranking and take consis?tency test.
3) Finally,make the overall ranking and consistency test.And calculate the weight of each level,then integrate all the weights to a comprehensive one.
This method can be used to systematically analyze the prob?lem with a little quantitative data.However,it will result in too many qualitative conclusions and makes it difficult to cope with the situation when there are excessive indicators.
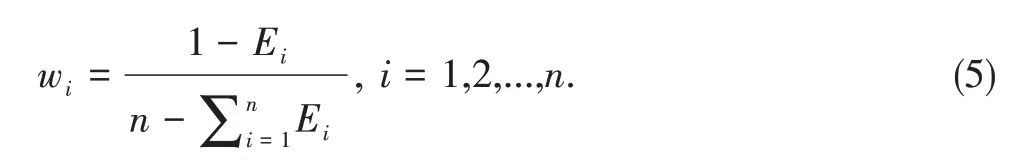
One of the easiest ways is the standard deviation method[15],which uses the standard deviation of the indicator data to measure the degree of deviation of the data from the mean val?ue.If the standard deviation of the data is larger,the variation of the indicator is larger between the different evaluation ob?jects.That is to say,the indicator will provide the greater amount of information and make the greater effect in the evalu?ation,thus it should be given greater weight.The standard de?viation method is used to calculate thei-th indicator’s weightwiin the selectednindicators with the formula as follows:
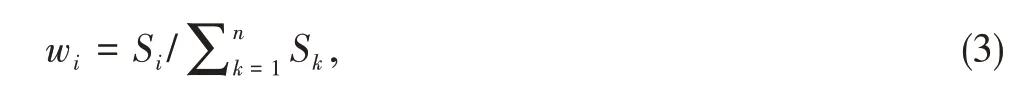
whereSiis the standard deviation of the data of thei-th indica?tor.In addition,regardless of which method is used,the sum of the weights of all the calculated indicators should be con?stant as 1.
The entropy method[17]is a thermodynamics concept,intro?duced by Shannon,which is used to measure the uncertainty.There is a similarity between the idea of the entropy method and the standard deviation method.The information entropy of a certain indicator is smaller,the degree of variation of the da?ta is greater,which reflect the indicator and will provide more information therefore should be given greater weight.Suppose there arenindicators,each indicator hasmdata.Thei-th indi?cator information entropy formula is as follows:
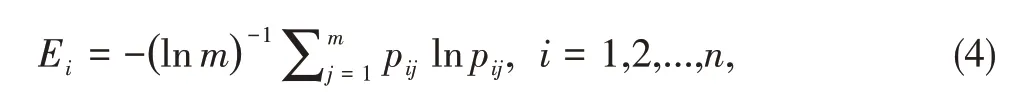
wherepij=dij/,in whichdijis thej-th data record of thei-th indicator,then the weight of thei-th indicator is:
The last weight determination method was proposed in [18].The degree of similarity is expressed by introducing the con?flict between the indicators.The greater the conflict between indicators,the higher the amount of information reflected when the indicators change,and vice versa.The conflict ofi-th indi?cator is calculated as follows:
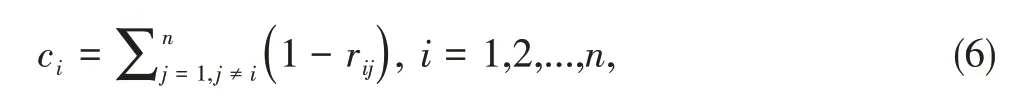
whererijis the correlation coefficient between thei-th andi-th indicators.The calculation method of the correlation coeffi?cient can refer to the formula in the indicator selection step.This method combines the aforementioned weights and conflict to obtain the final weight.The weight with conflict of thei-th indicator is determined bywiandci.The formula for calculat?ing the weight with conflict of the indicatorWiis:
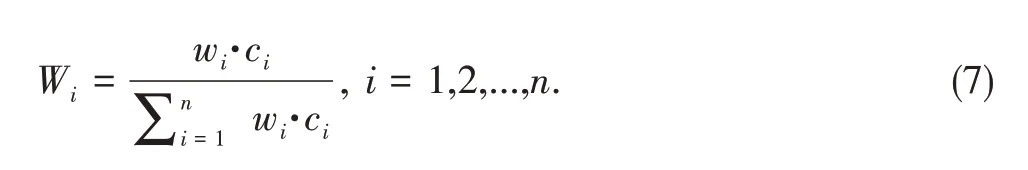
LUO et al.[15] compared the effects of the aforementioned objective weight determination methods.It turned out that combining the standard deviation method and conflict as above form performs best.In the selection of indicators,we need to pay attention to select the non-overlapping information be?tween the indicators as much as possible.The aforementioned weight determination method with conflict is one way to achieve this effect.
6 Establishment of Evaluation Model
The last step of building the model is to determine the eval?uation formula,combined with the indicator data and the weight to get the final evaluation results.Commonly used evaluation formulas are the linear weighted sum,logarithmic linear weighted sum,mixed weighting,and so on,among which linear weighting is the simplest and easiest.Assuming thatnindicators are selected,and the weights of each indica?tor arew1,w2,...,wn.These indicators data sequence isd1,d2,...,dn,then the evaluation formula of linear weighting method is:

After the calculation,we will get the score,a value within the range [0,1],of the object at a certain moment.In this way,the results of the same object at different times will be calculated;hence the fractional curve with time and the mass fluctuation of the object can be obtained.One can also use the top-N algo?rithm [19] to compare the scores of different objects at the same time and select the first N best or worst objects for analysis.Top-N analysis can narrow the scope of the problem,which is more suitable for carriers to improve prominent problems.
There are some problems existing in the quality evaluation model using the method mentioned above.It is difficult to ex?plain the mean of each time node’s fraction,since it can only be explained by comparing with before and after time nodes’fraction.So here a fuzzy comprehensive evaluation method[20]–[22]is introduced to evaluate the quality of network op?eration and maintenance.The method applies to the case that cannot clearly explain the“good”or“bad”quality,such as the quality of an object at any time node.The fuzzy comprehen?sive evaluation method also needs to complete indicator select?ing,data processing and weight determining,and then needs to determine the membership function and establish the fuzzy evaluation matrix.There are many ways to determine the mem?bership function,such as various types of F distribution.The comprehensive weight can function as a fuzzy evaluation ma?trix,shown in Table 1.The rows of the matrix are the various factors of the evaluation object and the columns are different grades.Each cell in this matrix is the degree of membership of the factor for the grade.If we synthesize all the columns,forexample,taking an averaging operation,we will get the degree of membership to this grade of this object.By calculating the degree of membership to all grades,we choose the largest grade as the final evaluation of the object.We establish the fuzzy evaluation matrix as Table 1,where the data in this table are manually fill-in.We take three factors into account as“Call completing rate”,“Reconstruction success rate”and“Uplink user average rate”.And we evaluate each factor in three grades as“Good”,“Medium”and“Bad”.As shown in Table 1,the first cell is 47.6%,which means that the possibili?ty of the call completing rate to be good is 47.6%.After syn?thesizing each column,we could get the degree of membership of each grade.Then we choose the largest grade as the final evaluation;in this example,the object has the largest possibili?ty to be perfect.
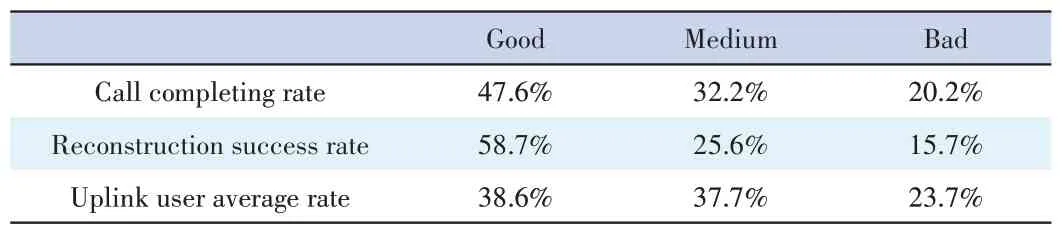
▼Table 1.Examples of fuzzy evaluation matrices
7 International Standards
To deal with the large amounts of heterogeneous data,the standardization of network operation and maintenance quality evaluation methods has become a focus of attention in the in?dustry.The International Organization for Standardization has proposed some general models for assessing network quality,which can serve as a reference for carriers to evaluate network performance,quality of service and so on.In the GB923 hand?book [3],the Telecom Management Forum (TMF) proposed a mapping model of key performance indicators (KPIs) and key quality indicators (KQIs).KPI is a measure of performance and KQI is an indicator of the quality of service,which is the integration and supplementation of KPI indicators.In both cas?es,KPI is based on network performance and KQI is a direct response to the business service performance of the end to end network.In GB923,two kinds of KQIs are defined.One is the product quality KQI,reflecting the quality of the agreement be?tween the carrier and the user.The other is the quality of ser?vice KQI,reflecting the quality of a single service.The rela?tionship between these two KQIs is that the quality of service KQI consists of a number of service elements of the KPI com?position while the product quality KQI consists of a number of quality of service KQI composition,which ultimately forms as hierarchical structure of the key indicators(Fig.1).
The International Telecommunication Union (ITU) also presents a general model for business performance in the E.802 standard document[8].The goal of this model is to an?alyze the performance issues in detail by a structured ap?proach that facilitates the transformation of identified quality criteria into QoS parameters and can be described with easyto-understand technical data.The model is expressed in the form of a matrix,where Y-axis is the performance factor of service,and X-axis is the criterion to measure service quali?ty.These elements can cover most aspects of a telecommuni?cation service.The models mentioned in these standard docu?ments cannot be used directly in practice,considering the ac?tual situation.
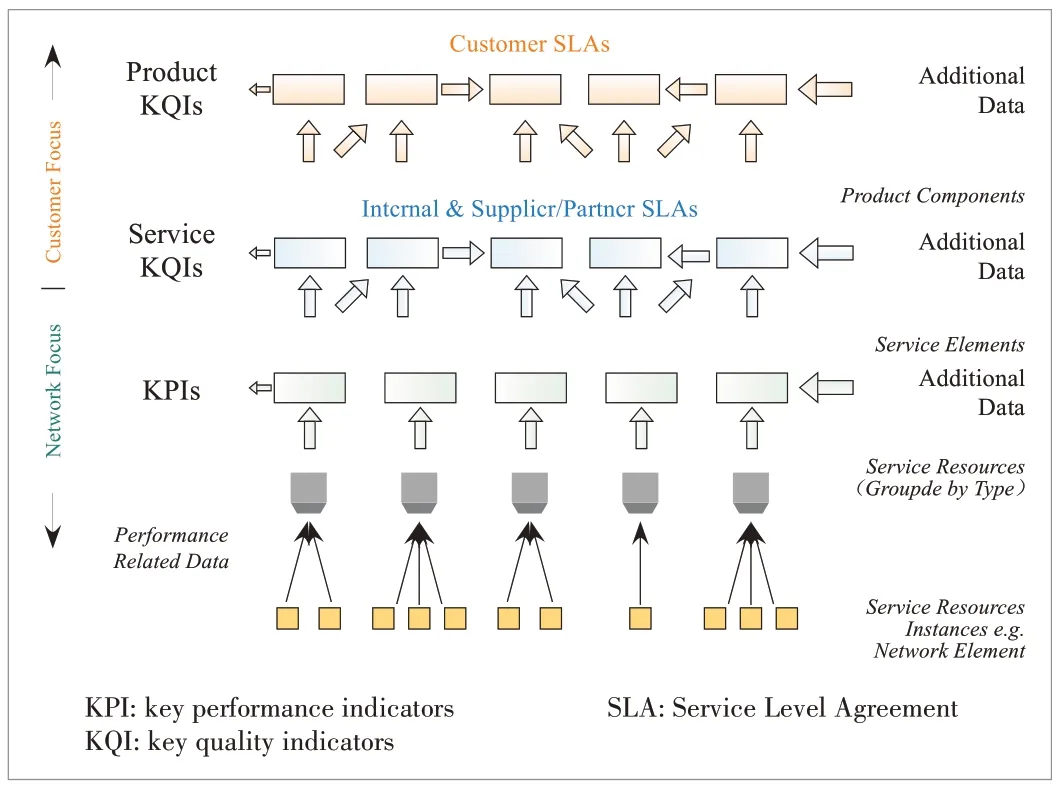
▲Figure 1.Key indicator hierarchy[3].
8 Conclusions
In this paper,we summarize the general process of evaluating network operation and maintenance quality,and divide the eval?uation process into four steps:selecting the evaluation indica?tors,processing the data of chosen indicators,determining the weight of indicators,and establishing the evaluation model.The process can also be used in any quality evaluation model of oth?er areas.We introduce each processing step,especially the ob?jective methods which do not rely on expert experience.The general process above has been utilized to establish a network performance quality evaluation model for the Shanxi Branch of China Mobile.The experiment confirmed that this evaluation model has a good predictive effect on performance alerts.
A future direction could be developing a fully unsupervised method,such as clustering,for indicator selection.In addition,the question how to provide a reasonable explanation of the eval?uation results and how to properly display the issues still calls for many efforts.Finally,in the actual scenarios of the network,different periods such as working days or weekends may follow different evaluation criteria,which also needs to be explored.
- ZTE Communications的其它文章
- Editorial:Special Topic on Computational Radio Intelligence:One Key for 6G Wireless
- Fiber-Wireless Integrated Reliable Access Network for Mobile Fronthaul Using Synclastic UniformCircular Array with Dual-Mode OAM Multiplexing
- An Improved Non-Geometrical Stochastic Model for Non-WSSUS Vehicle-to-Vehicle Channels
- A Survey on Machine Learning Based Proactive Caching
- Machine Learning Based Unmanned Aerial Vehicle Enabled Fog-Radio Access Network and Edge Computing
- Machine Learning for Network Slicing Resource Management:A Comprehensive Survey