Comparative Evaluation of Toleration to Heating and Hypoxia of Three Kinds of Salmonids
SHI Kunpeng, DONG Shuanglin, 2), *, ZHOU Yangen, GAO Qinfeng, LI Li, ZHANG Meizhao, and SUN Dajiang
?
Comparative Evaluation of Toleration to Heating and Hypoxia of Three Kinds of Salmonids
SHI Kunpeng1), DONG Shuanglin1), 2), *, ZHOU Yangen1), GAO Qinfeng1), LI Li1), ZHANG Meizhao1), and SUN Dajiang1)
1),,266003,2),,266235,
This study was conducted to evaluate the critical thermal maximum (CTMax), the routine metabolism rate (MO2) and the limiting oxygen saturation (LOS) of three salmonids with four different body weights ranging from 16g to 131g. The CTMax was estimated at three different heating rates including 0.5℃min?1, 1℃h?1and 2℃d?1. Results showed that the CTMax of maple trout () was the highest, which was followed by steelhead trout () and Atlantic salmon (). The CTMax of the salmonid fish decreased with the increment of body weight, and was significantly influenced by the heating rate. The MO2of the salmonid fish increased with the increment of temperature, and decreased with the increment of body weight. Suffocation points of the fish decreased with increasing body weight and temperature. Steelhead trout was more tolerant to hypoxia than maple trout and Atlantic salmon, while the MO2of Atlantic salmon was the highest among these three salmonids. The LOS of the fish generally had a positive trend with temperature and body weight, and the LOS of steelhead trout was significantly lower than that of maple trout and Atlantic salmon. In conclusion, maple trout was the most tolerant kind to high temperature, while steelhead trout was the most tolerant to hypoxia among three kinds of salmonids. Moreover, the abilities to tolerate higher temperature of three salmonids were affected by their body weight and the heating rate, while the abilities to tolerate hypoxia were influenced by their body weight and the water temperature.
critical thermal maximum; limiting oxygen saturation; routine metabolism rate; Salmonidae; suffocation point
1 Introduction
In recent years, several large salmonids are tentatively cultured in cages at temperate zone of the open sea. Among various physical and chemical factors, temperature and the concentration of dissolved oxygen (DO) are the key abiotic factors affecting the culture of salmon (Brett, 1971; Oppedal, 2011). The fluctuation of water tempera- ture and DO level can influence the metabolic processes, behavior, migration, growth and reproduction of fish (P?rtner, 2001; Remen, 2014).
The critical thermal maximum (CTMax) is one of the most common physiological indices used to quantify the upper thermal tolerance in aquatic and non-aquatic or- ganisms, such as marine crustaceans, amphibians, insects and fishes(Becker and Genoway, 1979; Terblanche, 2005; Hopkin, 2006; Rummer, 2009; Duarte, 2012;Vinagre, 2013). The CTMax, quantified with a dynamic method, is the mean temperature of criti- cal point, at which the animals are losing equilibrium or muscle spasms (Mora and Ospína, 2001; Madeira, 2014a; Madeira, 2014b). The static method focuses on the lethal temperature, which is determined from a plot of present mortality at given temperature intervals. Com- pared with the static method, dynamic method has many advantages including requirement of fewer samples, less experiment time and easier analysis. Moreover, the dy- namic method can provide a more conservative thermal limit in which the organisms remain alive but unable to escape from predators or to forage due to loss of equilib- rium (Mora and Maya, 2006). This indicates that CTMax is more comparable to natural conditions(Mora and Ospína, 2001; Vinagre, 2015). However, one main problem in using the dynamic method is that the heating rate of the experiment varied widely among published protocols from 1℃min?1to 1℃ (48h)?1(Cocking, 1959; Lutterschmidt and Hutchison, 1997; Mora and Maya, 2006). Slow heating rates can allow the fish individuals to acclimate to the ambient temperature, resulting in over- estimating the upper thermal limit (Beitinger, 2000). Fast heating rates may result in a long time lag between the experimental temperature and the internal temperature of the individuals, which can also overestimate the upper thermal limit (Lutterschmidt and Hutchison, 1997). In addition, fish weight is an underestimated variable in the measurement of CTMax in several previous studies (Chown, 2002; Peck., 2009).
DO is also one of the most important environmental factors for fish. Hypoxia is often associated with high summer temperatures. Below a threshold of DO, which also called the limiting oxygen saturation (LOS), fish begins to suffer from hypoxia stress (van Raaij, 1996; Mette, 2012). Fish species generally respond to decreasing oxygen concentrations in two ways. One is oxygen conformers, whereby metabolic rate decreases when oxygen concentrations decreased to the LOS. The other one is oxygen regulators whereby the fish maintains a constant metabolic rate over a wide range of DO until a critical oxygen threshold is reached (Farrell and Richards, 2009). Highly active species like salmonids are generally considered as oxygen conformers to meet their high rou- tine metabolic demands (Hughes, 1973),whereas seden- tary species like those of Anguillidae are generally more hypoxia tolerant (Gamperl and Farrell, 2004). Cyprinoid fishes are also hypoxia tolerant species that can remold their gill to adapt to the hypoxia condition (Dhillon, 2013; Fu, 2014){Fu, 2014 #374}. Despite numerous investigations about the respiration of salmonid fish (Brett, 1964; Powell., 2000; Sadler., 2000; Farrell, 2007; Steinhausen., 2008), only a few studies have documented that the salmonid fish are able to regulate their metabolism.
Atlantic salmon (), maple trout () and steelhead trout () are three kinds of important commercial salmonids worldwide, which are prepared to be cultured in China. The aim of this study was to confirm whether salmonid fish at both an optimal temperature and elevated temperatures are able to regulate their metabolic rate. The other purposes of this study were to investigate the CTMax, the routine metabolism (MO2) and LOS of three salmonids, and to evaluate which kind is more suitable for culture at tem- perate zone of the open sea of China.
2 Materials and Methods
A series of experiments were conducted in the semi- recirculating aquaculture systems (SRAS) located at Oriental Ocean Sci-Tech Co., Ltd. (Yantai, China). This system consisted of 12 tanks (120L, 0.6m×0.4m×0.5m), a biological filter, supplemental aeration, reservoir and a circulation pump.
The three kinds of salmonids were obtained from Orien- tal Ocean Sci-Tech Co., Ltd. (Yantai, China). The maple trout is a breeding variety from Japan, and the steelhead trout is a triploid from USA, while the Atlantic salmon is a commercial breed from Norway.
After capture, the fish were transported into the tanks at a constant temperature of 13℃ and DO concentration above 10mgL?1. For each treatment, there were ten replicate tanks, with one individual per tank. All fish were acclimated for at least seven days to ensure that the fish have a similar thermal history. The fish were fed with the commercial feed twice a day at 08:00 and 16:00, and were starved 24h before the experiment. The system was provided with a natural light cycle of 14-h light and 10-h dark. The temperature, salinity and DO were measured twice daily using a multi-parameter YSI professional-plus probe (Yellow Spring Instrument Co., Yellow Spring, Ohio, USA).
The CTMax is defined as ‘a(chǎn)rithmetic mean of the collec- tive thermal points at which the end-point is reached’. This method was described by Mora and Ospína (2001). To determine the CTMax, the water temperature was rapidly increased at a constant rate until fish began to lose their equilibrium. The equilibrium-loss fish was removed from the experimental system and was transferred to an indi- vidually numbered recovery tank. The equilibrium-loss temperature was recorded for each fish. Over the next two days, dead fish were removed immediately and the fish weight was recorded. The CTMax was determined at three different heating rates of 0.5℃min?1, 1℃h?1and 2℃d?1respectively.
The average CTMax is calculated for each kind (=10) using the following equation:

where theend-pointis the temperature at which a given individual reaches its end-point andis the number of fish individuals in this experiment.
To obtain LOS, the fish were tested at four tempera- tures, 13℃, 17℃, 21℃ and 25℃. Each treatment has three replicates with ten fish per tank. Fish were accli- mated at the specific temperature for seven days. After acclimation, the aeration and circulation pump were stopped, and the tank was sealed with film. The experi- mental tanks were treated as open respirometers and the DO concentration was measured every five seconds. With the declining of DO concentration, the fish started to lose equilibrium, which meant that the fish reached the suffocation point. The experiment was terminated when all the fish lose their equilibrium, and fish weight and DO were recorded for calculating the BLE (fish begin to lose equilibrium), HLE (half number of the fish lose equilib- rium) and ALE (all fish lose equilibrium).
The MO2was calculated using the following formula using DO concentration data higher than 90% of air saturation. The oxygen consumption rate was calculated using the same formula with different DO concentrations.

whereis the tank volume,is the weigh of fish, DO1, DO2are the concentrations of DO at1and2. In order to calculate the LOS, oxygen consumption rate was plotted against DO concentration.
The LOS was calculated by the following fitting for- mula:

whereis the DO concentration;is the oxygen con- sumption rate at the same time;a, b,0,0are constants. This method estimates slope parameters and the turning point (s) within a framework simultaneously (Remen, 2013).
All statistical analyses were conducted using SAS 9.4 (SAS Institute, Cary, North Carolina, USA). The data of CTMax, suffocation point and LOS were analyzed using one-way analysis of variance to determine if significant differences existed among different treatments, followed by the Student-Neuman-Keuls multiple range test. The data of CTMax with different kinds of fish, different body weights and different heating rates were analyzed using three-way analysis of variance. All statistical tests were set at a probability level of<0.05.
3 Results
3.1 The CTMax Values for Three Kinds of Salmonids
In the present study, the CTMax for Atlantic salmon were significantly lower than that of maple trout and steelhead trout among different heating rates and body weights (<0.05) (Table 1). In general, no significant difference was observed between the CTMax for steel- head trout and maple trout with heating rate of 0.5℃min?1. However, the CTMax values for maple trout with heating rates of 1℃h?1and 2℃d?1were significantly higher than that of steelhead trout (<0.05).
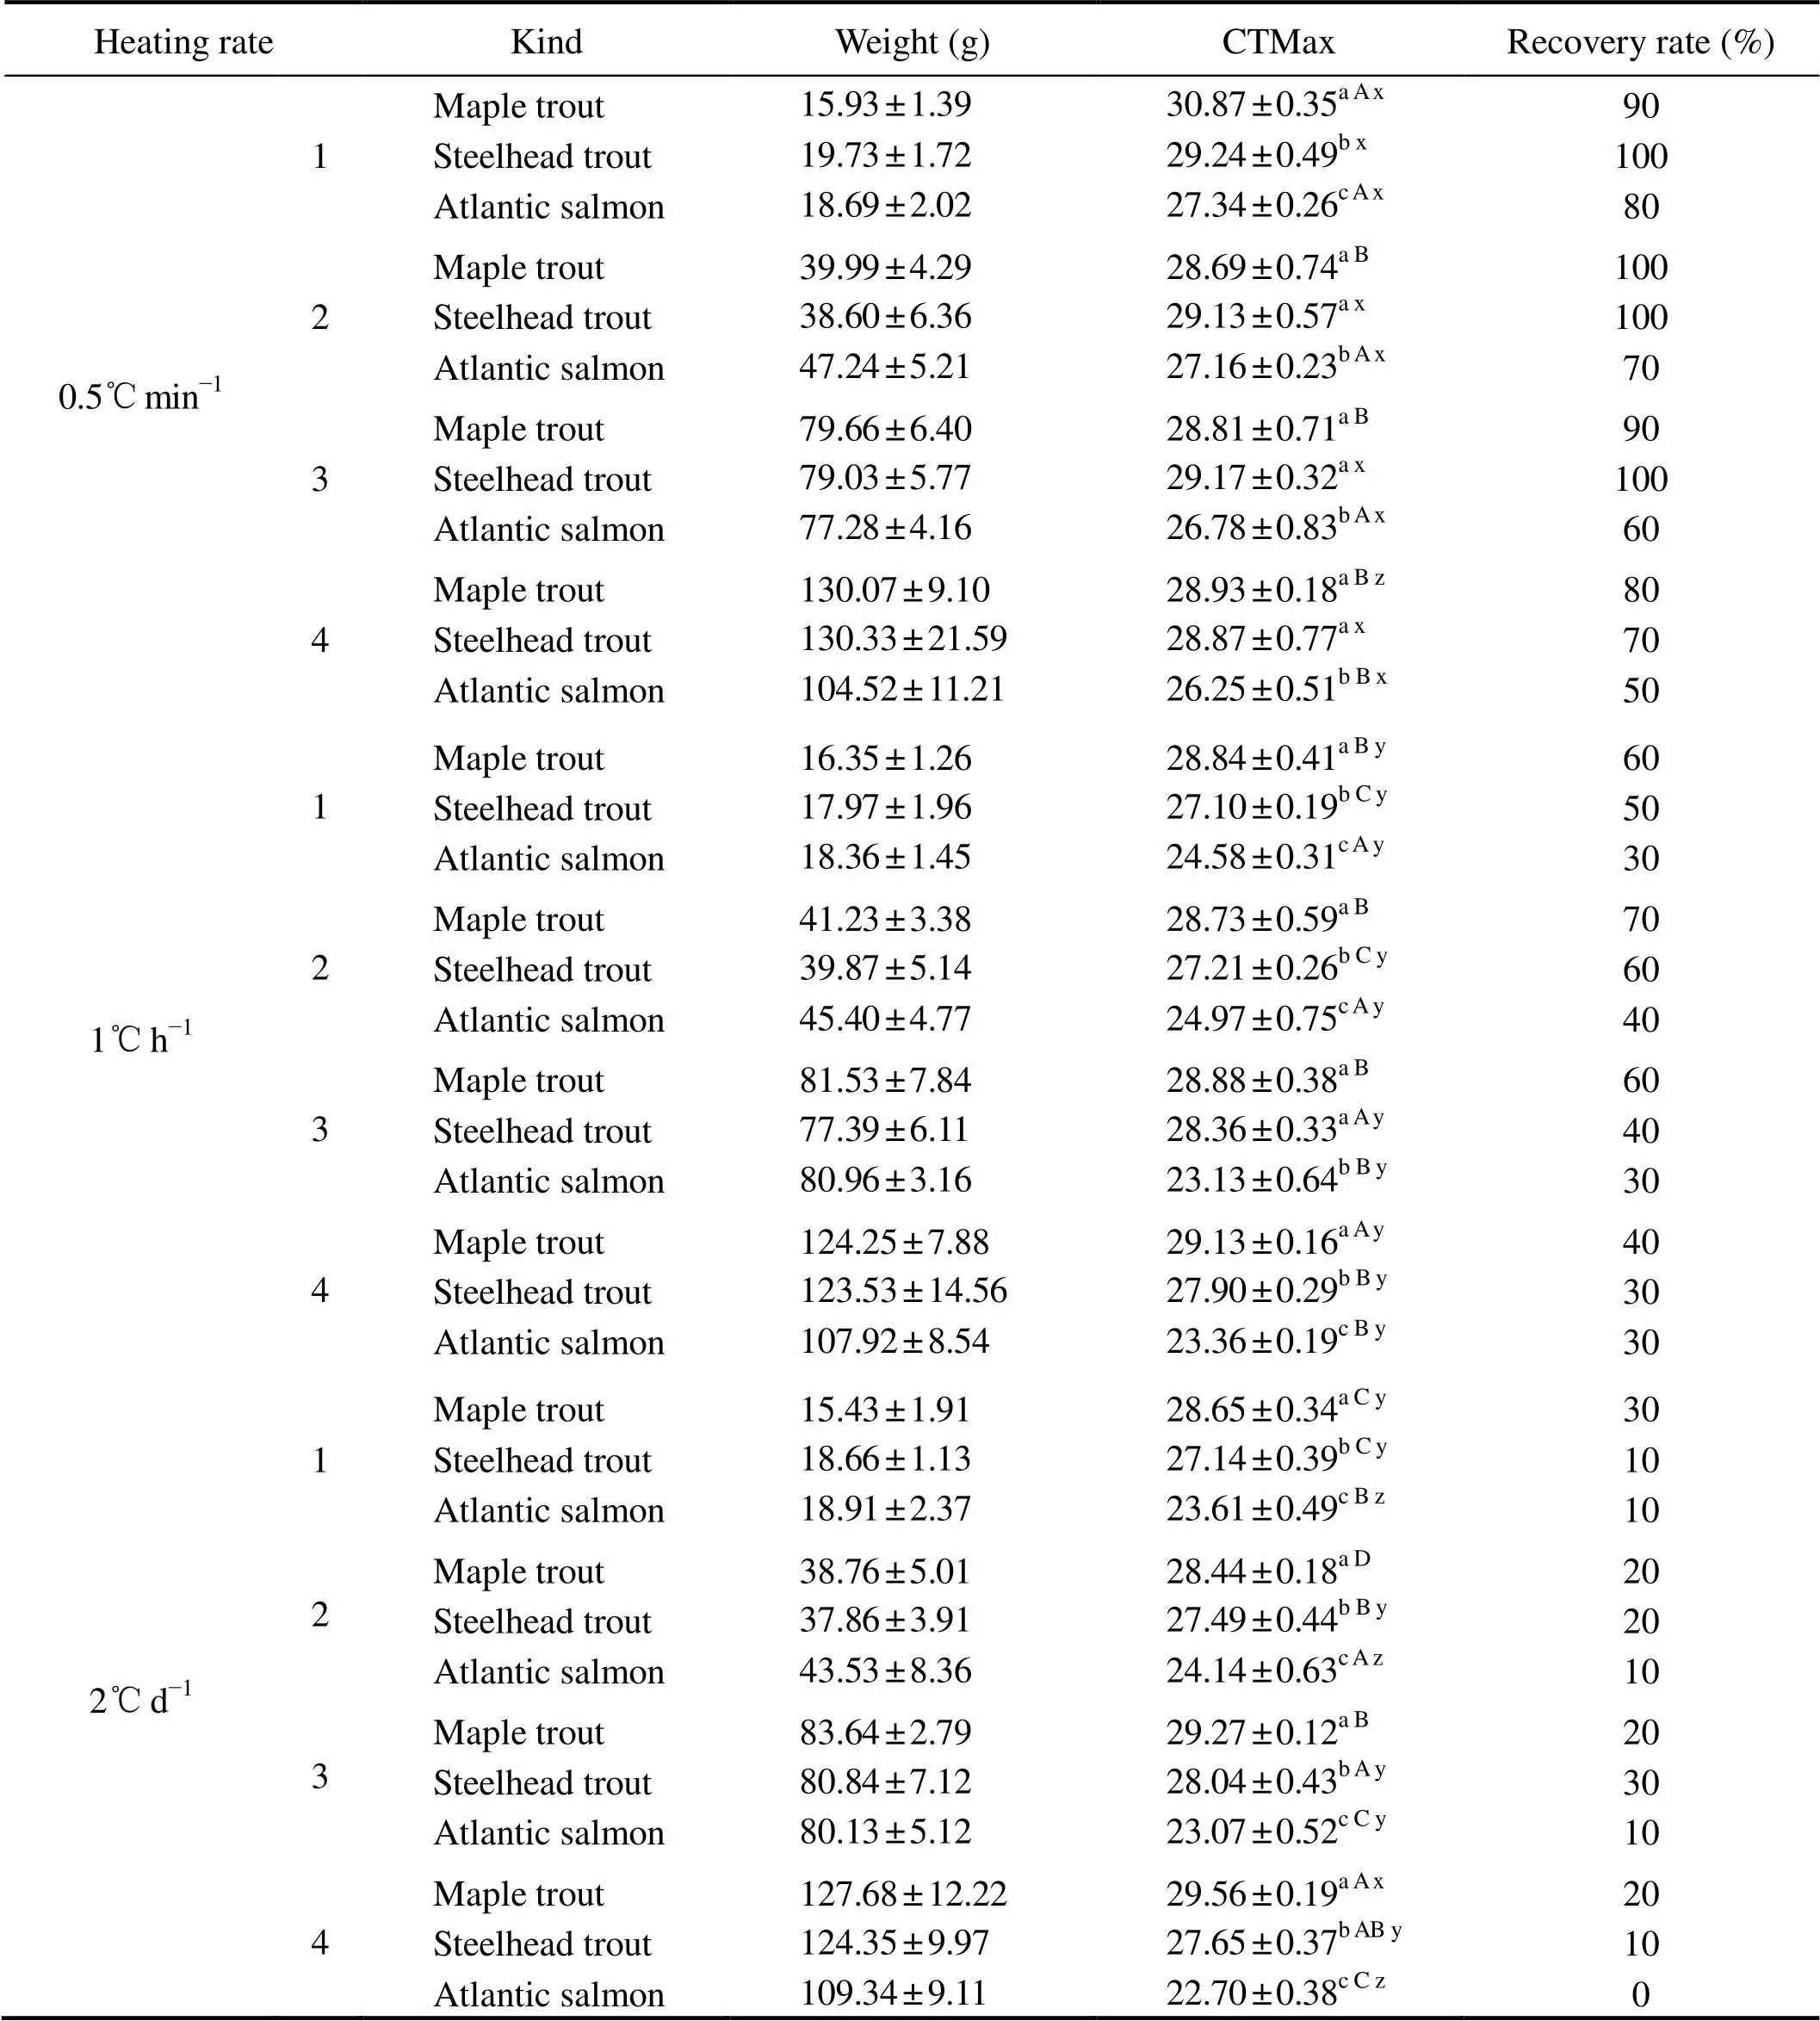
Table 1 The CTMax for maple trout, steelhead trout and Atlantic salmon with different body weights and heating rates
Notes:Data are presented as mean±standard deviation (=10). Different letters indicate significant differences among different kinds with the same body weight and heating rate (a>b>c), different body weights with same kind and heating rate (A>B>C>D), and different heating rates with same kind and body weight (x>y>z) in thetests (<0.05).
The recovery rates of the three kinds were maple trout > steelhead trout > Atlantic salmon (Table 1). The average recovery rate for the salmonids at the heating rate of 0.5℃min?1was 82.5%, which was higher than that at 1℃h?1(48.3%), and the recovery rate at 2℃d?1was the lowest among all three rates (15.8%).
The CTMax was significantly influenced by kind of fish, heating rate and body weight (Tables 1 and 2). The CTMax of maple trout with body weight of 16g was significantly higher than that with other three body weights (about 40g, 80g and 130g) at the heating rate of 0.5℃min?1(<0.05). In contrast, the CTMax of maple trout with body weight of 130g was significantly higher than that with other three body weights (about 16g, 40g and 80g) at the heating rate of 1℃h?1(<0.05). For the same kind and body weight, the CTMax of the group with 0.5℃min?1heating rate was significantly higher than that of the groups with 1℃h?1and 2℃d?1, respectively (<0.05) (Table 1).
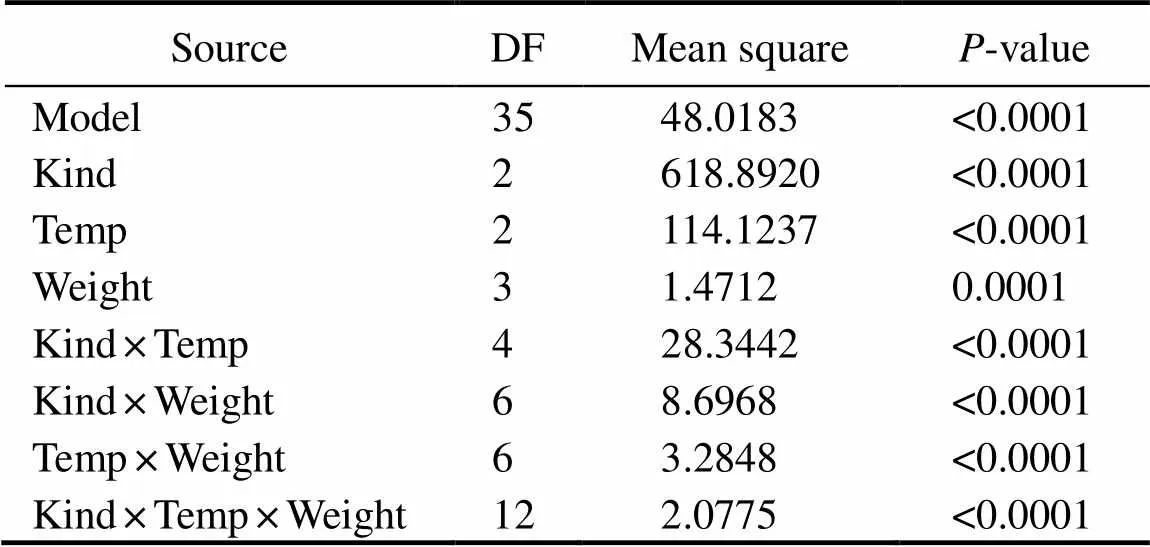
Table 2 Results of three-way variance analysis for the CTMax of maple trout, steelhead trout and Atlantic salmon with different heating rates and body weights
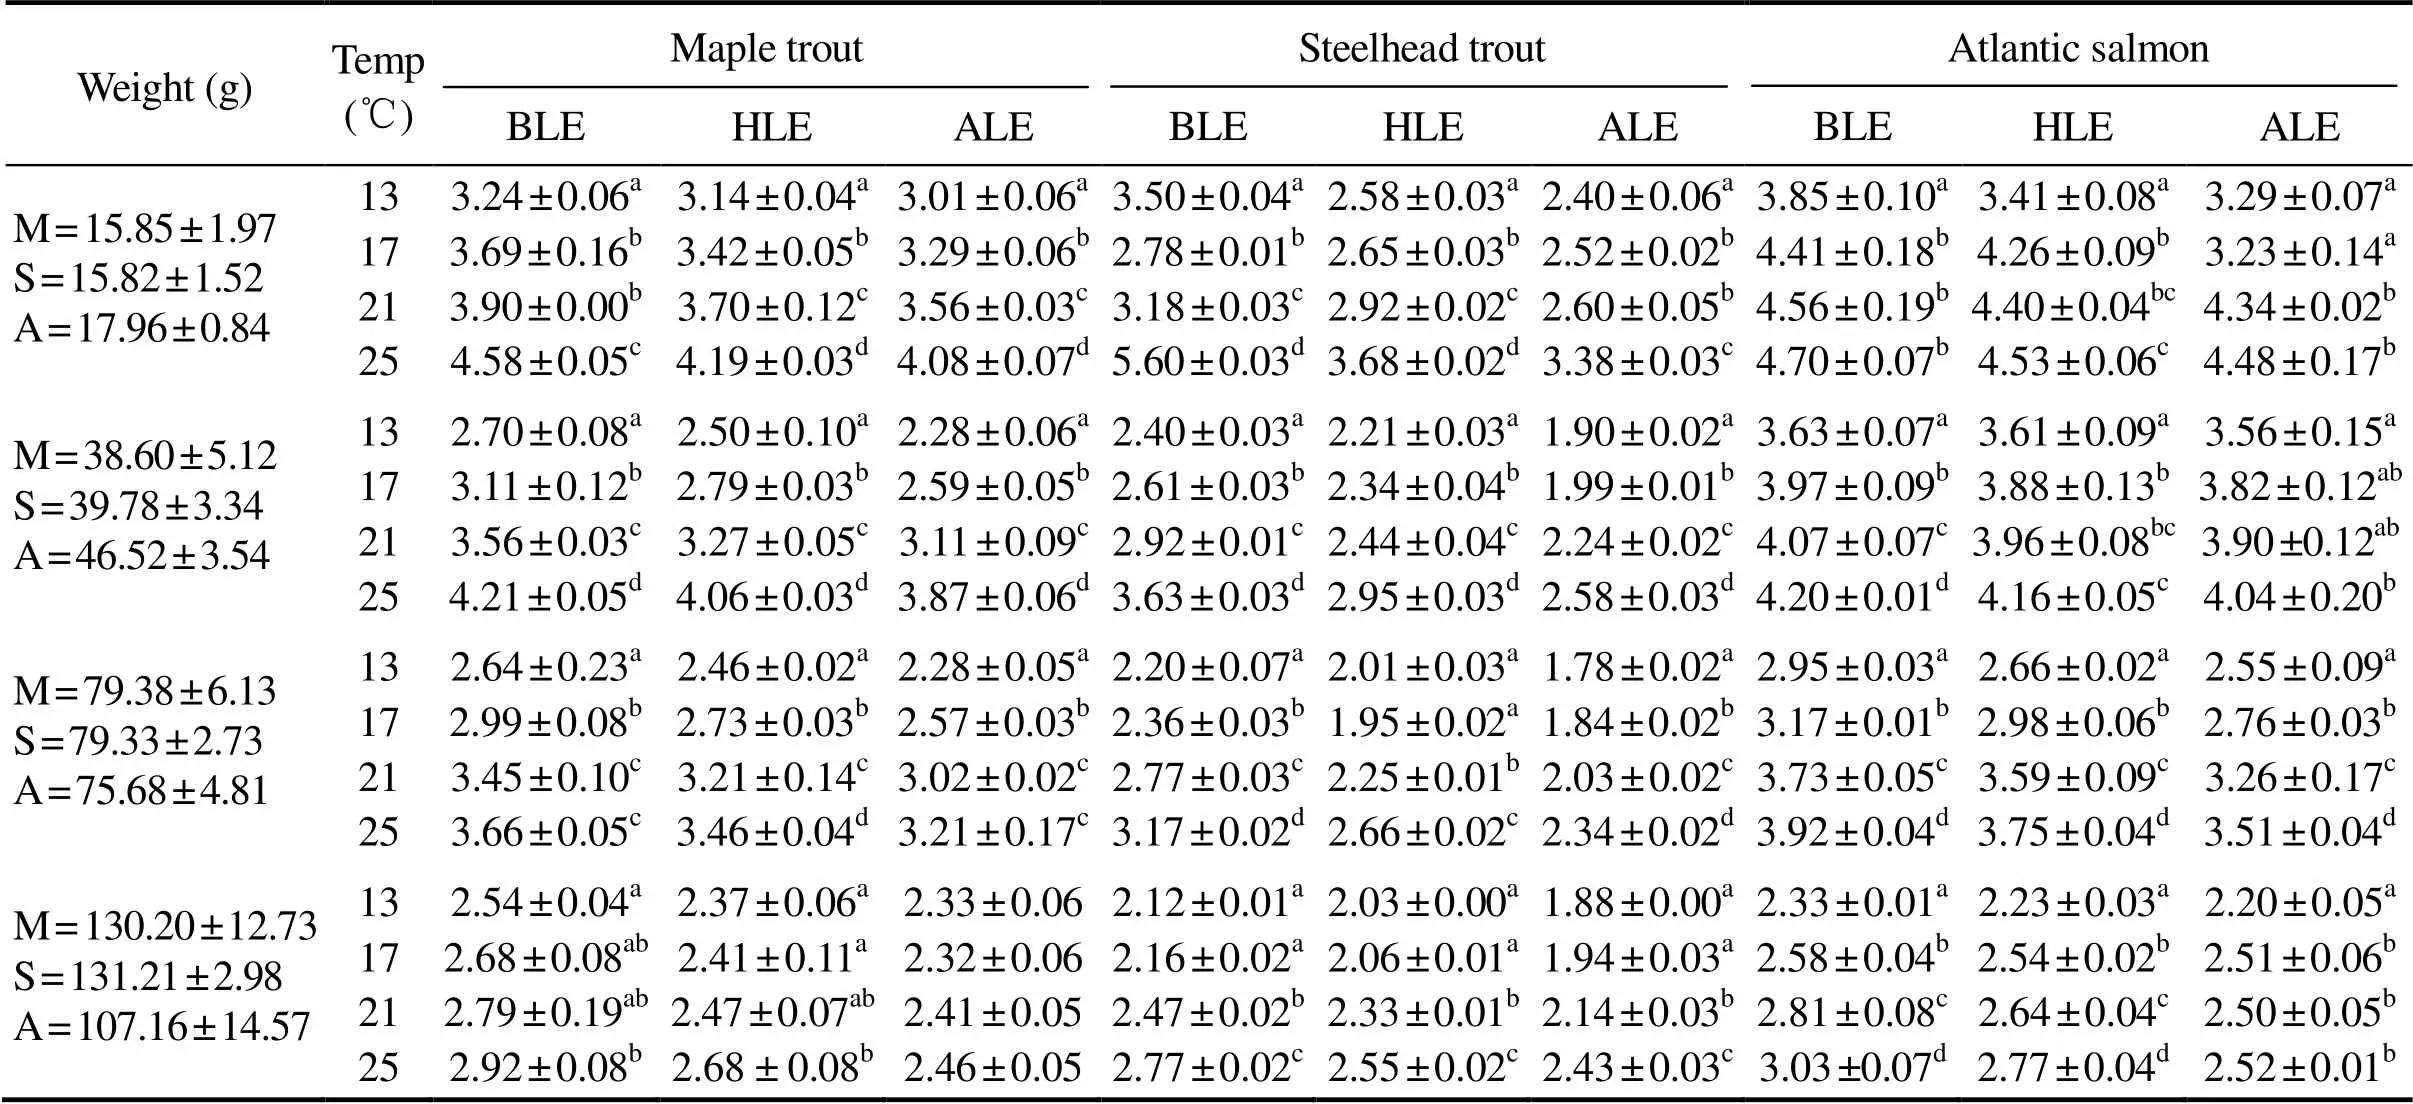
Table 3 The suffocation points (mgL?1) of maple trout (M), steelhead trout (S) and Atlantic salmon (A) with different weights and temperatures
Notes: BLE=fish begin to lose equilibrium; HLE=half number of the fish lose equilibrium; ALE=all fish lose equilibrium. Data are presented as mean±standard deviation (=10). Different letters indicate significant differences among different temperatures with the same kind and body weight in thetests (<0.05).
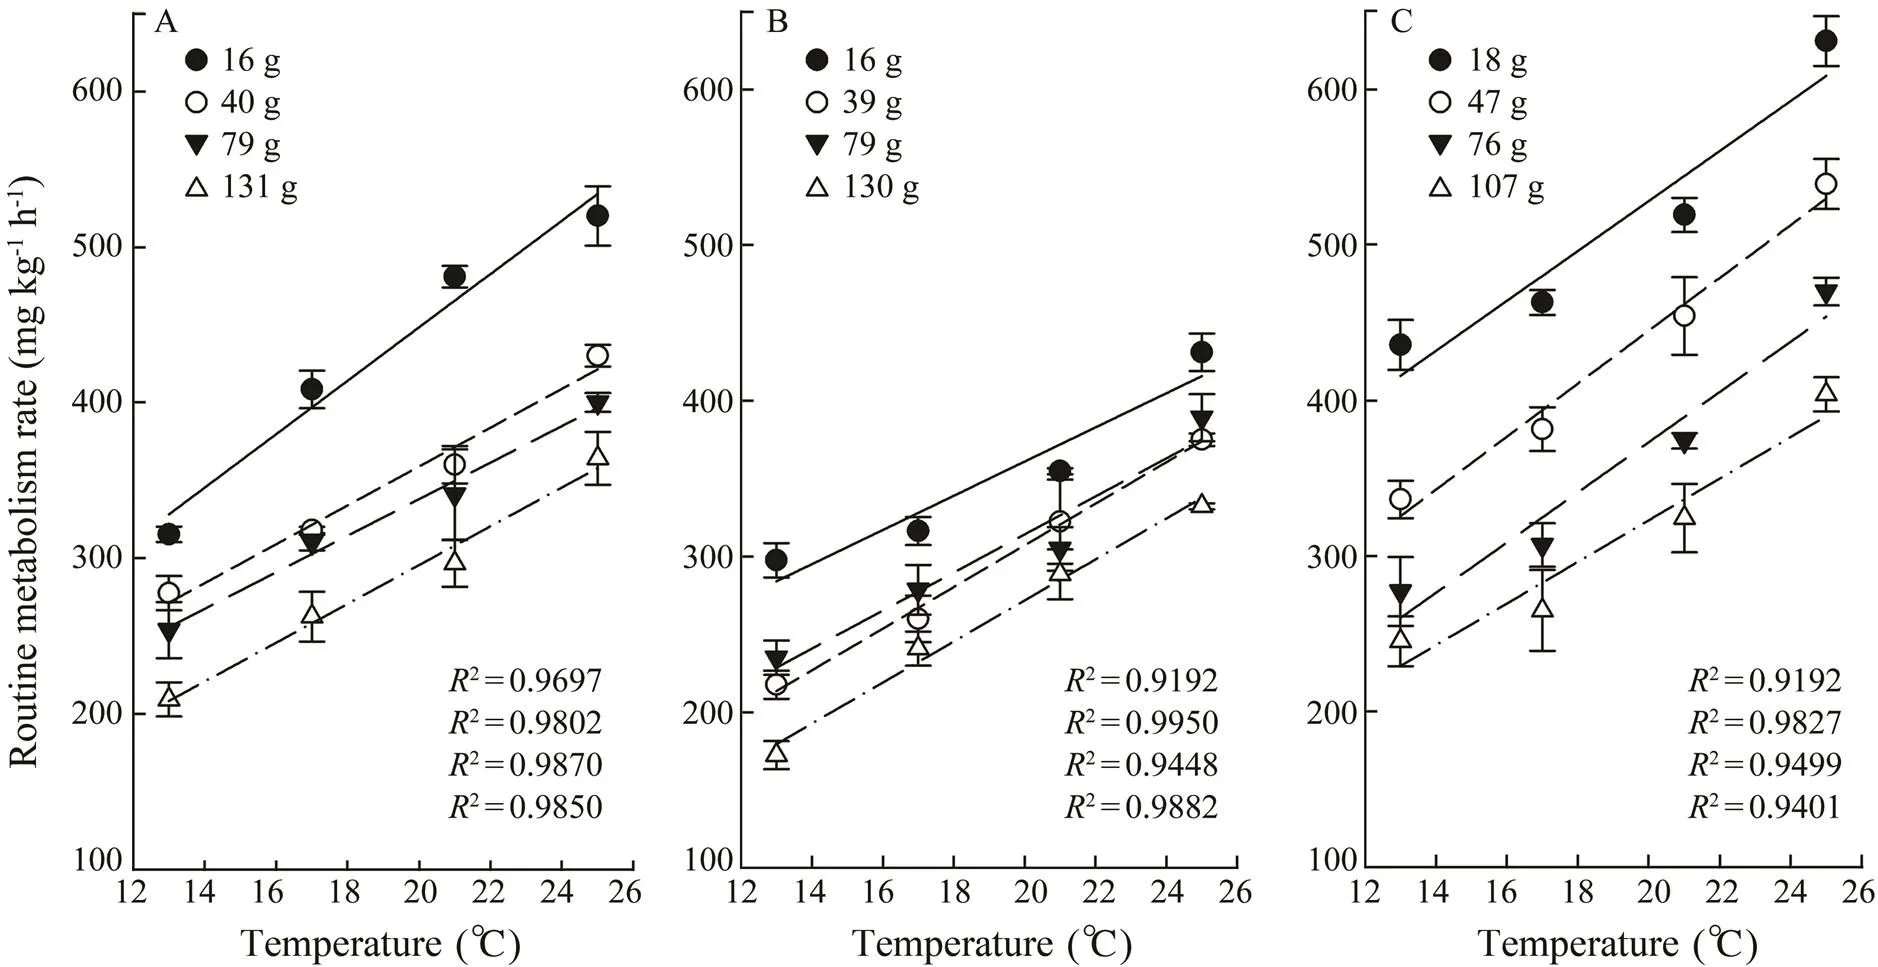
Fig.1 The routine metabolism rate of maple salmon (A), steelhead trout (B) and Atlantic salmon (C) with different weights and temperatures. Values are represented as mean±SE (n=3).
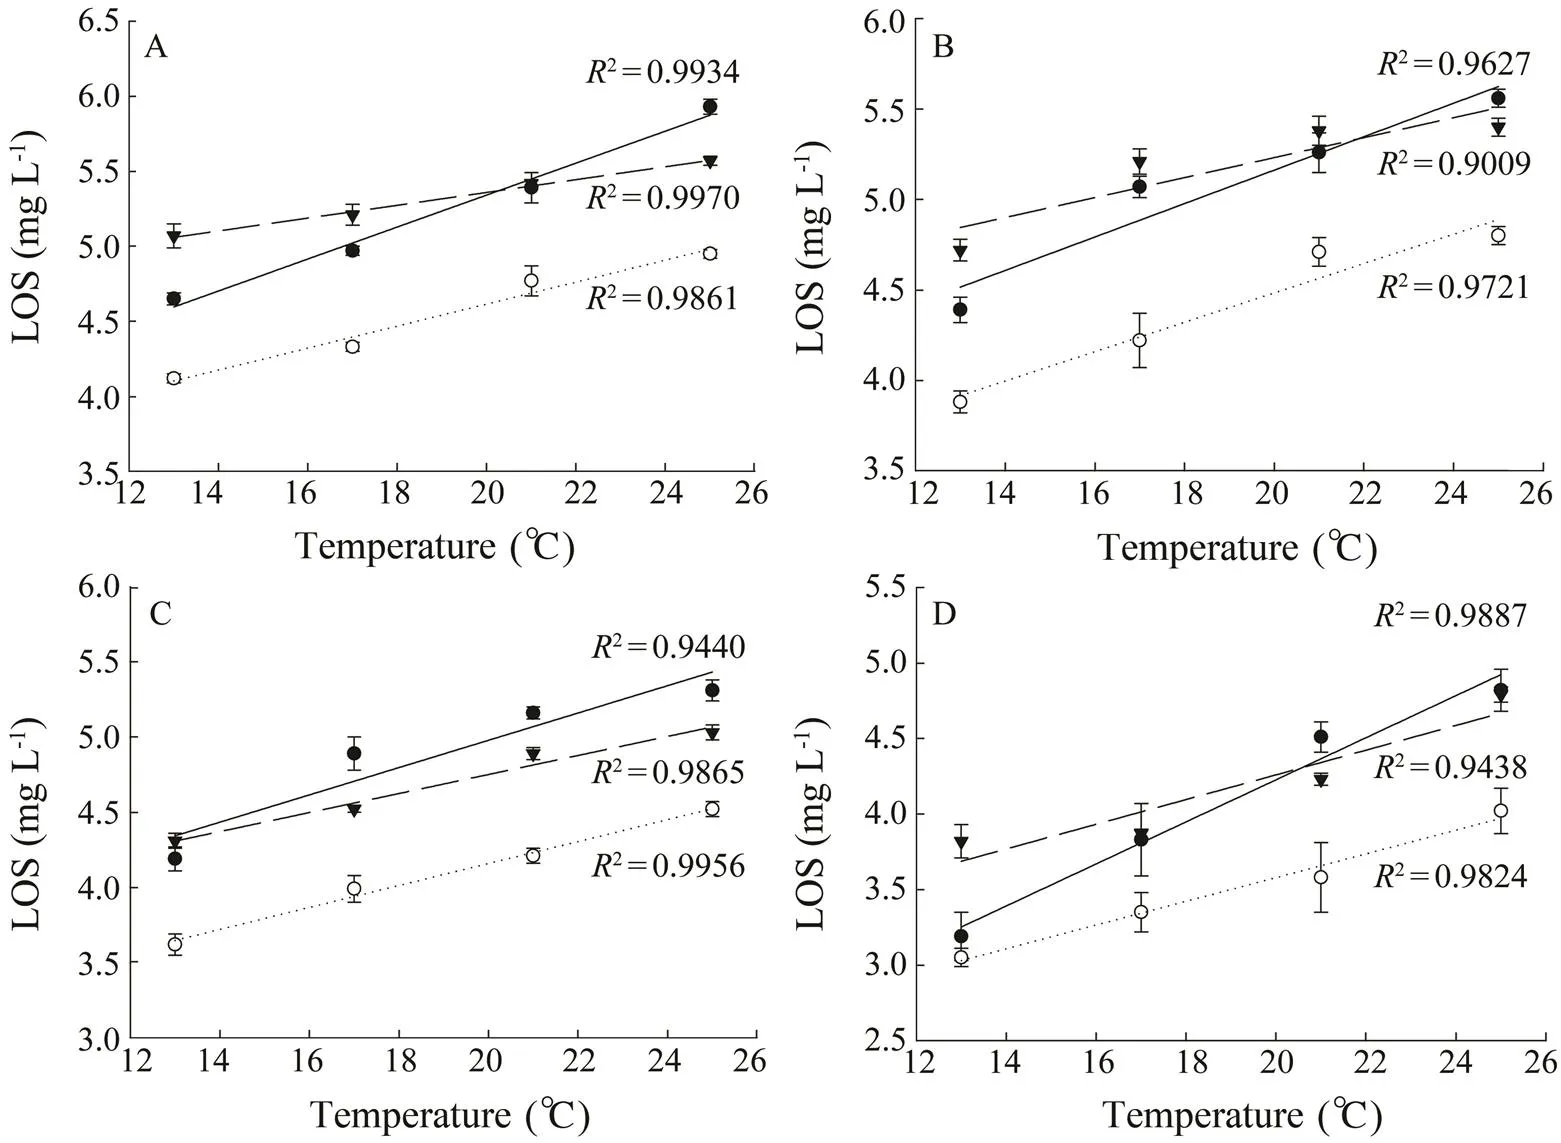
Fig.2 The effect of temperature (℃) on the limiting oxygen saturation (LOS, mgL?1) of different salmonids (●, maple trout; ○, steelhead trout; ▼, Atlantic salmon) with different weights (A, body weight was around 20g; B, 40g; C, 80g; D, 120g).
3.2 The Suffocation Point, MO2 and LOS of Three Kinds of Salmonid Fish
The suffocation points of the fish with different weights and temperatures are presented in Table 3. Results showed that the suffocation points of three kinds of salmonids significantly increased with temperature.
The MO2of three experimental fish is presented in Fig.1. In general, the MO2of the fish increased linearly with the rising of temperature, and it decreased with the increasing of body weight. The MO2of Atlantic salmon was the highest among the three salmonid fish. Steelhead trout had the lowest MO2under high temperature stress.
The LOS was significantly affected by kinds of fish, temperature and body weight (Table 4). The LOS of steel- head trout was significantly lower than those of maple trout and Atlantic salmon with all the temperatures and body weights (<0.05). The LOS of maple trout was significantly lower than that of Atlantic salmon with the body weight around 16g and 40g (<0.05). However, the LOS of maple trout was significantly higher than that of Atlantic salmon with the body weight about 80g (<0.05) (at the temperatures of 17℃, 21℃ and 25℃). The LOS of the fish increased linearly with the increasing of temperature for different body weights (Fig.2). The LOS of the fish generally decreased with the increase of body weight (Fig.3).
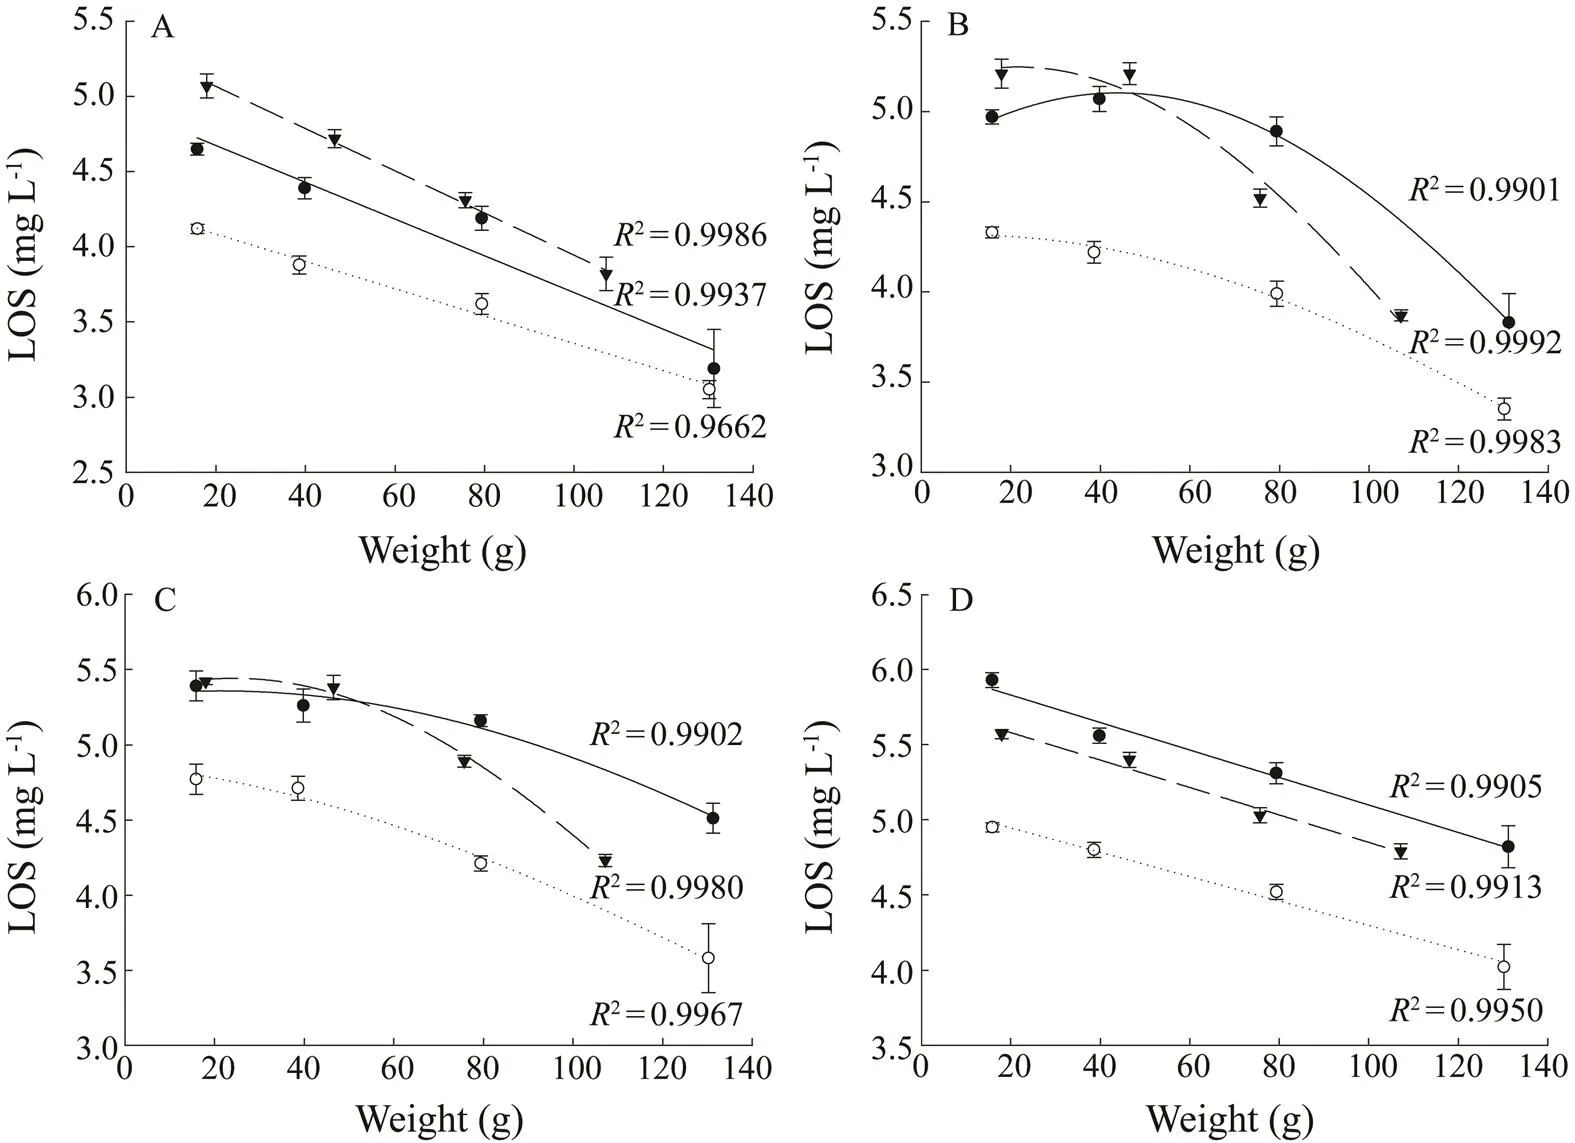
Fig.3 The effects of body weight (g) on the limiting oxygen saturation (LOS, mgL?1) of different salmonids (●, maple trout;○, steelhead trout; ▼, Atlantic salmon) at different temperatures (A, temperature was 13℃; B, 17℃; C, 21℃; D, 25℃).
4 Discussion
The CTMax test was used to select the thermal tolerant fish among three kinds of commercial farming salmonids. In the current study, CTMax was influenced by the heating rate ranging from 0.5℃min?1to 2℃d?1(Tables 1 and 2) which was assessed as one factor for CTMax tests. Our data (Table 1) indicated that both 1℃h?1and 2℃d?1were reasonable to detect the CTMax for salmonid fish. Similarly, Elliott and Elliott (1995) conducted an ex- periment with treatments of heating rates from 0.25℃d?1to 456℃d?1injuvenile brown trout () and Atlantic salmon.They concluded that a heating rate of 1℃h?1was the most suitable in these species. This finding was also in agreement with a study of Galbreath. (2004), in which treatments with heating rate of 2, 4 and 24℃d?1in brown trout, rainbow trout () and brook trout () were detected. They concluded that the group of 2℃d?1provides the greatest sensitivity heating rate for detecting CTMax. Hence, our results suggested that these two heating rates (1℃h?1and 2℃d?1) might be useful to select salmonids for commercial culture in sea cage. By the way, as sal- monid fishes live with variable environmental tempera- tures, the CTMax of different kinds can be described as a tool for fishes acclimated to different temperatures.
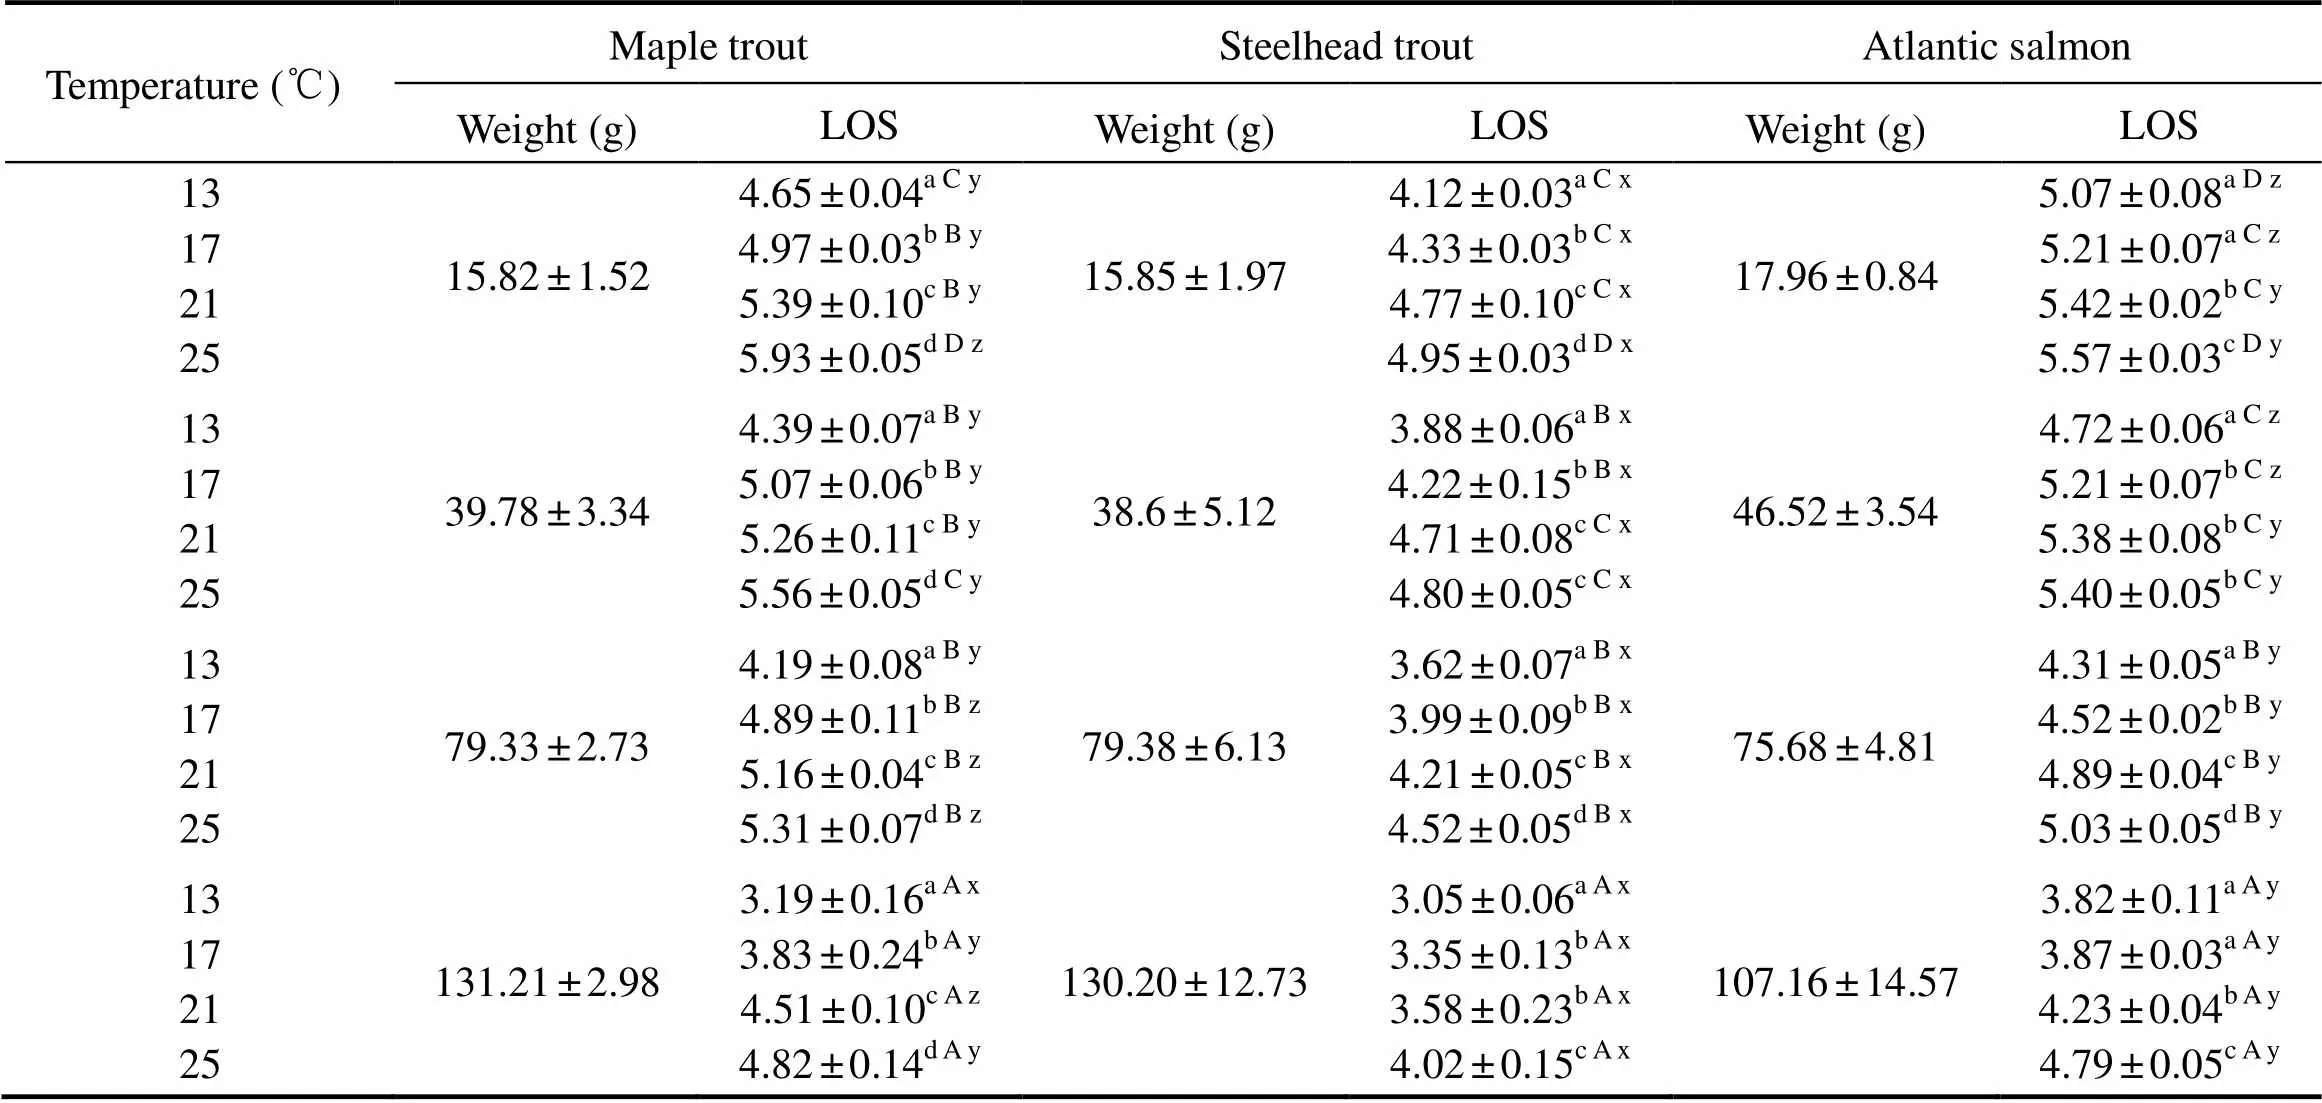
Table 4 The LOS of maple trout, steelhead trout and Atlantic salmon at different weights and temperatures
Notes: Data are presented as mean ± standard deviation (=3). Different letters indicate significant differences among different temperatures with same body weight and kind (a Limited information is available regarding to the dif- ferences in CTMax among different salmonids within the same test (Fields., 1987; Grande and Andersen, 1991; Lee and Rinne, 1980). In the present study, maple trout was the most tolerant one to higher temperature among these three fishes (heating rates of 0.5℃min?1, 1℃h?1and 2℃d?1) (<0.05). The CTMax of steelhead trout was significantly higher than those of Atlantic salmon (heating rates of 1℃h?1and 2℃d?1) (<0.05) (Table 1). Our results are similar with those of a study by Galbreath. (2004), in which the CTMax value was obtained at the heating rate of 2℃d?1comparing to heating rate of 4, 8, 24℃d?1in rainbow trout, brook trout and brown trout.However, our findings are not in consistent with those of some previous studies (Grande and Andersen, 1991; Lee and Rinne, 1980). Lee and Rinne (1980) showed no sig- nificant differences on CTMax at the heating rate of 1.2℃h?1among rainbow trout, brook trout and brown trout. Grande and Andersen (1991) observed no significant dif- ference of the CTMax in either brook trout and rainbow trout at heating rate of 1℃d?1or in brook trout and brown trout at heating rate of 2℃d?1. It is worthy to note that in the present study the Maple trout is a breeding variety, the steelhead trout is triploid, and the Atlantic salmon is dip- loid. These contradictory results may be due to different rearing conditions, heating rates, body weights and kinds. Body weight of the fish was another factor affecting the CTMax. In the present study, the body weights of fish ranging from 16g to 130g displayed a significant differ- ence with different kinds of salmonid fish and heating rates (Table 2). Our results showed that the smaller fish have higher CTMax for Maple trout and Atlantic salmon. Similarly, a significant higher CTMax has been observed for the smaller younger brook trout (average weight around 25g) compared to the larger older fish (average weight around 668g). It indicates that larger salmonid fish tend to be found in deeper water than smaller one. Therefore, salmonid fish living in deeper water were less likely to encounter high temperature threat. From a phy- sical standpoint, the larger fish had lower surface area to volume ratios, and heat might be difficult to pass through the fish body (Seebacher and Shine, 2004). In contrast, some studies showed no correlation between size/body weight and CTMax for black crappie () (total length range: 30.2–74.9mm) (Baker and Heidinger, 1996), brown trout (total length range: 65–112mm) and rainbow trout (total length range: 74–126mm) (Carline and Machung, 2001). One possible reason for these contradictory results is that a narrow range of fish size was used in these studies. The suffocation point and LOS are two important indicators for hypoxia tolerance (Atkins and Benfey, 2008; Castro, 2011; Chapman, 2002; Remen., 2014). Fish can survive above the suffocation point and retain full physiological functions above the LOS (Schur- mann and Steffensen, 1997). In the present study, suffo- cation point and LOS of the salmonid fish increased with the rising temperature and the decreasing body weight (Figs.2 and 3, Tables 3 and 4). This finding was consistent with a study of Barnes. (2011) in which the suffocation point and LOS of Atlantic salmon were higher at temperature of 22℃ than those at temperatures of 14℃ and 18℃. The reason of this phenomenon is that the MO2of fish increased with lower weight and higher tempera- ture, which was also existed in our study (Fig.1). It indi- cates that metabolism rate also increased with lower weight fish and higher temperature, and fish can be more sensitive to DO concentration with higher metabolism rate. It should be noted that all our experiments were conducted in the fasting status. In contrast,with feeding in perch () (Thuy, 2010) and Atlan- tic salmon(Remen., 2013), the LOS and MO2values were higher than our values. Thus, it indicates that hy- poxia tolerance of fish can be influenced by the satiation or fasting status of fish. In conclusion, among thesethree studiedsalmonid fishes, maple trout was the most tolerant kinds to high tempera- ture, and steelhead trout was the most tolerant to hypoxia. Their abilities to tolerate higher temperature were affected by their body weight and the heating rate, and their abilities to tolerate hypoxia increased with their increasing body weight and the decreasing water temperature. We thank those who have critically review this manus- cript and who helped us in this study at the Key Laboratory of Mariculture of Ministry of Education, Ocean Uni- versity of China. This research was supported by the National Natural Science Foundation of China (Nos. 31572634 and 31702364), and Shandong Province Key Research and Development Plan (Nos. 2016CYJS04A01 and 2017CX GC0106). Atkins, M. E., and Benfey, T. J., 2008. Effect of acclimation temperature on routine metabolic rate in triploid salmonids., 149 (2): 157-161. Baker, S. C., and Heidinger, R.C., 1996. Upper lethal tem- perature tolerance of fingerling black crappie., 48 (6): 1123-1129. Barnes, R., King, H., and Carter, C. G., 2011. Hypoxia tolerance and oxygen regulation in Atlantic salmon,from a Tasmanian population., 318 (3): 397-401. Becker, C. D., and Genoway, R. G., 1979. Evaluation of the critical thermal maximum for determining thermal tolerance of freshwater fish., 4 (3): 245-256. Beitinger, T. L., Bennett, W. A., and Mccauley, R.W., 2000. Temperature tolerances of North American freshwater fishes exposed to dynamicchanges in temperature., 58 (3): 237-275. Benfey, T. J., Mccabe, L. E., and Pepin, P., 1997. Critical ther- mal maxima of diploid and triploid brook charr,.,49 (2): 259-264. Brett, J. R., 1964. The respiratory metabolism and swimming performance of young sockeye salmon., 21 (5): 1183-1226. Brett, J. R., 1971. Energetic responses of salmon to temperature. A study of some thermal relations in the physiology and freshwater ecology of sockeye salmon ()., 11 (1): 99-113. Carline, R. F., and Machung, J. F., 2001. Critical thermal maxi- ma of wild and domestic strains of trout., 130 (6): 1211-1216. Castro, V., Grisdale-Helland, B., Helland, S. J., Kristensen, T., J?rgensen, S. M., Helgerud, J., and Takle, H., 2011. Aerobic training stimulates growth and promotes disease resistance in Atlantic salmon ()., 160 (2): 278-290. Chapman, L. J., Chapman, C. A., Nordlie, F. G., and Rosen- berger, A. E., 2002.Physiological refugia: Swamps, hypoxia tolerance and maintenance of fish diversity in the Lake Vic- toria region., 133 (3): 421-437. Chown, S. L., Addo-Bediako, A., and Gaston, K. J., 2002. Phy- siological variation in insects: Large-scale patterns and their implications., 131 (4): 587-602. Cocking, A. W., 1959. The effects of high temperatures on roach ()., 36 (1): 217-226. Dhillon, R. S., Yao, L., Matey, V., Chen, B. J., Zhang, A. J., Cao, Z. D., and Fu, S. J., 2013. Interspecific differences in hypo- xia-induced gill remodeling in carp., 86 (6): 727-739. Duarte, H., Tejedo, M., Katzenberger, M., Marangoni, F., and Baldo, D., 2012. Can amphibians take the heat? Vulnerability to climate warming in subtropical and temperate larval am- phibian communities., 18: 412-421. Elliott, J. M., and Elliott, J. A., 1995. The effect of the rate of temperature increase on the critical thermal maximum for parr of Atlantic salmon and brown trout., 47 (5): 917-919. Farrell, A. P., 2007. Cardiorespiratory performance during prolonged swimming tests with salmonids: A perspective on temperature effects and potential analytical pitfalls., 362 (1487): 2017-2030. Farrell, A. P., and Richards, J. G., 2009. Defining hypoxia: An integrative synthesis of the responses of fish to hypoxia., 27: 487-503. Fields, R., Lowe, S. S., Kaminski, C., Whitt, G. S., and Philipp, D. P., 1987. Critical and chronic thermal maxima of northern and Florida largemouth bass and their reciprocal F1 and F2 hybrids., 116(6): 856-863. Fu, S. J., Fu, C., Yan, G. J., Cao, Z. D., Zhang, A. J., and Pang, X., 2014. Interspecific variation in hypoxia tolerance, swimm- ing performance and plasticity in cyprinids that prefer dif- ferent habitats., 217 (4): 590-597. Galbreath, P. F., Adams, N. D., and Martin, T. H., 2004. In- fluence of heating rate on measurement of time to thermal maximum in trout., 241 (1-4): 587-599. Gamperl, A. K., and Farrell, A. P., 2004. Cardiac plasticity in fishes: Environmental influences and intraspecific differences., 207 (15): 2539-2550. Grande, M., and Andersen, S., 1991. Critical thermal maxima for young salmonids., 6 (3): 275-279. Hopkin, R. S., Qari, S., Bowler, K., Hyde, D., and Cuculescu, M., 2006. Seasonal thermal tolerance in marine Crustacea., 331 (1): 74-81. Hughes, G. M., 1973. Respiratory responses to hypoxia in fish., 13 (2): 475-489. Lee, R. M., and Rinne, J. N., 1980. Critical thermal maxima of five trout species in the southwestern United States., 109 (6): 632-635. Lutterschmidt, W. I., and Hutchison, V. H., 1997. The critical thermal maximum: History and critique., 75 (10): 1561-1574. Madeira, D., Narciso, L., Cabral, H. N., Diniz, M. S., and Vina- gre, C., 2014a. Role of thermal niche in the cellular response to thermal stress: Lipid peroxidation and HSP70 expression in coastal crabs., 36: 601-606. Madeira, D., Vinagre, C., Costa, P. M., and Diniz, M. S., 2014b. Histopathological alterations, physiological limits, and mole- cular changes of juvenilein response to thermal stress., 505: 253-266. Mette, R., Frode, O., Thomas, T., Albertk, I., and Rolferik, O., 2012. Effects of cyclic environmental hypoxia on physiology and feed intake of post-smolt Atlantic salmon: Initial res- ponses and acclimation., 326: 148-155. Mora, C., and Maya, M. F., 2006. Effect of the rate of tem- perature increase of the dynamic method on the heat tolerance of fishes., 31 (4): 337-341. Mora, C., and Ospína, A., 2001. Tolerance to high temperatures and potential impact of sea warming on reef fishes of Gor- gona Island (tropical eastern Pacific)., 139 (4): 765-769. Oppedal, F., Dempster, T., and Stien, L.H., 2011. Environ- mental drivers of Atlantic salmon behaviour in sea-cages: A review., 311 (1): 1-18. P?rtner, H., 2001. Climate change and temperature-dependent biogeography: Oxygen limitation of thermal tolerance in animals., 88 (4): 137-146. Peck, L. S., Clark, M. S., Morley, S. A., Massey, A., and Rossetti, H., 2009. Animal temperature limits and ecological relevance: Effects of size, activity and rates of change., 23 (2): 248-256. Powell, M. D., Fisk, D., and Nowak, B. F., 2000. Effects of graded hypoxia on Atlantic salmon infected with amoebic gill disease., 57 (4): 1047-1057. Remen, M., Aas, T. S., V?gseth, T., Torgersen, T., Olsen, R. E., Imsland, A., and Oppedal, F., 2014. Production performance of Atlantic salmon (L.) postsmolts in cyclic hypo- xia, and following compensatory growth., 45 (8): 1355-1366. Remen, M., Oppedal, F., Imsland, A. K., Olsen, R. E., and Torgersen, T., 2013. Hypoxia tolerance thresholds for post-smolt Atlantic salmon: Dependency of temperature and hypo- xia acclimation., 416 (2): 41-47. Rummer, J. L., Fangue, N. A., Jordan, H. L., Tiffany, B. N., Blansit, K. J., Galleher, S., Kirkpatrick, A., Kizlauskas, A. A., Pomory, C. M., and Bennett, W. A., 2009. Physiological tolerance to hyperthermia and hypoxia and effects on species richness and distribution of rockpool fishes of Loggerhead Key, Dry Tortugas National Park., 371 (2): 155-162. Sadler, J., Wells, R. M., Pankhurst, P. M., and Pankhurst, N. W., 2000. Blood oxygen transport, rheology and haematological responses to confinement stress in diploid and triploid Atlantic salmon,., 184 (3): 349-361. Schurmann, H., and Steffensen, J. F., 1997. Effects of temperature, hypoxia and activity on the metabolism of juvenile Atlantic cod., 50 (6): 1166-1180. Seebacher, F., and Shine, R., 2004. Evaluating Thermoregu- lation in reptiles: The fallacy of the inappropriately applied method., 77 (4): 688-695. Steinhausen, M. F., Sandblom, E., Eliason, E. J., Verhille, C., and Farrell, A. P., 2008. The effect of acute temperature increases on the cardiorespiratory performance of resting and swimming sockeye salmon ()., 211 (24): 3915-3926. Stevens, E. D., and Fry, F. E., 1974. Heat transfer and body temperatures in non-thermoregulatory teleosts., 52 (9): 1137-1143. Stevens, E. D., Sutterlin, A., and Cook, T., 1998. Respiratory metabolism and swimming performance in growth hormone transgenic Atlantic salmon., 55 (9): 2028-2035. Terblanche, J. S., Sinclair, B. J., Jaco, K. C., Mcfarlane, M. L., and Chown, S. L., 2005. The effects of acclimation on thermal tolerance, desiccation resistance and metabolic rate in(Coleoptera: Chrysomelidae)., 51 (9): 1013-1023. Thuy, N. H., Tien, L. A., Tuyet, P. N., Huong, D. T. T., Cong, N. V., Bayley, M., and Lefevre, S., 2010. Critical oxygen tension increases during digestion in the perch., 76 (4): 1025-1031. van Raaij, M. T., Pit, D. S., Balm, P. H., Steffens, A. B., and Ge, V. D. T., 1996. Behavioral strategy and the physiological stress response in rainbow trout exposed to severe Hypoxia., 30 (1): 85-92. Vinagre, C., Dias, M., Roma, J., Silva, A., Madeira, D., and Diniz, M. S., 2013. Critical thermal maxima of common rocky intertidal fish and shrimps–A preliminary assessment., 81: 10-12. Vinagre, C., Leal, I., and Flores, A. A., 2015. Effect of warming rate on the critical thermal maxima of crabs, shrimp and fish., 47: 19-25. September 20, 2017; November 28, 2017; September 4, 2018 ? Ocean University of China, Science Press and Springer-Verlag GmbH Germany 2018 . Tel: 0086-532-82031691 E-mail: dongsl@ouc.edu.cn (Edited by Qiu Yantao)Acknowledgements
 Journal of Ocean University of China2018年6期
- Journal of Ocean University of China的其它文章
- Optimization of Hydrolysis Conditions for the Isolation of Angiotensin-I Converting Enzyme (ACE) Inhibitory Peptides from Rhopilema hispidum
- Trophic Interaction in a Portunus rituberculatus Polyculture Ecosystem Based on Carbon and Nitrogen Stable Isotope Analysis
- The Effect of Hydrolysis with Neutrase on Molecular Weight, Functional Properties, and Antioxidant Activities of Alaska Pollock Protein Isolate
- An Evaluation on the Ratio of Plant to Animal Protein in the Diet of Juvenile Sea Cucumber (Apostichopus japonicus): Growth, Nutrient Digestibility and Nonspecific Immunity
- Weighted Correlation Network Analysis (WGCNA) of Japanese Flounder (Paralichthys olivaceus) Embryo Transcriptome Provides Crucial Gene Sets for Understanding Haploid Syndrome and Rescue by Diploidization
- Lead Induces Different Responses of Two Subpopulations of Phagocytes in the Holothurian Eupentacta fraudatrix
