
Solution to overcome the sparsity issue of annotated data in medical domain
2018-10-15 11:23:32AppanPujithaJayanthiSivaswamy
Appan K.Pujitha?,Jayanthi Sivaswamy
Center for Visual Information Technology,IIIT Hyderabad,Hyderabad,India?E-mail:pujitha.ak@research.iiit.ac.in
Abstract:Annotations are critical for machine learning and developing computer aided diagnosis(CAD)algorithms.Good performance of CAD is critical to their adoption,which generally rely on training with a wide variety of annotated data.However,a vast amount of medical data is either unlabeled or annotated only at the image-level.This poses a problem for exploring data driven approaches like deep learning for CAD.In this paper,we propose a novel crowdsourcing and synthetic image generation for training deep neural net-based lesion detection.The noisy nature of crowdsourced annotations is overcome by assigning a reliability factor for crowd subjects based on their performance and requiring region of interest markings from the crowd.A generative adversarial network-based solution is proposed to generate synthetic images with lesions to control the overall severity level of the disease.We demonstrate the reliability of the crowdsourced annotations and synthetic images by presenting a solution for training the deep neural network(DNN)with data drawn from a heterogeneous mixture of annotations.Experimental results obtained for hard exudate detection from retinal images show that training with refined crowdsourced data/synthetic images is effective as detection performance in terms of sensitivity improves by 25%/27%over training with just expert-markings.
1 Introduction
The latest paradigm shift of machine learning towards deep learning(DL)is spurred by its success on many longstanding computer vision tasks.This has motivated exploration of DL in wide-ranging medical applications from disease detection[1]to segmentation[2].Since DL is a data-driven framework,its success is contingent on the abundance of training data with expert annotations.Acquisition of expert annotations has always been difficult in the medical domain given the tedium of the task and the priority patient care takes over the annotation task.Data augmentation(via geometric transformations)for robust training is a popular solution adopted by the computer vision community.However,this has limitations in the medical domain as it does not introduce any real variability that is essential for robust learning of abnormalities,normal anatomy and so on.We examine this problem of sparsity of annotated data and explore two different avenues for solutions:(i)crowdsourcing and(ii)synthesis.
Crowdsourcing has been shown to be reliable[3-5]and useful to train classifiers[6].Annotations have been crowdsourced from fundus images,endoscopy and magnetic resonance imaging(MRI)of brain [3-5]for image level classification and reference correspondence.They have also been used to segment a surgical instrument from laparoscopic images[6].An active learning framework with crowdsourcing serves to reduce the burden on the crowd as it allows only low confident samples predicted by a model to be given to the crowd.Atlas forests were updated in[7]based on crowd refined annotations(on instrument boundary)to generate a new atlas.A convolutional neural network(CNN)was trained in[8]and the crowdsourced mitosis candidates(in a patch of size 33×33)were merged with an aggregation layer for updating the model.Crowd annotations are inherently noisy and hence merging them to derive a single ground truth(GT)is a key issue.Methods ranging from simple majority voting(MV)[6]to a stochastic modelling using expectation maximisation[4]and introducing an aggregation layer in a CNN[8]have been proposed in literature.
A second avenue that is free of human annotation is the synthesis route.Image synthesis has been attempted to generate digital brain phantoms[9]and whole retinal images[10]using complex modelling.These have been aimed at aiding denoising,reconstruction and segmentation solutions.Recently,simulation of brain tumours in MR images[11]has also been explored to aid computer aided diagnosis(CAD)algorithm development.
With the advent of DL,modelling of complex structures and synthesising images has become easier with a class of neural networks called generative adversarial networks or GAN[12].GAN is an architecture composed of two networks,namely,a generator and a discriminator.Functionally,the generator synthesises images from noise while the discriminator differentiates between real and synthetic images.GAN have recently been explored for a variety of applications:detection of brain lesions[13],predicting computed tomography from MRI images[14],synthesising normal retinal images from vessel mask[15],segmenting anatomical structures such as vessels[16]and optic disc/cup[17].
In this paper,we take up the problem of DR lesion detection from colour fundus images and explore the use of the aforementioned two avenues to aid the development of robust CAD solution.Our contribution is three-fold:
·We consider crowdsourcing as an independent(of model learning)activity and propose a scheme wherein only regions of interest(ROIs)are marked by the crowd to reduce the burden.A solution for merging crowd annotations is proposed based on assigning a reliability factor(RF)for each subject of the crowd.This leverages the abundant availability of image-level annotations to assess the subjects.
·We propose a GAN for generating images with pathologies in a controlled manner.
·Finally,we illustrate how a heterogeneous mixture of annotations derived from experts,crowd and through synthesis can address the data sparsity problem.
The rest of the paper is organised as follows.Section 2 describes the method of collecting crowd annotations,aggregating the annotations,generation of synthetic images and developing a DL solution for hard exudate(HE)detection.Section 3 describes the datasets used,implementation details,and evaluation metrics used in the assessment of the proposed solution is given in Section 4.Section 5 describes the experiments and results; finally the conclusion is given in Section 6.
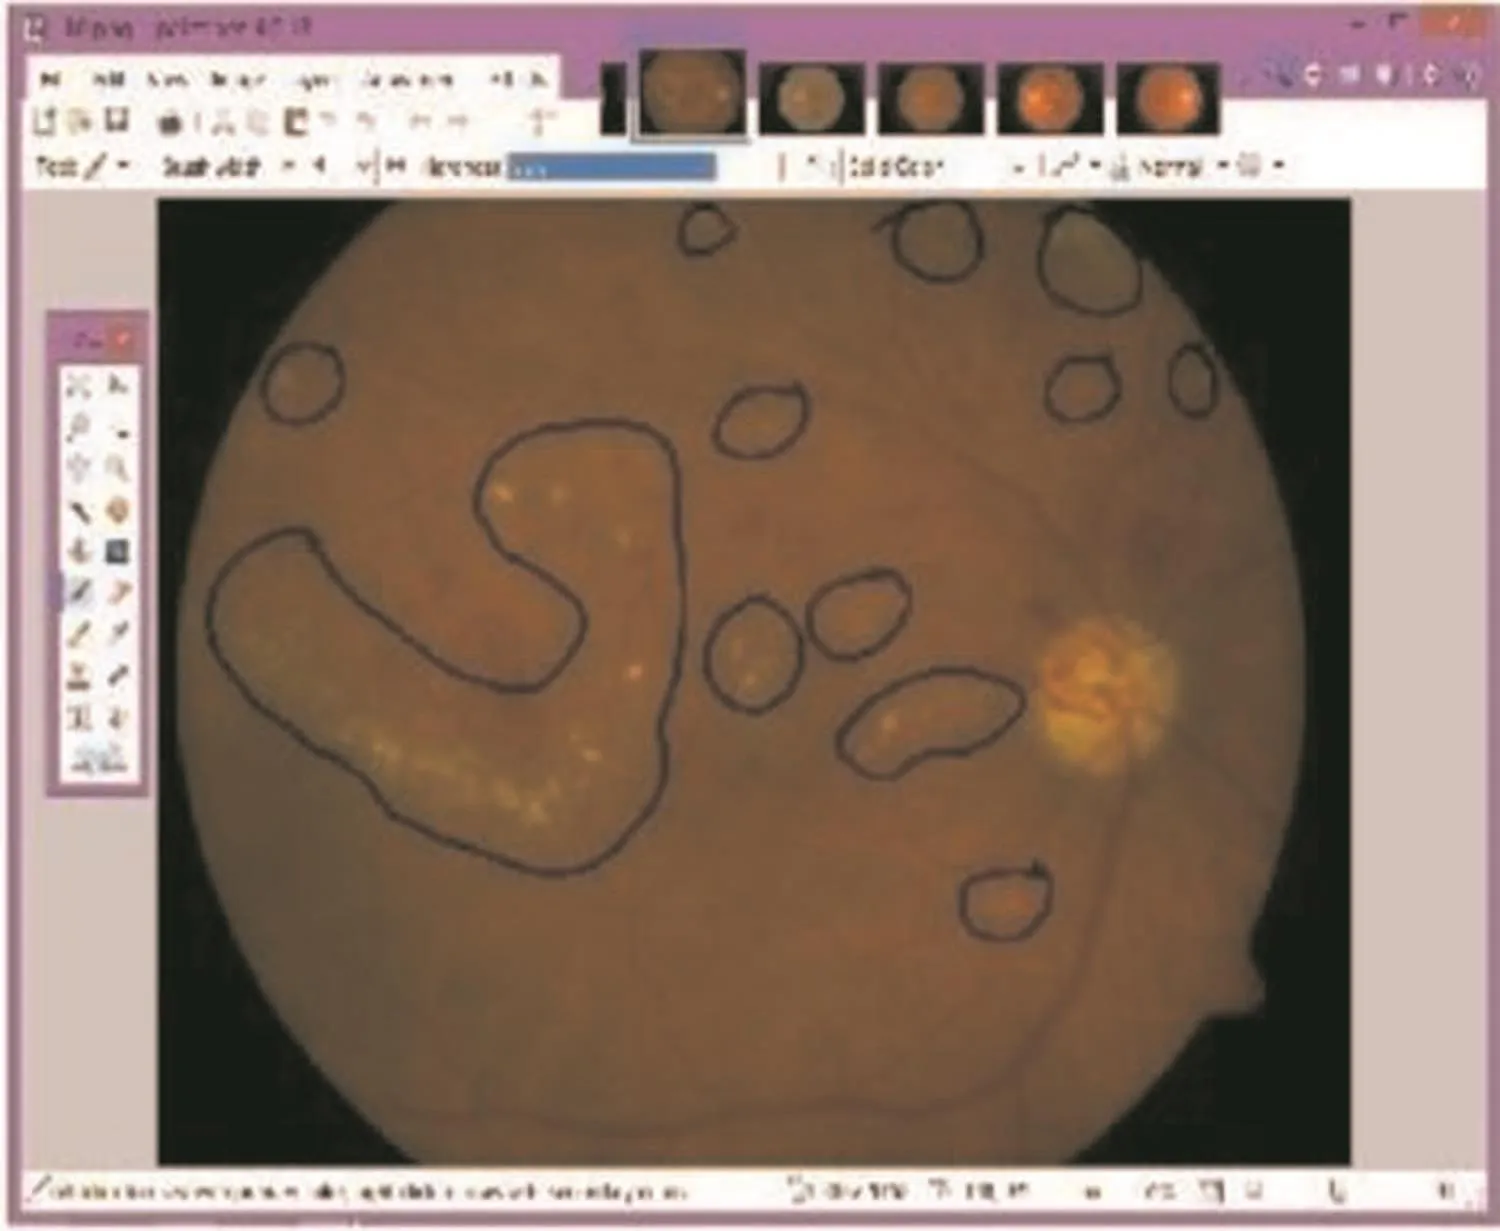
Fig.1 Screenshot of annotation tool.Lesions area marked with black boundary by a subject
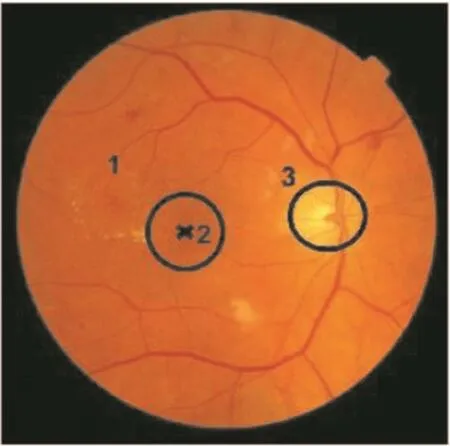
Fig.2 Fundus image with labelled regions:1 and 2 are zones of interest centred on macula and 3 is the optic disc
2 Methods
As a part of the pre-processing step,given retinal images are corrected for non-uniform illumination using luminosity and contrast normalisation[18].
2.1 Crowdsourcing annotations
2.1.1 Subjects and tasks:A total of 11 engineering students volunteered to be‘crowd’members/subjects.Four of these were familiar with fundus images(Lk)while the rest were not familiar with any medical images(Lnk).The task given to the crowd subjects was twofold:(i)determine whether the given image is normal/abnormal and(ii)if abnormal,mark the ROI containing HE.A freehand annotation tool(Paint.Net[http://www.getpaint.net/download.html.])was provided for the task.Fig.1 shows a screens hot of the annotation tool.
2.1.2 Materials:Hundred images were given to each subject.Of the 100,6 images were from DIARETDB1[19]which provides ROI markings from 4 experts.The remaining 94(70 with HE and 24 with no lesions)were from MESSIDOR[20]which provides annotations only at the image level.Thus,each of the 100 images that was selected for crowdsourcing has a label(normal/abnormal)and only 6 have additional information about locations of abnormalities.A sample image with HE is shown in Fig.2 along with relevant landmarks.
2.1.3 Processing crowd annotations:Our crowdsourcing exercise produced 11 annotations for each of the 100 images.These need to be integrated to derive a single annotation for every image.Merging the annotations via simple MV is likely to produce noisy annotation.Hence,a more elaborate procedure was designed for merging and GT derivation.This began with assigning a RF to every subject i,shown in Fig.3.Ideally,RF should rely on two factors:experience and performance of a subject.Experience can be determined via explicit queries.Performance needs to be assessed preferably by benchmarking against experts.A scheme was designed to reward a subject for good performance at both local ROI level(based on performance on the six images from DIARETDB1)and image level(based on known labels of all 100 images).A score is given for each of these factors and the final RF is computed as a weighted sum of these scores.The RF for the ith subject was defined as

where Sj?[0,2]are scores described in detail next;βi?[0,1]are the weights.It is possible to use expectation maximisation type of technique to find the optimal weights.In our experiments,weights were explicitly chosen to be 0/1 to evaluate the impact of individual factors on RF.

Fig.3 Scheme for
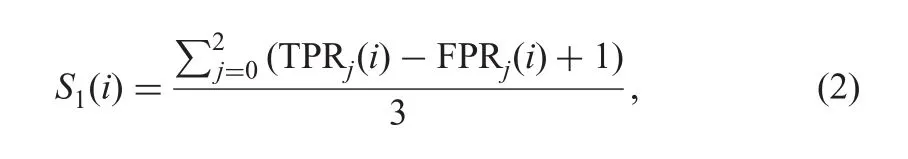
Scoring performance at an image level:The crowd annotation for an image is binary(normal or abnormal)which is unlike the expert annotation for MESSIDOR.The latter encodes the location of HE(standard grading[20]):0 indicating a normal image,1 if the lesions are outside a circular region(of diameter equal to optic disc)surrounding the macula and 2 if they are inside this circular region.Hence,we assign a score S1to a subject not only based on correct labelling of normal images but rewarding them when their ROI is in the correct zone.S1is designed to be based on the true positive rate(TPR)and false positive rate(FPR)()for each subject.The ROI location of an ith subject is compared with the zonal labels(j)from MESSIDOR and the score S1(i)is calculated as follows:
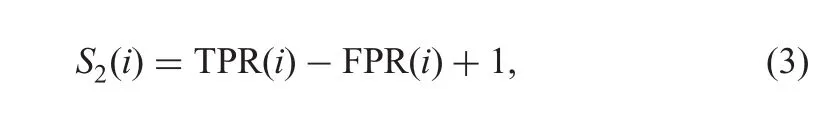
Scoring performance at local level:The local level performance is assessed and a score S2is assigned using the six images from DIARETDB1.Once again this is based on the TPR/FPR calculated by comparing the ROI marked by a subject with that of(consensus among 3)experts as follows:
Scoring experience level:This data is gathered with an explicit query on subject’s familiarity with medical images in general and fundus image in particular.A score of 2 is assigned to subjects familiar with fundus images and the rest are assigned 1
Merged output:The merged output H annotation of the crowd is obtained as a weighted(by RF)sum of individual subject annotations for each image j
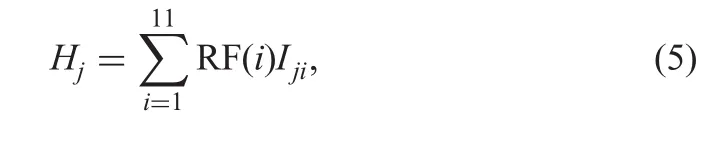
Here,Ijiis the annotated mask for the jth image by the ith subject.The MV based merging is when RF(i)=1,?i in the above equation.H map is finally binarised by thresholding.
2.1.4 DNN for aggregation of crowd annotations:We propose an alternate strategy to aggregate crowd annotations using DNN to train different models with different crowd annotations as GT.The performance of the subject is assessed based on the model performance on images which have local-level and image-level markings from the expert.In this strategy,the weights(β)are assigned by the DNN to different factors based on the performance of the subjects.
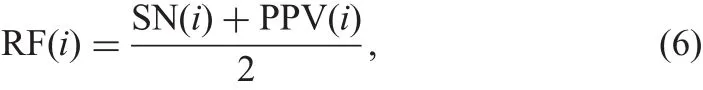
In this approach,we chose U-net to train the models.Let Cibe a subject and Iijbe the local annotation(image level annotation)given by the subject i on image j.Here,i?{1,2,...,11}as there are 11 subjects and j?{1,2,...,76}as 70 abnormal images from MESSIDOR and 6 images from DIARETDB1 are considered for training.Each U-net(Ui)is trained to detect HEs using the above 76 images for training and the corresponding crowd annotations Iijas GT.As there are 11 subjects we obtain a total of 11 U-net models.Now,each of the U-net model Uiis tested on DMED and DRiDB images to obtain pixel-wise classification.The sensitivity(SN)and positive predictive value(PPV)values are calculated for each model by comparing against the local GT marked by experts.Further,the pixel-level annotations are converted to image-level annotations to asses performance at image level.The RF for each subject is given based on these values as
2.2 GAN for synthesis of retinal images with pathologies
A second route we explore for deriving annotations is synthesis using a GAN made of a discriminator and a generator.A GAN learns a model as follows:the discriminator iteratively reduces its misclassification error by more accurately classifying the real and synthetic images while the generator aims to deceive the discriminator by producing more realistic images.GAN-based synthesis of normal retinal images has been demonstrated in[15](from a vessel mask)with a single U-net for the generator and a five-layer CNN for the discriminator.The U-net architecture consists of a contracting and an expansive path.The contracting path is similar to a typical CNN architecture,whereas in the expanding path,max-pooling is replaced by up-sampling.There are skip connections between contracting and expanding paths to ensure localisation.The U-net is modified in terms of the number of filters at each convolutional layer.The number of filters at each stage are reduced to half to simplify computations.
Our interest is in the synthesis of images with HE to serve as exemplars for different stages of DR,which is based on the locations and density of HE.Hence,we designed a GAN architecture(shown in Fig.4)with a generator consisting of two parallel networks:one with a vessel mask as input and another with a lesion mask as input.The output of the networks,based on the U-net architectures,are merged and fed to a third U-net architecture which generates the whole retinal image with lesions.The generator thus maps from vessel(vi)and lesion(li)masks to a retinal image(ri)using a mapping function.A five-layer CNN as in[15]is used for the discriminator to distinguish between the real and synthetic sets of images,with each set consisting of vessel and lesion masks along with retinal images.
The overall loss function that is to be optimised is chosen as a weighted combination of three loss functions:Ladv,LSSIMand L1as defined below in(7)-(10)to produce sharp and realistic images.
(i)The adversarial loss function Ladvis defined as
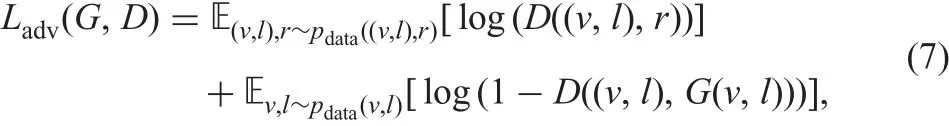
where E(v,l),r~p datarepresents the expectation of the log-likelihood of the pair((v,l),r)being sampled from the underlying probability distribution of real pairs pdata((v,l),r),while pdata(v,l)is the distribution of real vessel and lesion masks.
(ii)The structure similarity(SSIM)[21]index is useful in quantitatively measuring the structural similarity between two images(r,G(v,l)).It also has been shown to perform well for reconstruction and generation of visually pleasing images
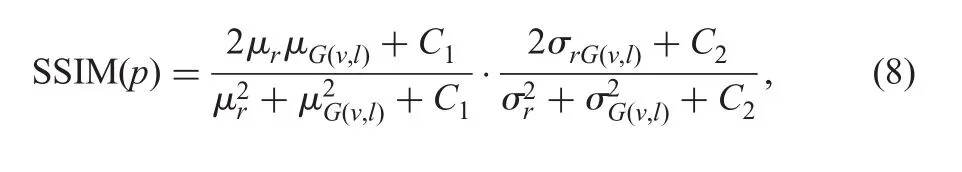
where(μr, μG(v,l))and(σr, σG(v,l))are the means and standard deviation computed over patch centred on pixel p,C1and C2are constants.The loss LSSIMcan be computed as
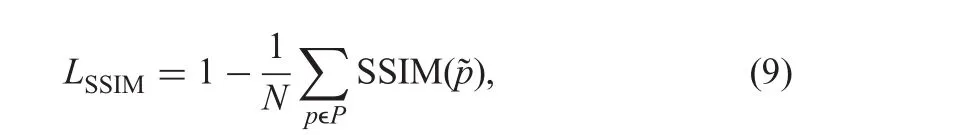
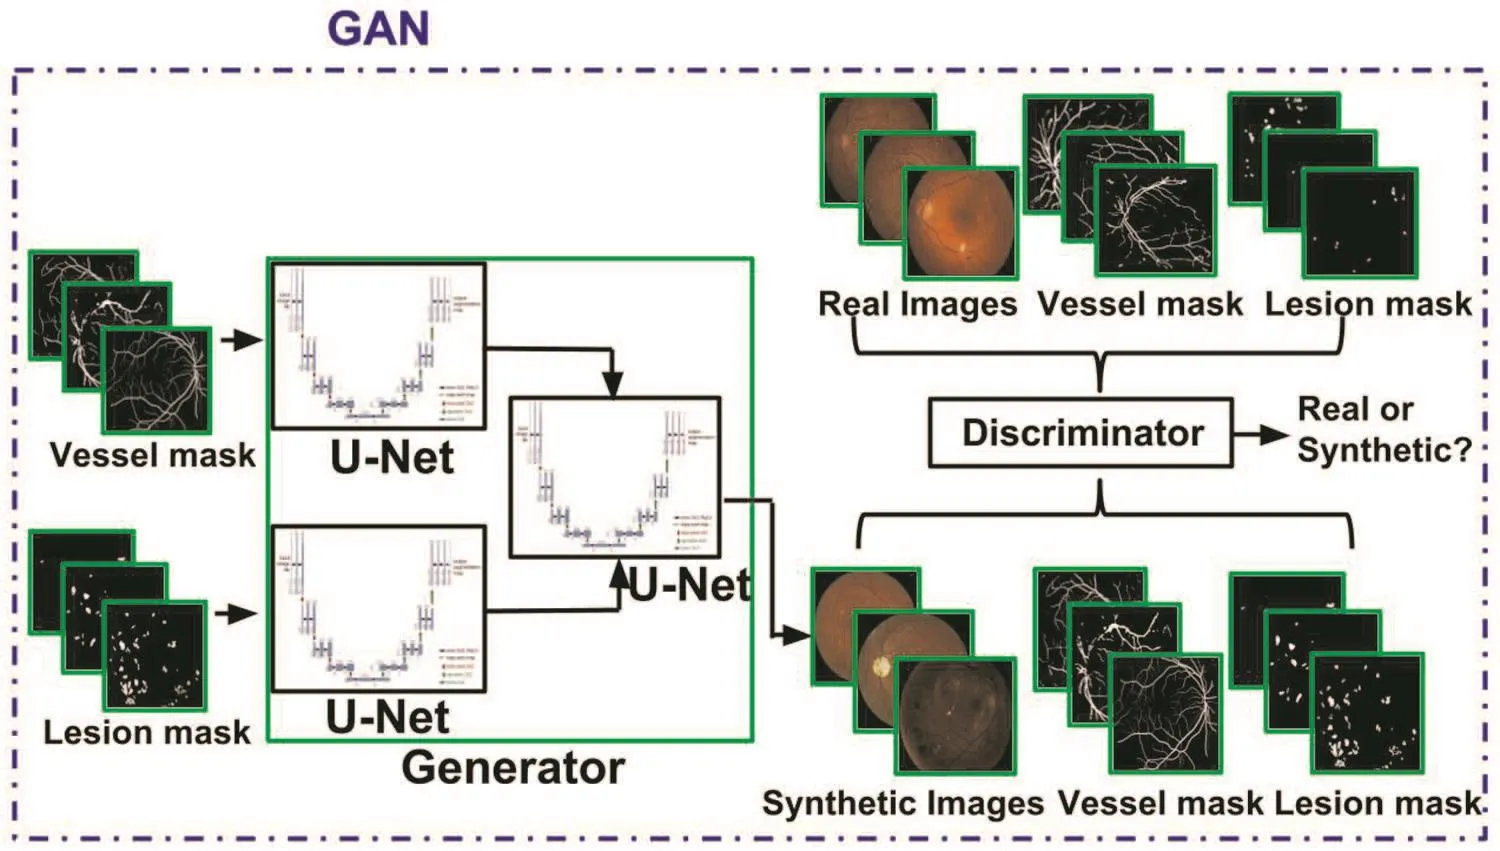
Fig.4 Proposed GAN architecture for generation of abnormal retinal images
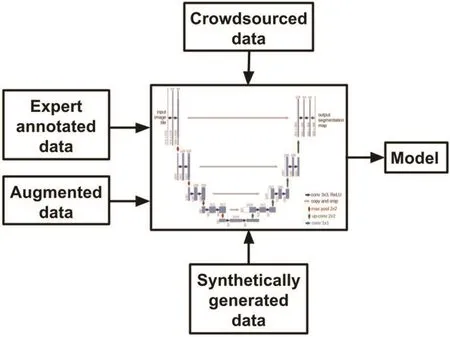
Fig.5 Different sources of training data for CADH
where?p is the centre pixel of a patch P in the image I.(iii)The loss function L1is used mainly to reduce artefacts and blurring and is defined as

The overall loss function to be minimised is taken to be

whereλ1andλ2control the contribution of the L1and LSSIMloss functions,respectively.
2.3 CAD solution for hard exudate detection
The U-Net[22]was chosen to build a CAD solution for HE detection.This solution will be referred to as CADH.A standard architecture was chosen as the aim is to demonstrate that the crowdsourced annotations and synthetic images(generated by our proposed GAN)are reliable resources in training even a basic U-net(Fig.5).
2.3.1 Preprocessing:Fundus images suffer from non-uniform illumination due to image acquisitions,camera limitations and so on.This is corrected using luminosity and contrast normalisation[18].The optic disc region in every image is masked out and inpainted.Fundus extension is applied to remove the black mask region and all images are normalised to have zero mean and unit variance.
2.3.2 Data augmentation:Data augmentation is done by applying random transformations to the images.This included random rotation between-25°and 25°,random translation in vertical/horizontal directions in the range of 50 pixels and random horizontal/vertical flips.For fairness,the number of images used for data augmentation are chosen to be equal to crowdsourced images/synthetic images.
3 Implementation details
3.1 Datasets
Four public datasets,namely,DRiDB [23],DMED [24],MESSIDOR and DIARETDB1 were used in this work.DMED has pixel-level annotations (from one expert) whereas DIARETDB1(four experts)and DRiDB(one expert)have ROI markings.The consensus marking of three experts was used to derive a binary mask in the case of DIARETDB1.The obtained binary mask was overlapped on the image and thresholded to get pixel-level lesion mask.Images from all datasets were cropped and resized 512×512 before feeding them to GAN or CADH.
3.2 DNN for aggregation of crowd annotations
The training of each U-net consisted of 70 abnormal images from MESSIDOR and 6 abnormal images from DIARETDB1 given to the crowd for annotation.After augmentation it accounts to a total of152 images for training with the corresponding crowd annotations as GT.The testing consists of 84 abnormal images,31 from DRiDB and 53 from DMED.
3.3 DNN for HE detection
Testing of CADH was done with DIARETDB1(42 images).Training ofCADH was done with the following datasets:expert annotations of DRIDB (31 images)and DMED (53 images);crowdsourced annotations of MESSIDOR(70 images).Additionally,annotations from synthetic images generated from GAN were also used which is described next.
3.3.1 Training data for GAN:Training of the GAN requires both lesion and vessel masks.The lesion mask for the training data is available from experts but vessels mask are available only for DRiDB.It is tedious and time consuming to mark the vessels in each of the retinal images.Hence,vessel masks were derived using a vessel segmentation method[25]which has proved to be robust to pathologies.
The synthetic retinal images were generated using GAN as follows.The required vessel and lesion masks were sourced from images selected randomly from DMED and DRiDB.The lesion masks were modified using the same random transformations such as flipping the lesions sector wise, flipping horizontally and vertically,rotations and translations.Retinal images containing HE are graded with severity levels as in[20].The lesions masks were derived to provide exemplars for each level using these rules.The position of lesions in each category was maintained by masking out few lesions or adding new lesions from another lesion mask randomly.
3.4 Computing details
The models were implemented in Python using Keras with Theano as backend and trained on a NVIDIA GTX 970 GPU,4 GB RAM.Training was done with random initialised weights for 2000 epochs by minimising the loss function using Adam optimiser.For model parameters,learning rate was initialised to 2×10⁻⁴for GAN and 1×10⁻⁵for CADH.A batch size of 4 was considered for both the cases and other parameters were left at default values.Class weights were outlined as the inverse ratio of the number of positive samples to negative samples and modified empirically.
4 Evaluation metrics
Several experiments were conducted to assess the relative merits of crowdsourcing and synthesis of annotated data for training CADH.The merit was determined based on the HE detection performance.Crowd annotations:Crowdsourced annotations were assessed with TPR,FPR and accuracy as evaluation metrics.As the image-level labels available from the experts is for three classes(labelled i:0,1 and 2),TPR,FPR and accuracy were calculated as follows:
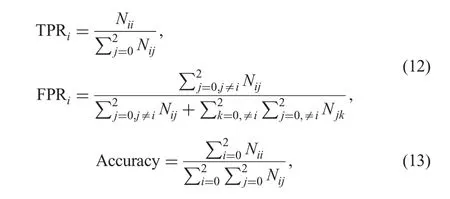
Here Nmndenotes the number of images with disagreement,the crowd label is m and the expert label is n.
Aggregation of crowdsourced annotations:The label aggregation is assessed using TPR,FPR in respective zones and also accuracy.The statistical significance of the aggregated labels against baseline is also calculated by using p-value.
Assessment of generated synthetic images:The synthesised images were evaluated quantitatively and qualitatively( five sample results are shown in Fig.6).The mean and standard deviation of the Qvscore described in[26]was computed over all images(42 abnormal)in DIARETDB1.
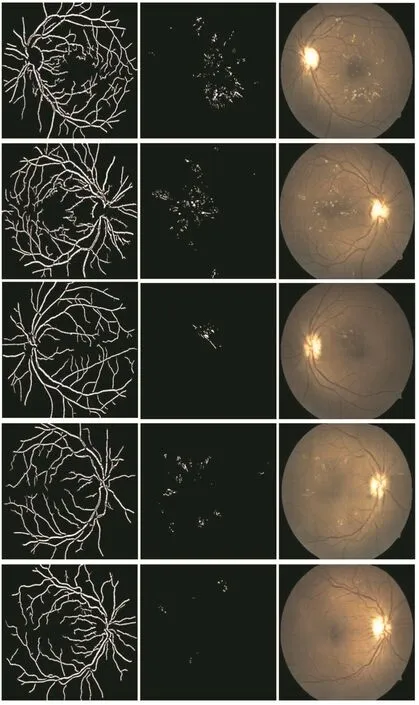
Fig.6 Results of GAN-based image synthesis.From left to right:vessel mask,lesion mask,synthetic image.From top to bottom: first two sample images fall under zone 1 and the last three images fall under zone 2
Assessment of CADH:The performance of CADH was evaluated using SN and PPV which are defined as follows:SN=(TP/(TP+FN))and PPV=(TP/(TP+FP)).To evaluate against the given local annotations by experts,the pixel-wise classification was converted to region-wise detection by applying connected component analysis and requiring at least 50%(but not exceeding more than 150%)overlap with manually marked regions to identify true positive detections(TP);else it is false positive(FP).If a region is marked by the expert but was not detected by the model then it is a false negative(FN).The area under the SN versus PPV curve(AUC)is also taken as a measure of performance.
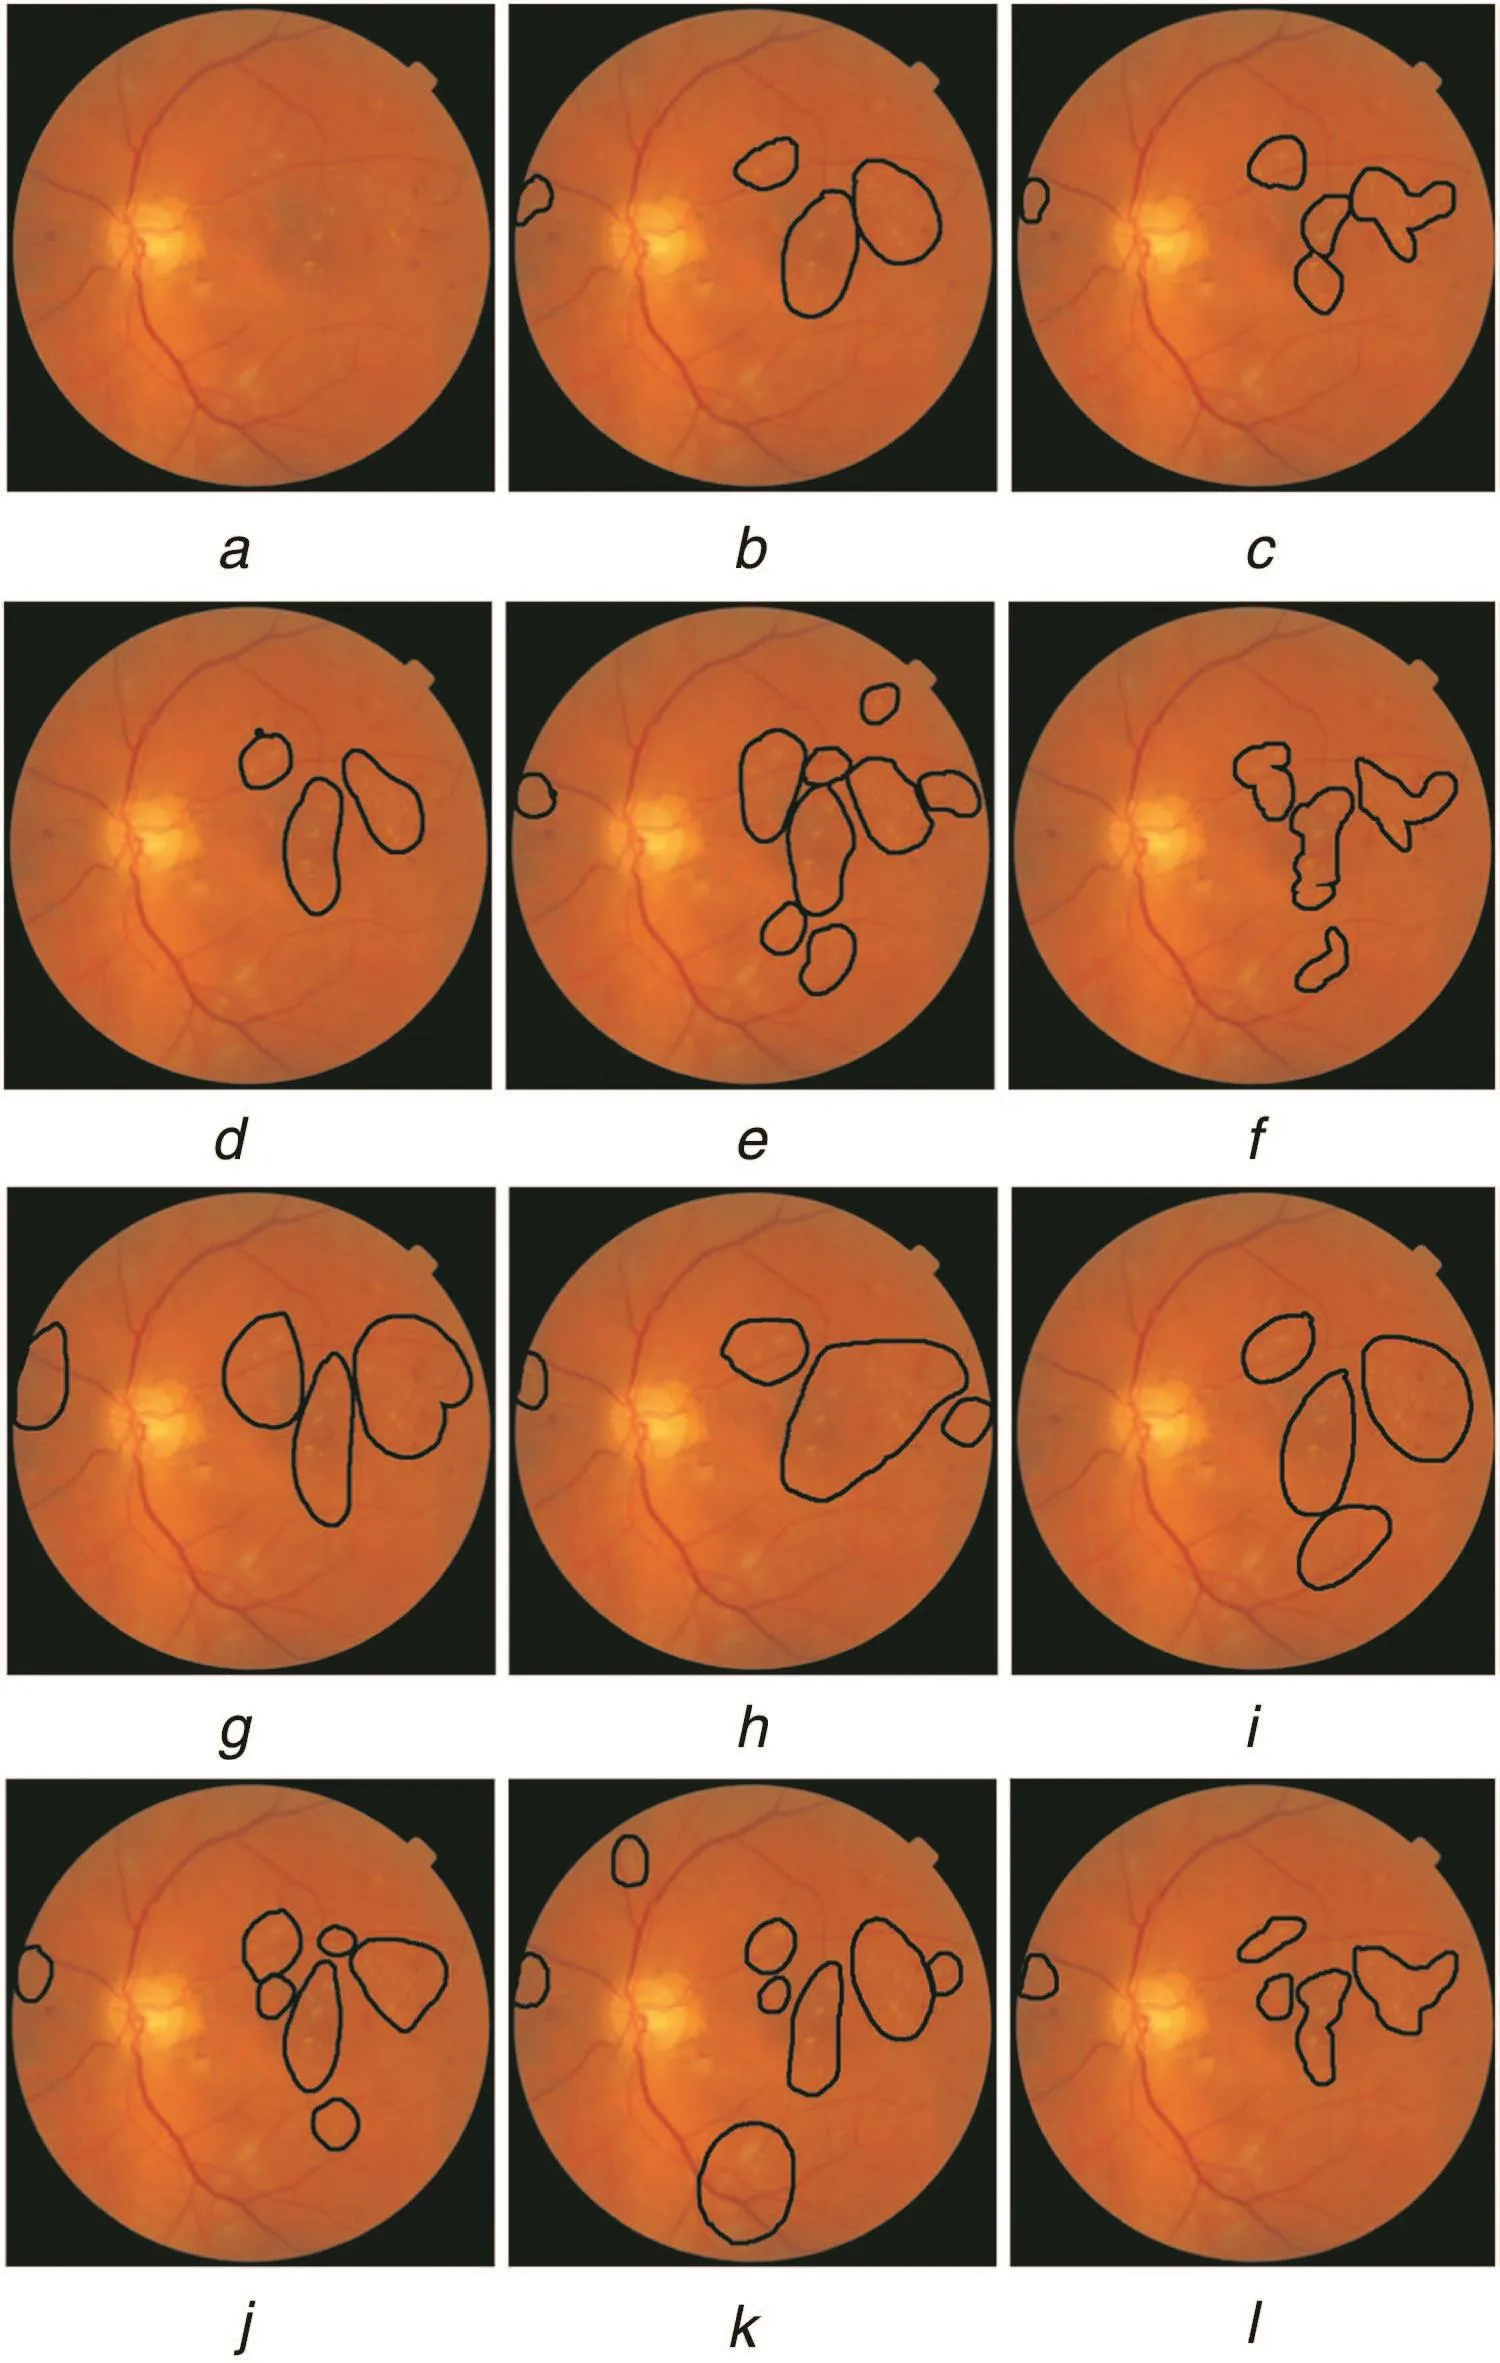
Fig.7 Sample image and crowd annotations a Original image
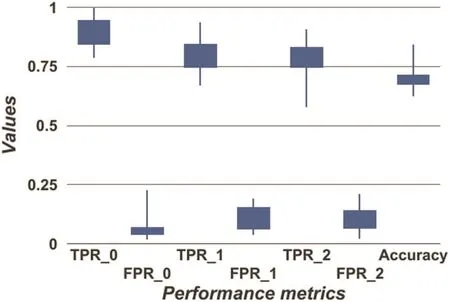
Fig.8 Crowd annotation performance
5 Results
5.1 Crowdsourced annotations
Crowdsourced data:The average time taken by subjects to mark ROI for 100 images was around 90 min.The task was conducted in two sessions of 50 images each.Hence,a total of 1100 markings were obtained in a span of two days.Sample retinal image and respective 11 crowd annotations are shown in Fig.7.The annotation performance is presented as a box plot in Fig.8 for the three zonal labels/classes.The mean accuracy obtained was 70% and the class-wise TPR/FPR figures were:89.6%/6.9%for normal/class 0;80.7%/11.29%for class 1 and 77.69%/10.7%for class 2.These indicate that the crowd is good at correctly identifying normal images and detects HE in the large zone 1 more accurately than much smaller±zone 2(size of optic disc)suggesting a bias towards the larger zone.Since lesions in zone 2 require immediate referral,urging subjects to scrutinise this zone may be advisable.
Aggregation of labels:The impact of the factors that contribute to the proposed RF(see(1))was studied by settingβi-0/1.The obtained TPR and FPR are listed in Table 1.The baseline is taken as MV in the following discussion.When only image-level performance is considered for the RF,there is a 10%improvement in accuracy which is boosted to 22% with the addition of performance at the local level.This is noteworthy as performance at local level is known only for 6%of the images given to the crowd.The aggregation result of different annotations considering different factors is shown in Fig.9.The aggregation of annotations using DNN gave an overall accuracy of 97%with TPR0-100%,FPR0-12%,TPR1-100%,FPR1-17%,TPR2-92%and FPR2-0%.
The statistical significance of different aggregations as compared to the baseline MV is shown in Table 2.This shows that I+L is statistically significant compared to other combinations.The p-value is also reported for different pair of combinations to estimate the importance of each factor(Table 3).We can infer that I+L can be considered as the alternate hypothesis,rejecting I+E and I+L+E.Experience does not seem to be beneficial for this experimentas performance suffers and also the statistical significance is less.This may be due to the fact that crowd was made of students and hence experience is really not meaningful.
5.2 Synthetic image generation(GAN)
Two sample retinal images(with HE)generated by the proposed GAN model are shown in Fig.6.The first two columns show the vessel and lesion masks given as input to the GAN.The next two columns show the synthesised and the corresponding real images.The synthesised images appear realistic yet differ from the real images in terms of background colour,texture and illumination.Lesion locations are roughly similar but sizes are different as lesion masks are not results of exact segmentations of lesions.
The mean/standard deviation of Qvcomputed over all images(42)with pathologies in DIARETDB1 are 0.074/0.017 and over all the synthetic images generated from vessel and lesion mask from DIARETDB1is0.082/0.02.These values are nearly equal indicating synthetic and real images are similar.
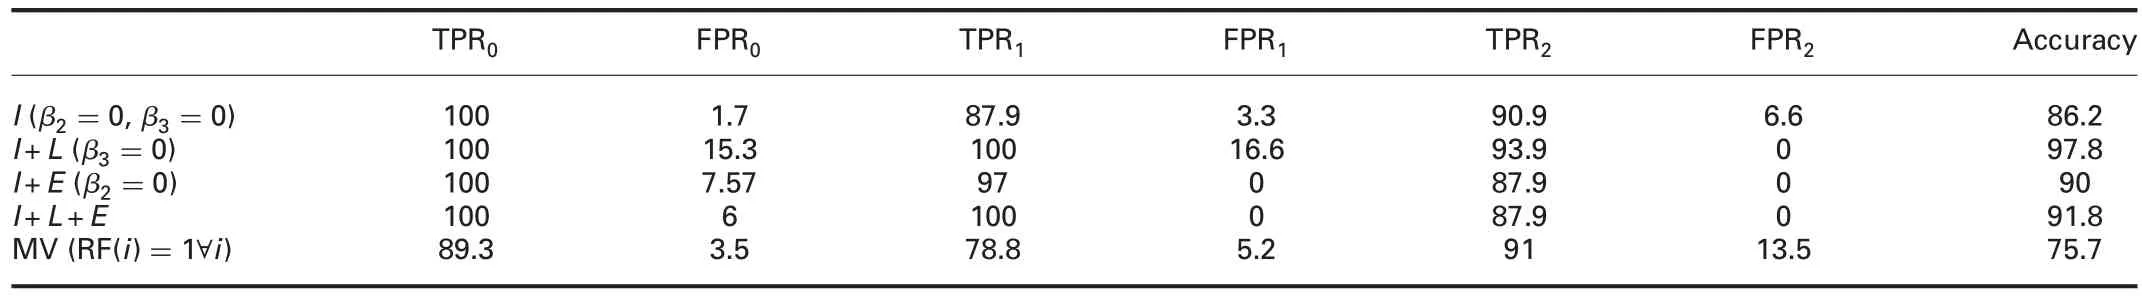
Table 1 Assessment of the scheme for label aggregation

Fig.9 Result of aggregation of the subject annotations considering different factors:I-image-level performance,L-local-level performance and E-experience of the subject.MV is taken as baseline when none of the above information is available
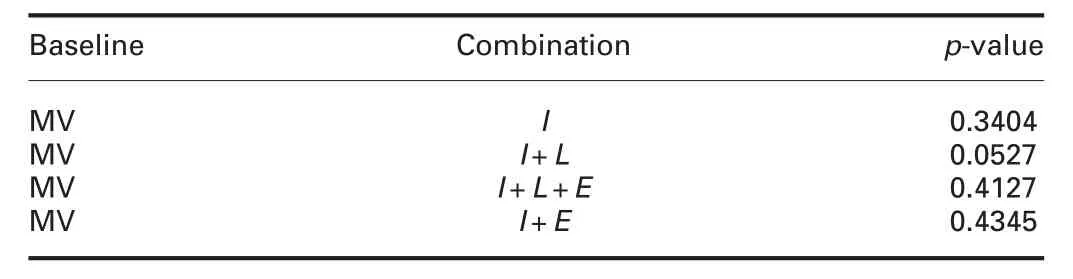
Table 2 Statistical significance value for label aggregation
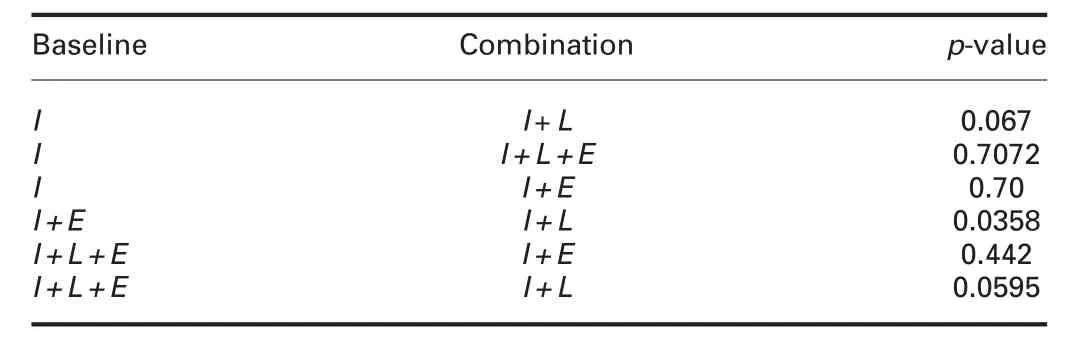
Table 3 Statistical significance value for different combination pairs of label aggregation
5.3 CADH for hard exudate detection
The utility of crowdsourcing and synthesising annotations for CAD development was tested separately with four CADH models derived by training with different training sets.Denoting the set of real images with expert annotations as E,the crowdsourced annotations as C(Experiment-1)and the set of synthetic images generated by GAN with the corresponding lesion masks as S(Experiment-2),the variants of the training set considered were:(i)only E,(ii)E with data augmentation(E+A),(iii)E and C(S),(iv)E,C(S)with data augmentation(E+(C(S))+A).For an SN of 90%,thecomputed PPV and AUC values are reported in Table 4 for Experiment-1 and Experiment-2.The SN versus PPV curve is shown in Fig.10a for Experiment-1 and Fig.10b for Experiment-2.The DNN out put for HE detection and the corresponding expert annotations is shown in Fig.11.
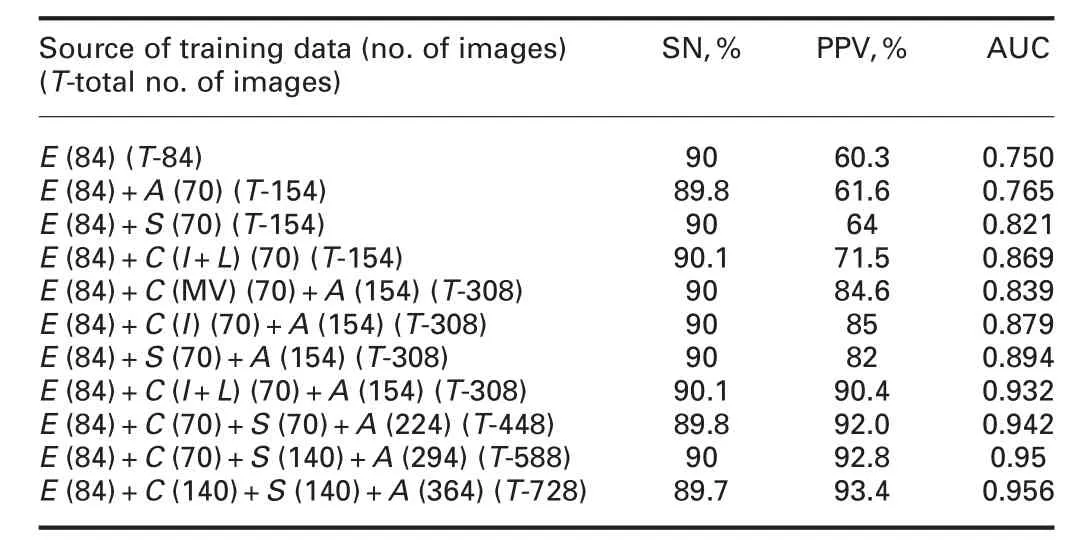
Table 4 HE detection performance with crowdsourced data and synthetic data for training(E,expert;A,augmentation;S,synthetic;and C,crowd)
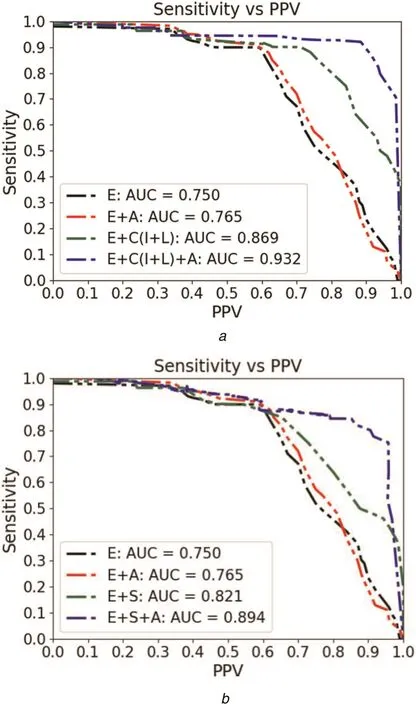
Fig.10 Performance of deep neural net(SN versus PPV)for HE detection
Based on the figures in the table,we observe the following.Data augmentation helps improve the AUC and PPV by about 2%each,whereas,inclusion of C(S)helps improve AUC by 15.8(9.5)%and PPV by 18.5(6.7)%.Finally,when the expert and crowdsourced annotations are augmented and added to the training set,there is a further improvement in AUC by 24.5(19)%and in PPV by 50(37)%.
Setting PPV to 70%results in SN values ranging from 70 to 96%(Fig.10);which is a 37%improvement in SN(similar level of improvement as that of PPV when SN is set constant at 90%).Thus,we conclude that C(S)is very effective in boosting the performance of CADH.
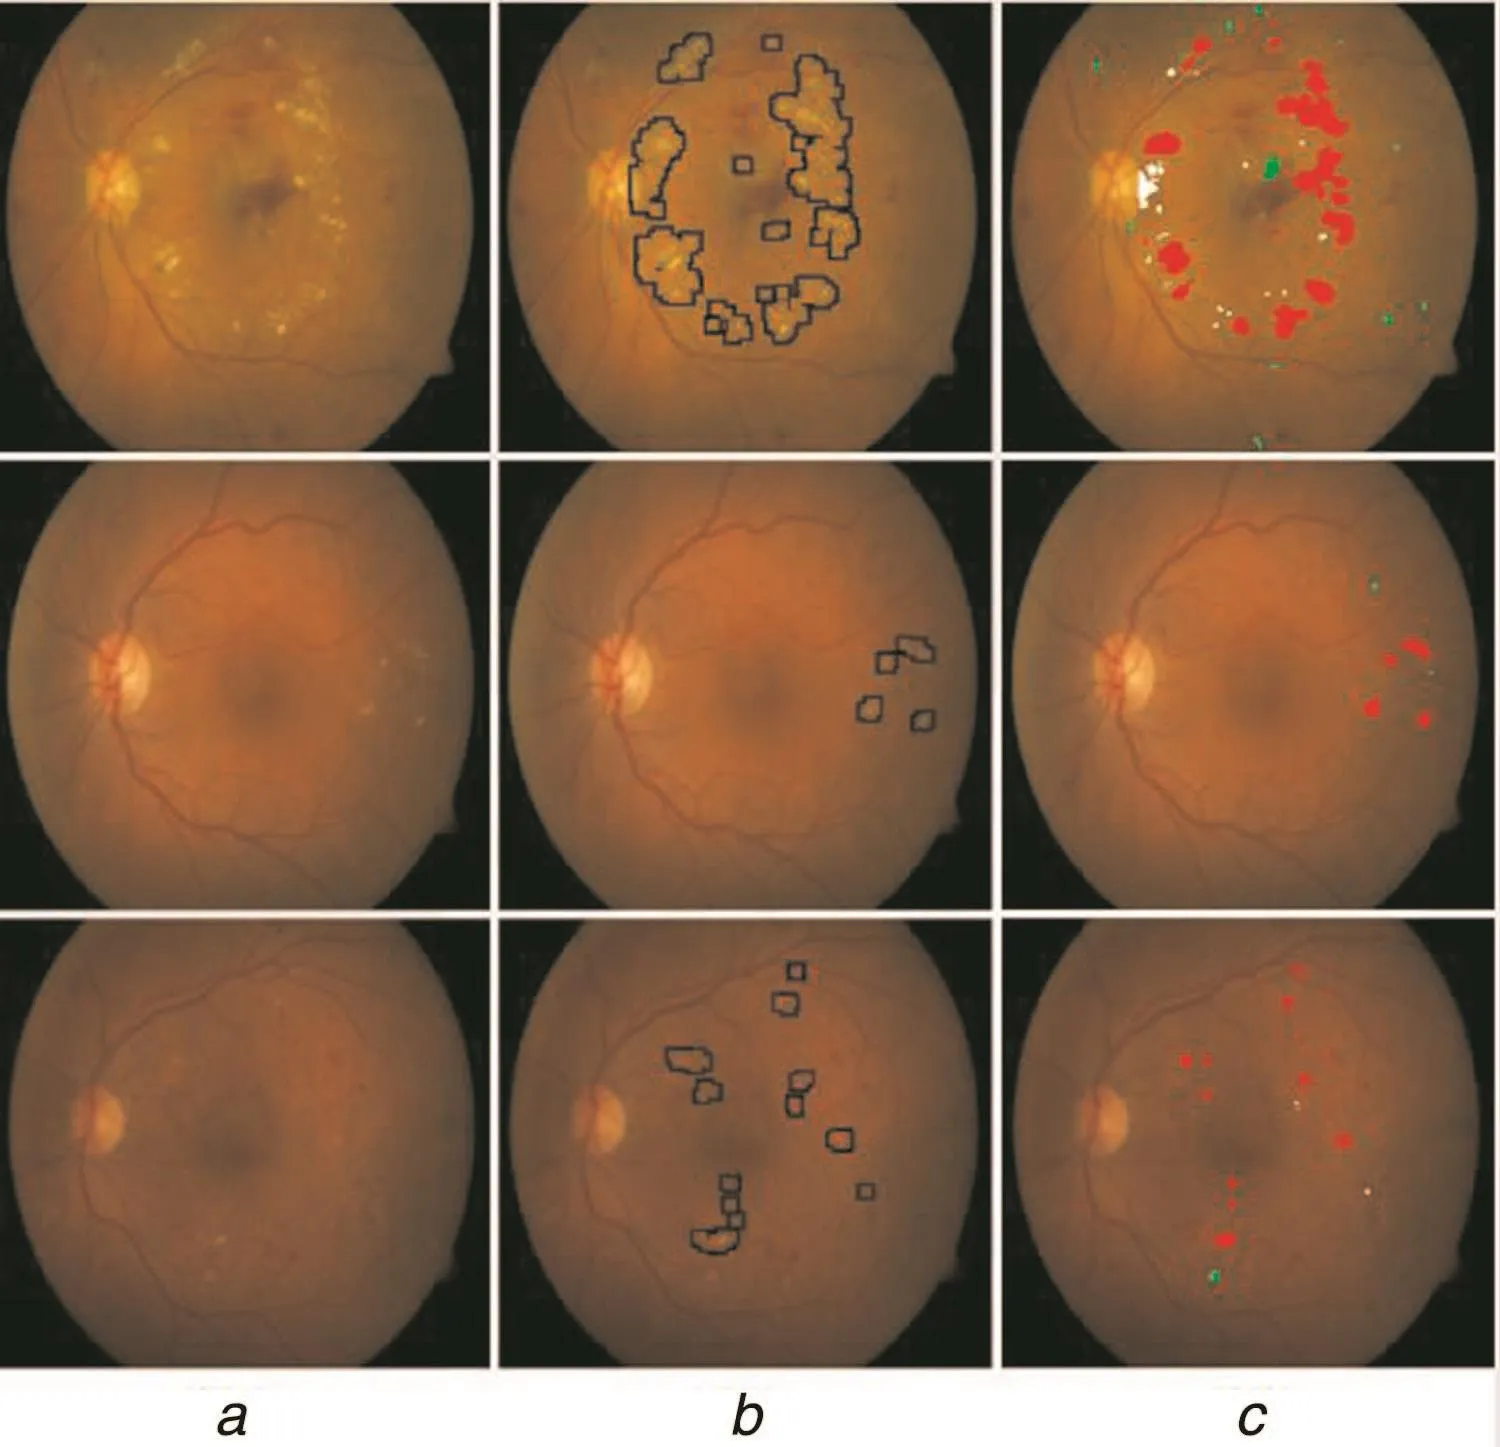
Fig.11 Detection performance of DNN for HE detection
Most recent approaches for HE detection report at the image level(normal or has HE)rather than at a local level.The exception is[27]where a DL-based approach is reported to have an F1score of 0.78 with SN and PPV of 78%each on 50 images from DRIDB dataset.
6 Conclusion
In this paper,we have explored two options to address sparsity of annotated medical data which is critical for developing DL-based CAD solutions.Crowdsourcing is an alternate source of annotation,but can be effective only if measures are taken to improve the reliability of annotations.The proposed RF concept aid weighted merging of annotations with good performance rewarded with a higher weight;it was shown that it is possible to assess the ‘goodness’of a performance with very little cost(getting the crowd to annotate a small set of images previously annotated by experts).GAN-based synthesis is another alternative.A GAN solution was proposed to generate the retinal images with HE using vessel and lesion masks.This approach gives user a greater control as retinal images can be synthesised with any type of severity,by providing the corresponding lesion mask.Our experiment results indicate that overall,the crowdsourced annotations and synthetic data(by themselves or in combination)are reliable for developing DL-based CAD solutions.Specifically,annotations via crowdsourcing data proved to be more effective than via synthesis(a PPV of 90%versus 82%for SN of 90%).However,crowdsourcing also involves manual work and hence comes at a higher cost.Combining the data from crowd and synthetic sources is a good compromise as it was seen to improve the performance(to 92%PPV).Synthetic data can be easily generated in abundance.The effect of changing the relative proportion of synthetic data in the training set can be seen from the results in the last two rows of Table 4.They suggest that increasing the proportion of synthetic data can boost the performance though the quantum of improvement appears small.The reasons for the same could be that the lesion masks were randomly chosen and hence the actual variability in data was not captured in training.A better scheme to ensure this variability could yield better improvement.Based on the encouraging results,future work can be directed towards exploring such solutions for other abnormality detection problems as well other modality images.
7 Acknowledgment
This work was supported by the Department of Electronics and Information Technology,Government of India under grant:DeitY/R&D/TDC/13(8)/2013.
8 References
[1] Gulshan,V.,Peng,L.,Coram,M.,et al.:‘Development and validation of a deep learning algorithm for detection of diabetic retinopathy in retinal fundus photographs’,JAMA,2016,316,(22),pp.2402-2410
[2] de Brebisson,A.,Montana,G.:‘Deep neural networks for anatomical brain segmentation’,CoRR,vol.abs/1502.02445,June 2015
[3] Mitry,D.,Peto,T.,Hayat,S.,et al.:‘Crowdsourcing as a novel technique for retinal fundus photography classification:analysis of images in the EPIC Norfolk cohort on behalf of the UKBiobank Eye and Vision Consortium’,PLoS ONE,2013,8,(8),pp.1-7
[4] Maier-Hein,L.,Mersmann,S.,Kondermann,D.,et al.:‘Crowdsourcing for reference correspondence generation in endoscopic images’.Medical Image Computing and Computer-Assisted Intervention(MICCAI),Boston,MA,USA,September 2014,pp.349-356
[5] Ganz,M.,Kondermann,D.,Andrulis,J.,et al.:‘Crowdsourcing for error detection in cortical surface delineations’,Int.J.Comput.Assist.Radiol Surg.,2017,12,pp.12-161
[6] Maier-Hein,L.,Mersmann,S.,Kondermann,D.,et al.:‘Can masses of nonexperts train highly accurate image classifiers?’.Medical Image Computing and Computer-Assisted Intervention(MICCAI),Boston,MA,USA,January 2014,pp.438-445
[7] Maier-Hein,L.,Rob,T.,Grohl,J.,et al.:‘Crowd-algorithm collaboration for largescale endoscopic image annotation with confidence’.Medical Image Computing and Computer-Assisted Intervention(MICCAI),Athens,Greece,October 2016,pp.616-623
[8] Albarqouni,S.,Baur,C.,Achilles,F.,et al.:‘AggNet:deep learning from crowds for mitosis detection in breast cancer histology images’,IEEE Trans.Med.Imag.,2016,35,pp.1313-1321
[9] Collins,L.,Zijdenbos,A.,Kollokian,V.,et al.:‘Design and construction of a realistic digital brain phantom’,IEEE Trans.Med.Imaging,1998,17,(3),pp.463-468
[10] Bonaldi,L.,Menti,E.,Ballerini,L.,et al.:‘Automatic generation of synthetic retinal fundus images:vascular network’.Simulation and Synthesis in Medical Imaging:SASHIMI,Held in Conjunction with MICCAI,Loughborough,UK,October 2016,pp.167-176
[11] Havaei,M.,Davy,A.,Warde-Farley,D.,et al.:‘Brain tumor segmentation with deep neural networks’,Med.Image Anal.,2017,35,pp.18-31
[12] Goodfellow,I.,Pouget-Abadie,J.,Mirza,M.,et al.:‘Generative adversarial nets’,Adv.Neural.Inf.Process.Syst.,2014,27,pp.2672-2680
[13] Rezaei,M.,Harmuth,K.,Gierke,W.,et al.:‘Conditional adversarial network for semantic segmentation of brain tumor’,CoRR,vol.abs/1708.05227,August 2017
[14] Nie,D.,Trullo,R.,Petitjean,C.,et al.:‘Medical image synthesis with context-aware generative adversarial networks’.Medical Image Computing and Computer-Assisted Intervention,MICCAI,Quebec City,Canada,September 2017,pp.417-425
[15] Costa,P.,Galdran,A.,Meyer,M.,et al.:‘Adversarial synthesis of retinal images from vessel trees’.Image Analysis and Recognition:14th Int.Conf.,ICIAR,Montreal,Canada,2017,pp.516-523
[16] Virdi,T.,Guibas,J.T.,Li,P.S.:‘Synthetic medical images from dual generative adversarial networks’,ArXiv e-prints,September 2017
[17] Shankaranarayana,S.M.,Ram,K.,Mitra,K.,et al.:‘Joint optic disc and cup segmentation using fully convolutional and adversarial networks’.Fetal,Infant and Ophthalmic Medical Image Analysis:OMIA Held in Conjunction with MICCAI,Québec City,Canada,2017,pp.168-176
[18] Joshi,G.,Sivaswamy,J.:‘Colour retinal image enhancement based on domain knowledge’.Indian Conf.on Computer Vision,Graphics and Image Processing,Bhubaneswar,India,December 2008,pp.591-598
[19] Kauppi,T.,Kalesnykiene,V.,Kamarainen,J.K.,et al.:‘Diaretdb1 diabetic retinopathy database and evaluation protocol’,2007
[20] Decencière,E.,Zhang,X.,Cazuguel,G.,et al.: ‘Feedback on a publicly distributed database:the Messidor database’,Image Anal.Stereol.,2014,33,pp.231-234
[21] Wang,Z.,Conrad Bovik,A.,Rahim Sheikh,H.,et al.:‘Image quality assessment:from error visibility to structural similarity’,IEEE Trans.Image Process.,2004,13,(4),pp.600-612
[22] Ronneberger,O.,Fischer,P.,Brox,T.:‘U-net:convolutional networks for biomedical image segmentation’,CoRR,vol.abs/1505.04597,May 2015
[23] Prentasic,P.,Loncaric,S.,Vatavuk,Z.,et al.:‘Diabetic retinopathy image database(DRiDB):a new database for diabetic retinopathy screening programs research’.Int.Symp.on Image and Signal Processing and Analysis(ISPA),Trieste,Italy,2013,pp.704-709
[24] Giancardo,L.,Meriaudeau,F.,Karnowski,T.,et al.:‘Exudate-based diabetic macular edema detection in fundus images using publicly available datasets’,Med.Image Anal.,2012,16,pp.216-226
[25] Maninis,K.-K.,Pont-Tuset,J.,Arbelaez,P.,et al.:‘Deep retinal image understanding’.Medical Image Computing and Computer-Assisted Intervention(MICCAI),Athens,Greece,2016,pp.140-148
[26] Kohler,T.,Budai,A.,Kraus,M.,et al.:‘Automatic no-reference quality assessment for retinal fundus images using vessel segmentation’.Int.Symp.on Computer-Based Medical Systems,CBMS,Porto,Portugal,2013,pp.95-100
[27] Prentasic,P.,Loncaric,S.:‘Detection of exudates in fundus photographs using deep neural networks and anatomical landmark detection fusion’,Comput.Methods Programs Biomed.,2016,137,pp.281-292
 CAAI Transactions on Intelligence Technology2018年3期
- CAAI Transactions on Intelligence Technology的其它文章
- Symmetry features for license plate classification
- CNN-RNN based method for license plate recognition
- Fast genre classification of web images using global and local features
- Influence of image classification accuracy on saliency map estimation
- Robust optimisation algorithm for the measurement matrix in compressed sensing
- Guest Editorial