The spanwise spectra in wall-bounded turbulence
Hong-Ping Wang·Shi-Zhao Wang·Guo-Wei He
1 Introduction
Wall-bounded turbulent flows at high Reynolds number have attracted consider able attention over many years.One important feature of such flows is the grow th in scale separations between the largest scales and the smallest scales with increasing Reynolds numbers.This feature facilitates the study of the interactions between the large-scale motions primarily associated with the outer region and the small-scale motions in the inner near-wall region.In this context,the scale separation and interaction are investigated in the spanwise direction,and our interest lies in finding the differences between the spectra of the streamwise velocity fluctuations in the streamwise and spanwise directions.Herein,the pre-multiplied streamwise energy spectra of the streamwise velocity fluctuations will be referred to as the streamwise spectra,and the spanwise energy spectra of the streamwise velocity fluctuations will be referred to as the spanwise spectra.
According to the paper by Marusic et al.[1],the dominant coherent structures in wall-bounded turbulence can be classified into streaks,large-scale motions(LSMs),and verylarge-scale motions(VLSMs).Low-and high-speed streaks exist in the near-wall region of turbulent flows.Kline et al.[2]used hydrogen bubbles for flow visualization to investigate streak characteristics.The mean spanwise spacing of the streaks,which is scaled to viscous wall units,is approximately 100 in the near-wall region,and the spanwise spacing has a log-normal distribution,therein also increasing with the distance from the wall[3].Marusic et al.[4]presented a series of streamwise spectra obtained using a hot wire across the full height of a turbulent boundary layer for a range of Reynolds numbers.The inner peak caused by the near-wall cycle of the streaks is located aty+=15 and=1000(here,x,y,andzdenote the streamwise,wall-normal,and spanwise directions;λrepresents the wavelength;and the superscript“+”indicates that this value is scaled to the viscous wall units).These values are essentially invariant with increasing Reynolds numbers.The numerical simulations by Jiménez and Pinelli[5]and Schoppa and Hussain[6]indicated the existence of a self-sustaining near-wall cycle thatis local to the near-wall region and that does not depend on the outer flow.The complete process generating a hairpin vortex from near-wall streamwise vortices is studied via the direct numerical simulation(DNS)of the streak transient grow th in a minimal channel atReτ=400[7].
With increasing Reynolds number,one important property of wall-bounded turbulence at high Reynolds number is the separation scales between the inner and outer turbulence[1,8–10].From the pre-multiplied streamwise energy spectra for a range of Reynolds numbers[4],a distinct outer peak associated with large-scale structures appears at the center of the logarithmic region of the spectrogram,approximately locating atis the friction Reynolds number,whereandνdenote the friction velocity,boundary layer thickness,and kinematic viscosity,respectively).The outer peak is most likely the energetic signature of the outer VLSM s[11],and the magnitude of the peak increases with the Reynolds numbers.Balakumar and Adrian[12]investigated the streamwise length scales of LSM s and VLSM s in turbulent channel flows,zero-pressure-gradient(ZPG)boundary layer flows and pipe flows.The streamwise length scales of the LSMs are approximately(2–3)δ,while those of VLSMs are approximately10δand increase with increasing wall-normal locationy+.They also concluded that substantial portions of the kinetic energy(40%–65%)and the Reynolds shear stress(30%–50%)are carried by VLSM sin pipe,channel,and ZPG boundary-layer flows.The origin of VLSM sis not fully understood.Kim and Adrian[13]proposed that the VLSMs are caused by streamwise alignment of the LSM s,whereas del álamo and Jiménez[14]and McKeon and Sharma[15]suggested that they could be formed by linear or nonlinear processes.
According to Townsend’s attached eddy hypothesis[16,17],the outer large-scale structures will impose an influence on the near-wall region[8,18].Hutchins and Marusic[8]observed that the influence of large-scale structures is not only the superposition but also a modulation effect on the near-wall small-scale structures.In their paper,the hot-wire data acquired at a high Reynolds number facility were separated into large scales and small scales;it was found that the small-scale amplitude is amplified by the positive large-scale fluctuations and that the small-scale amplitude is attenuated by the negative large-scale fluctuations.More recently,the extent of the frequency modulation was examined by counting the number of occurrences of local maxim a and minim a in the small-scale signal[19];the results indicated the presence of frequency modulation.
Most previous studies used the pre-multiplied streamwise energy spectra of the streamwise velocity fluctuations to explore the role of the large-scale motions in high-Reynolds number turbulent flows.However,there are relatively few studies on the pre-multiplied spanwise energy spectra.Tomkins and Adrian[20]used Particle Image Velocimetry(PIV)measurements to explore the spanwise length scales in the logarithmic layer of a turbulent boundary layer atReθ=1015 and 7705(the Reynolds number is based on momentum thickness).Abe et al.[21]investigated the verylarge-scale structures and their effects on the wall shear-stress fluctuations based on the DNS of turbulent channel flows atReτ=180,395,640.The results show the existence of verylarge-scale structures with a spanwise spacing of(1.3–1.6)δin the outer layer and that they certainly contribute to the inner layer structures at high Reynolds numbers.From the one-dimensional(1D)spanwise pre-multiplied power spectra ofuatReτ=1160 given by Iwamoto et al.[22],the outer peak can be identified aty+=300 andλz/δ=1.2.Hoyas and Jiménez[18]showed the two-dimensional(2D)pre-multiplied spectral energy over the streamwise-spanwise plane.EI Khoury et al.[23]compared the 1D spanwise premultiplied spectra of fully developed turbulent pipe flow,turbulent channel flow and ZPG boundary layer flow forReτup to 1000.In the near-wall region,a high degree of similarity is observed in three cases,and a pronounced secondary peak,caused by large-scale structures,is observed at an azimuthal/spanwise spacing of approximately one boundarylayer thickness or one pipe radius.In the paper by Lee and Moser[10],two distinct peaks were observed in the streamwise pre-multiplied energy spectra of the DNS turbulent channel flow up toReτ=5200;the spectra also indicated that the more noticeable double peaks are visible in the spanwise spectrum ofu.
We will study the spanwise spectra for differentReτto investigate the differences between streamwise spectra and spanwise spectra in terms of scale separation and interaction.This paper will explore the statistical characteristics of the spanwise spectra for streamwiseufluctuations,especially theRe-dependence of the inner and outer peaks and a comparison with the streamwise spectra.This paper is organized as follows.First,the data used in this paper are described in Sect.2.The results of the pre-mulitiplied spanwise energy spectra of streamwise velocity fluctuations are presented in Sect.3,where the inner and outer spectral peaks are analyzed in detail and compared with those of the streamwise spectra.Finally,conclusions are offered in Sect.4.
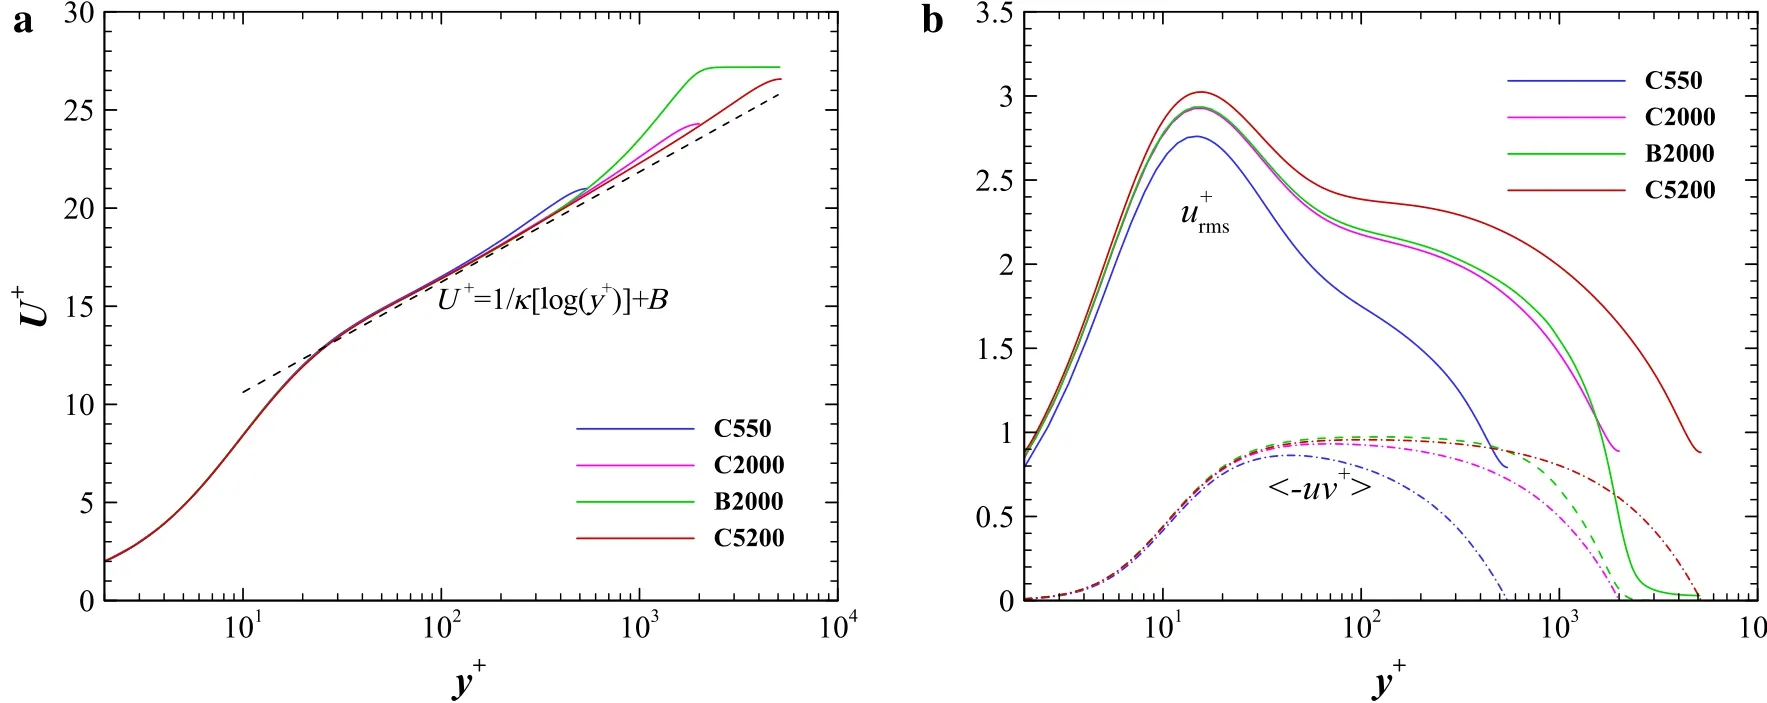
Fig.1 The mean streamwise velocity(a)and the Reynolds stress(b)profiles in viscous wall units.The parameters κ and B in the logarithmic law are 0.41 and 5.0,respectively
2 The data sets of wall-bounded turbulence
A ll the data sets used in this paper are from the DNS of fully developed wall-bounded turbulence.The data sets for turbulent channel flows have friction Reynolds numbers of 180,550,1000,2000,5200,and the simulation details can be found in Ref.[10].The datasets for the ZPG turbulent boundary layer have a range ofReτ≈ 1300–2000,and the details of the numerical simulations are described in Ref.[24].The spanwise energy spectra and other statistical properties utilized in this work were downloaded from the websites(http://turbulence.ices.utexas.edu/)and(http://torroja.dm t.upm.es/turbdata/blayers/high_re/).For the sake of simplicity,the channel flow is denoted by the letter “C”,and the turbulent boundary layer flow is denoted by “B”.“C2000”and“B2000”represent the turbulent channel flow and ZPG turbulent boundary layer forReτ=2000,respectively.In the following discussion,the streamwise(x),wall-normal(y),and spanwise(z)velocity fluctuations will be denoted asu+,v+,andw+,respectively.The superscript“+”denotes normalization with the friction velocityuτand kinematic viscosityν.The streamwise mean velocity is indicated by a capital letterU+.
The mean streamwise velocity and the Reynolds shear stress profiles for the inner scale are presented in Fig.1a,b,respectively.The profiles of the turbulent channel flows atReτ=550(C550),Reτ=2000(C2000),andReτ=5200(C5200)and the boundary layer flows atReτ=2000(B2000)are plotted with different colors in this figure.In Fig.1a,all the mean curves are in agreement with each other in the near wall region and present a log layer(30<y+<0.15δ+).The upper bound of the log-law region seems to increase withReτ.The classicallog-law withκ=0.41andB=5.0(black dashed line)shows as light discrepancy with those mean profiles.Lee and Moser[10]reported that the parametersκandBare found to be0.384and 4.27 from fitting the mean velocity data from C5200.The essential difference observed from the mean profiles is that the wake intensity of the boundary layer(green curve)is much stronger than that of the channel flows(purple curve).More details about the properties of the mean streamwise velocity profiles were discussed in Refs.[10]and[24].The root mean square ofu+(solid curves)and the Reynolds shear stress?〈uv+〉(dash-dotted curves)are displayed in Fig.1b.The peak ofis located aty+=15,and the peak intensity increases with increasingReτ.Theof the boundary layer flow is slightly higher than that of the turbulent channel flow at the same Reynolds number.In addition,bothand ?〈uv+〉exhibit visibleRe-dependence effects at the outer region,which will be analyzed using the spanwise pre-multiplied energy spectra in the next section.
3 Spanwise pre-multiplied energy spectra of the streamwise velocity fluctuations
As discussed in the introduction section,the pre-multiplied streamwise energy spectra of the streamwise velocityu+are widely utilized to explore the interaction of the outer largescale structures with the near-wall turbulence.In this paper,we will focus on the pre-multiplied spanwise energy spectra of the streamwise velocity fluctuations.Figure 2 shows the spanwise spectra ofu+as a function ofy+at different Reynolds numbersReτin fully developed turbulent channel flows.From the plot of a to the plot of d,the Reynolds numberReτincreases from 550 to 5200.It can be observed that two energy peaks,indicated by the white crosses,exist in the contour maps.According to the definitions proposed by Marusic et al.[4],the first peak resides in the near-wall region(y+<30),is associated with the near-wall cycle of elongated high-and low-speed streaks,and is referred to as the inner peak.The second peak is located in the outer region(30<y+< δ+),is associated with the outer large scales,and is referred to as the outer peak.With increasingReτ,the positions of the inner energy peaks are almost invariant,and a second energy peak clearly appears in the outer region.The intensity of the latter also increases withReτ.As shown in the paper by Lee and Moser[10],the double peaks of the spanwise spectra are substantially more visible than those of the streamwise spectra.All the inner peaks emerge at approximatelyλ+z=125 andy+=15,and the contours of the inner spanwise spectra share highly similar shapes across different Reynolds numbers.The position of the outer peak is associated with the Reynolds numbers.The dominant spanwise wavelength of the outer large scales is approximately equal to the thickness of the boundary layer.

Fig.2 The pre-multiplied spanwise spectra of u+as a function of y+at different Reynolds numbers Reτin fully developed turbulent channel flows.Plots a–d are the colored contours of the spanwise spectra at Reτ=550,1000,2000,5200,and the white crosses indicate the positions of the inner and outer peaks.The expressions of the dashed white lines connecting these two peaks are also presented in these plots.Plots e,f show the contour lines,with low levels of 0.3 and 0.7 and high levels of 1.5 and 2.5,respectively
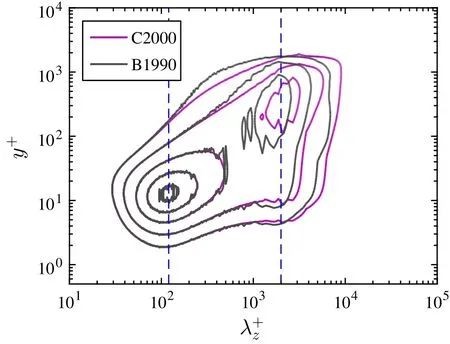
Fig.3 The pre-multiplied spanwise spectra of channel and boundary layer flows at the Reynolds number Reτ=2000.The two dashed blue lines indicate the spanwise wavelength of=125 and 2000
In Fig.2,the dominant spanwise length scale increases with increasing wall-normal locations.If we draw a line joining the inner and outer peaks using dashed white lines,the spanwise spectra are aligned along the white line throughout the region.This implies that the spanwise length scale presents a linear grow th with the distance from the wall in log-log coordinates.The slopes of the white lines decrease from 1.32 to 1.06 with increasingReτfrom 550 to 5200.In the paper by Hwang[25],the linear ridgey+=0.1λ+zis used to connect the two local spectral peaks atReτ=2003.
We also plot the contour lines of different Reynolds numbers in Fig.2.The left panel,e,represents the low levels of 0.3 and 0.7,and the right panel,f,shows the high levels of 1.5 and 2.5.The lowestReτ=180 is not given in this figure because there is no vivid second peak in the outer region.It is apparent from the figures that the short wavelength in the near-wall region is invariant with respect toReτ,and the magnitude of the long wavelength in the whole wall-normal region is associated withReτ.In Fig.2e,the contour line of the higherReτis the asymptotic line for that of the lowerReτ,which means that the low-level contour lines of different Reynolds numbers are highly similar to each other and that an increase in the Reynolds numbers only leads to an increased spanwise length range in viscous units.In Fig.2f,the intensity of the second peak in the outer region increases with increasingReτ,and the distance between the inner peak and the outer peak is also enlarged with increasing Reynolds numbers.
A comparison of the spanwise spectra for channel and boundary layer flows is also shown in Fig.3,where the Reynolds numberReτis 2000.The spanwise spectra of the boundary layer are not especially smooth be cause those spectra were post-processed from approximately 200 snapshots.This figure indicates that the spectra show a good agreement fory+less than 100 and for a spanwise wavelength less than 300 in viscous units.This result is the same as that of EI Khoury et al.[23],where the spanwise spectra for the pipe,channel and boundary layer were compared atReτ=1000.The position of the first peak in the near-wall region is identical for different wall-bounded turbulent flows.The second peak caused by large scales in the outer region is observed in both channel and boundary layer flows,and the spanwise wavelength of the peak in the boundary layer seems to be less than that in turbulent channel flows.It is also indicated that the intensity of the second peak for the boundary layer is seemingly stronger than that of channel flows.According to this figure and the results in Ref.[23],the wall-bounded turbulent flow seems to share certain common features:(1)the small scales in the near-wall region have the same statistical characteristics,and(2)the spanwise wavelength of the outer large scales is approximately equal to the boundary layer thicknessδ+.
3.1 The inner peak of spanwise spectra
As shown in Fig.1b,the peak in 〈u2〉is fixed at the locationy+=15,and the 〈·〉represents the averaging operation.The peak value increases with the Reynolds numbers following the relationship 〈u2〉max=3.63+0.65 log(Reτ)suggested by Lozano-Duran and Jiménez[26].In the paper by Lee and Moser[10],this relationship is fitted to obtain〈u2〉max=3.66+0.642 log(Reτ).Marusic et al.[4]used the corresponding streamwise spectra aty+=15 to study why the peak in 〈u2〉varies with the Reynolds numbers.In this work,we give the pre-multiplied spanwise spectra aty+=15 of the channel and boundary layer flows.The results are shown in Fig.4,where the different colors represent different Reynolds numbers.According to the definition of pre-multiplied spectra,the integration ofover the logarithmic wavenumber scalekzcorresponds to the kinetic energy 〈u2〉.The maxim a are located at=125 for both turbulent channel flows and ZPG boundary layer flows,which is very close to the measured streak spacing and invariant in the investigated Reynolds number range.It is very interesting that the spectral peak value of the turbulent channel flows shows a decreasing trend with increasingReτ.This trend is ambiguous in Fig.4c due to the limited Reynolds numbers and non-convergent spectral data.The pre-multiplied spanwise energy spectrum atReτ=180(black curve in Fig.4a)presents a Gaussian-like distribution.With increasing Reynolds numbers,there is an obvious increase in the energy ofkzEuu/u2τin the large spanwise wavelength.Moreover,there seems to be a plateau in the high wavelength region,where the value is 0.85 and 1.1 for the turbulent channel flows and boundary layer flows,respectively.The spanwise range of the plateau seems to be proportional to the Reynolds numbers.The results in Fig.4 indicate that the increase incan be ascribed to the energy increase in the large scales.

Fig.4 The spanwise spectra of channel(a,b)and boundary layer(c,d) flows at y+=15(a,c)and y+=100(b,d),where the different colors represent different Reynolds numbers
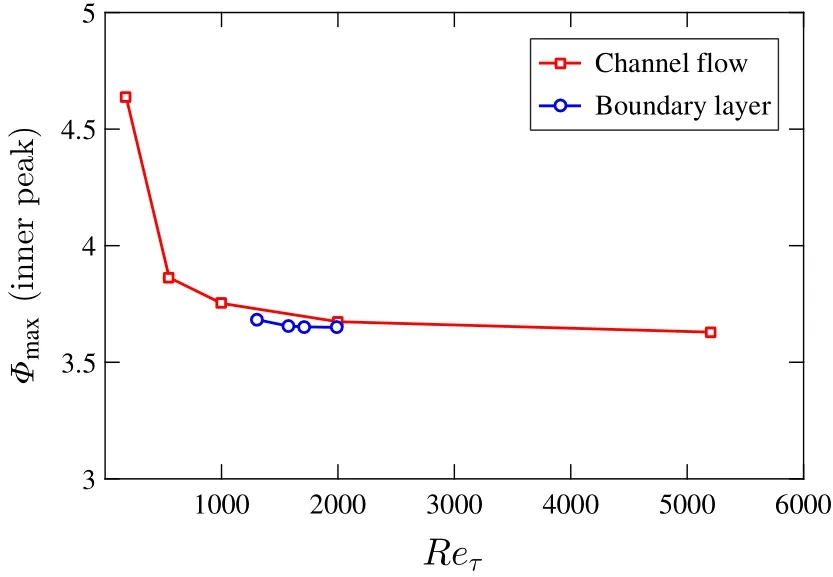
Fig.5 The spectral value of the inner peak as a function of Reynolds numbers Reτ.The parameterΦ is equivalent tofor simplicity.The red and blue curves are the results for the channel and boundary layer flows,respectively
The plateau as shown in Fig.4 was also mentioned in the paper by Lee and Moser[10].According to the scaling analysis proposed by Perry et al.[27],the power spectral density of the streamwise fluctuating velocity displays abehavior in the overlap region where both inner scaling and outer scaling are simultaneously valid(kxpresents the streamwise wave number).For the pre-multiplied energy spectra,there should be a plateau in this region.This conclusion can also be applied to the spanwise spectra[10].Note that in Fig.4a,c,the plateau exists aty+=15 in the region of the viscous sublayer.We also plot the spanwise spectrum aty+=100 in Fig.4b,d for turbulent channel flows and boundary layers,which is much higher thany+=15.A broader plateau indeed appears in the region of large spanwise scales,and the spanwise range is found to increase with increasingReτ.Therefore,the energy plateau aty+=15 may be caused by the large scales from the outer region.The characteristics of the energy plateau must be checked in the case of higher Reynolds numbers.
The peak values in Fig.4 were determined by fitting the spanwise spectra in the region betweenwith a log-Gaussian function.Figure 5 plots the peak value as a function ofReτ;the red points are the results for the turbulent channel flows,and the blue points are the results for the boundary layers.The figure clearly indicates that the values of the spanwise spectral peaks aty+=15 decrease withReτand converge to a constant of approximately 3.6.The result for the boundary layer is very close to that for the turbulent channel flow in the narrow region ofReτ=1300–2000.
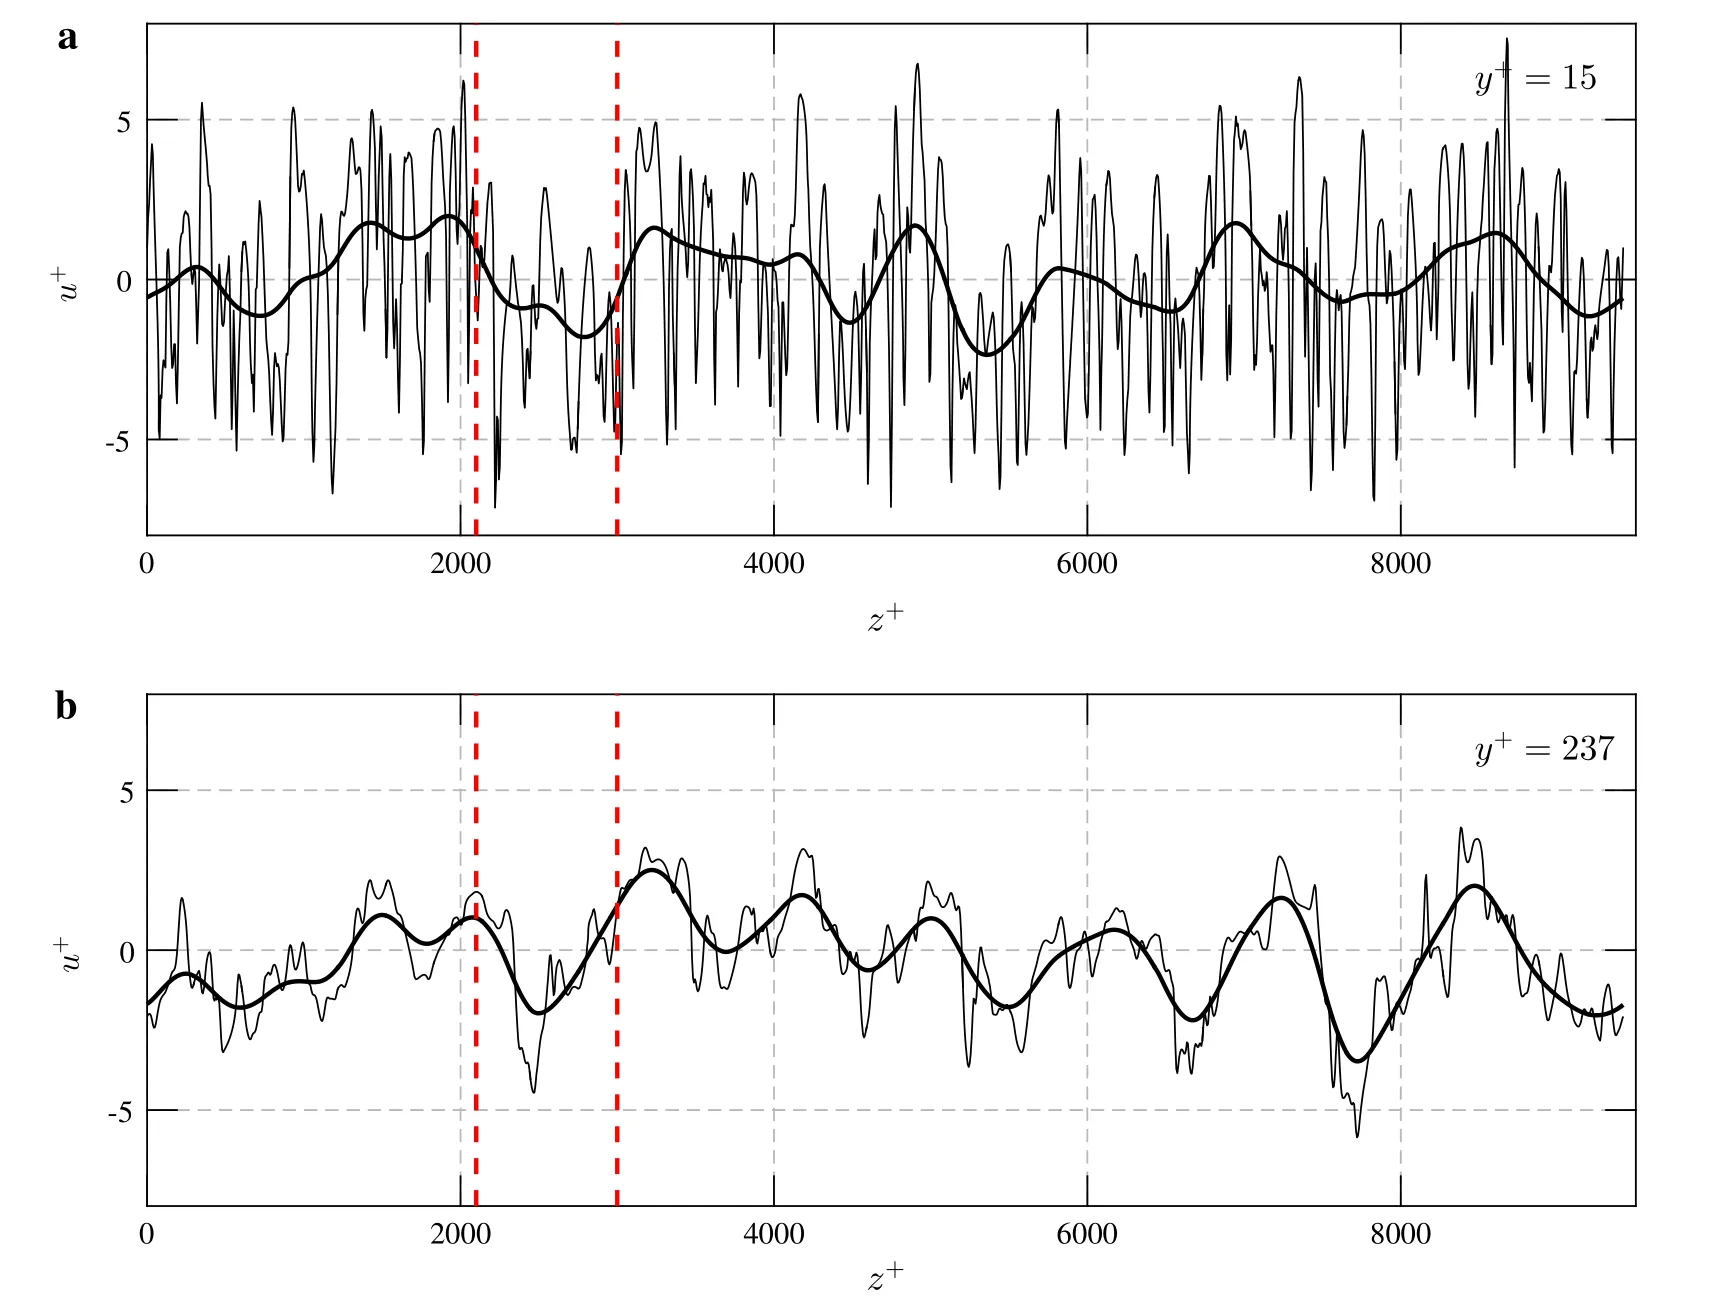
Fig.6 Example streamwise u+ fluctuations as a function of spanwise z+from the DNS of the Reτ=1000 channel flow at y+=15(a)and y+=237(b).The data were downloaded from the Johns Hopkins Turbulence Databases(JHTDB)[28–30].The thicker lines represent the largescale signals obtained using≥ 700.The red dashed lines indicate the modulation effects.Note that the signals in a,b were sampled at different streamwise locations.The streamwise position of the u+signal at y+=237 is shifted according to the mean inclination angle(12o)[31,32]
Both the streamwise and spanwise pre-multiplied energy spectra can be used to separate the small-and large-scale motions in wall-bounded turbulence.A successful separation is achieved using the streamwise spectrum only for turbulence at sufficiently high Reynolds numbers[4,8].From Fig.2,two visible energy peaks can be found in the spanwise spectrum of the turbulent channel flow atReτ=1000.This means that the streamwise velocity fluctuations in the spanwise direction can also be decomposed into small scalesand large scalesusing a spectral filter.An example of a streamwiseusignal as a function of the spanwisez+from the DNS channel flow atReτ=1000 is shown in Fig.6;a is aty+=237,and b is aty+=15.In this figure,the horizontal axis is the spanwisez+,not the streamwisex+,and the thresholdis set to 700 based on the spanwise spectral map given in Fig.2b.The thicker lines represent the large-scale signals.The wall-normal locationy+=237 in a is determined according to the outer peak,which will be introduced in the next section.The spanwise large-scaleu+aty+=15 is highly correlated with that aty+=237;the correlation coefficient is up to 0.61.Aty+=15,the amplitude and frequency of theu+signal between the two red dashed lines are significantly reduced because of the negative large-scaleu+fluctuations.The superposition and modulation effects of the outer large-scale motions on the near-wall small-scale motions can also be explored using the spanwise signals,although the Reynold numberReτis only approximately 1000.
3.2 The outer peak of spanwise spectra
The outer energy peak in the spanwise spectra is artificially distorted by the limited computational domain and grid numbers.The shape of the outer peak is not as perfect as that of the inner peak.In this paper,two steps are adopted to identify the position of the outer peak.First,the position of the outer peak is approximated by finding the maximum energy valueΦO,maxin the outer region(the parameterΦdenotes the energyand the subscriptOrepresents the“outer”).Second,the position of the outer peak is refined by weighting the energy in the outer region ofΦ>0.8ΦO,max.The variation in the threshold(0.8)may slightly change the value of the results,and the trend of the results is almost the same.The identified outer peaks are also shown in Fig.2 as a white cross in the outer region;only the case ofReτ=180 has no outer peak due to the low Reynolds number.
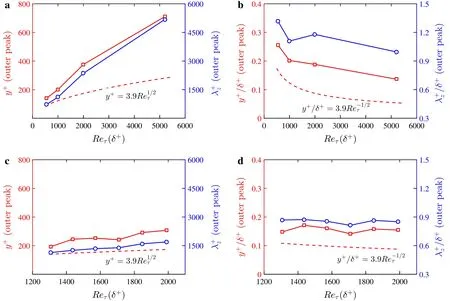
Fig.7 The positions of the outer peaks as a function of Reτ.The red and blue lines show the wall-normal locations and the spanwise wavelengths of the outer peak,respectively.The plots in the left column are scaled with inner-scale variables,and the plots in the right column are scaled with outer-scale variables.The plots of a,b are the results for the channel flows,and the plots of c,d are the results for the turbulent boundary layer flows.The red dashed lines indicate the outer spectral peak of the streamwise pre-multiplied energy spectra,i.e.,the middle of the log layer[4,31]

Fig.8 The wall-normal location y+of outer spectral peaks as a function of the spanwise wavelength.The size of the points indicates the Reynolds number
Figure 7 gives the peak position as a function of the Reynolds numbersReτ;the left panel is for inner viscous units,and the right panel is normalized by outer units.The results for the channel and boundary layer are illustrated in a,b and c,d,respectively.The red lines represent the wall normal locations,and the blue lines represent the spanwise wavelength.In turbulent channel flows,bothy+andshow a linear-like grow th trend with increasingReτ.If we use the outer length scaleδ+to normalize the parametersy+and,the results in Fig.7b indicate that the wall-normal locations and spanwise wavelengths of the second peak decrease with increasing Reynolds numbers.The outer peak typically resides in the regiony+/δ+=0.1–0.3,and the spanwise wavelength distributes in the regionλfor turbulent channel flows at the Reynolds numbers shown in this figure.These results are also confirmed by the boundary layer in Fig.7c,d,where the outer peaks typically reside iny+/δ+=0.15 and,although the range of the Reynolds numbers is only from 1300 to 2000.For the current turbulent channel flow study,we also plot the locations of the outer spectral peaks inlog-log coordinates,as shown in Fig.8.The size of the points represents the Reynolds number,and only four Reynolds numbers are available in this study.It was found that these locations can be fitted by a linear function,as the dashed line shows in Fig.8.This equation can be used to predict the location of the outer spectral peak for spanwise spectra at different Reynolds numbers.Limited by the coarse resolution of the long-wavelength spectra,the accurate outer peak position must be more carefully examined through experiments and DNS under higher Reynolds numbers.
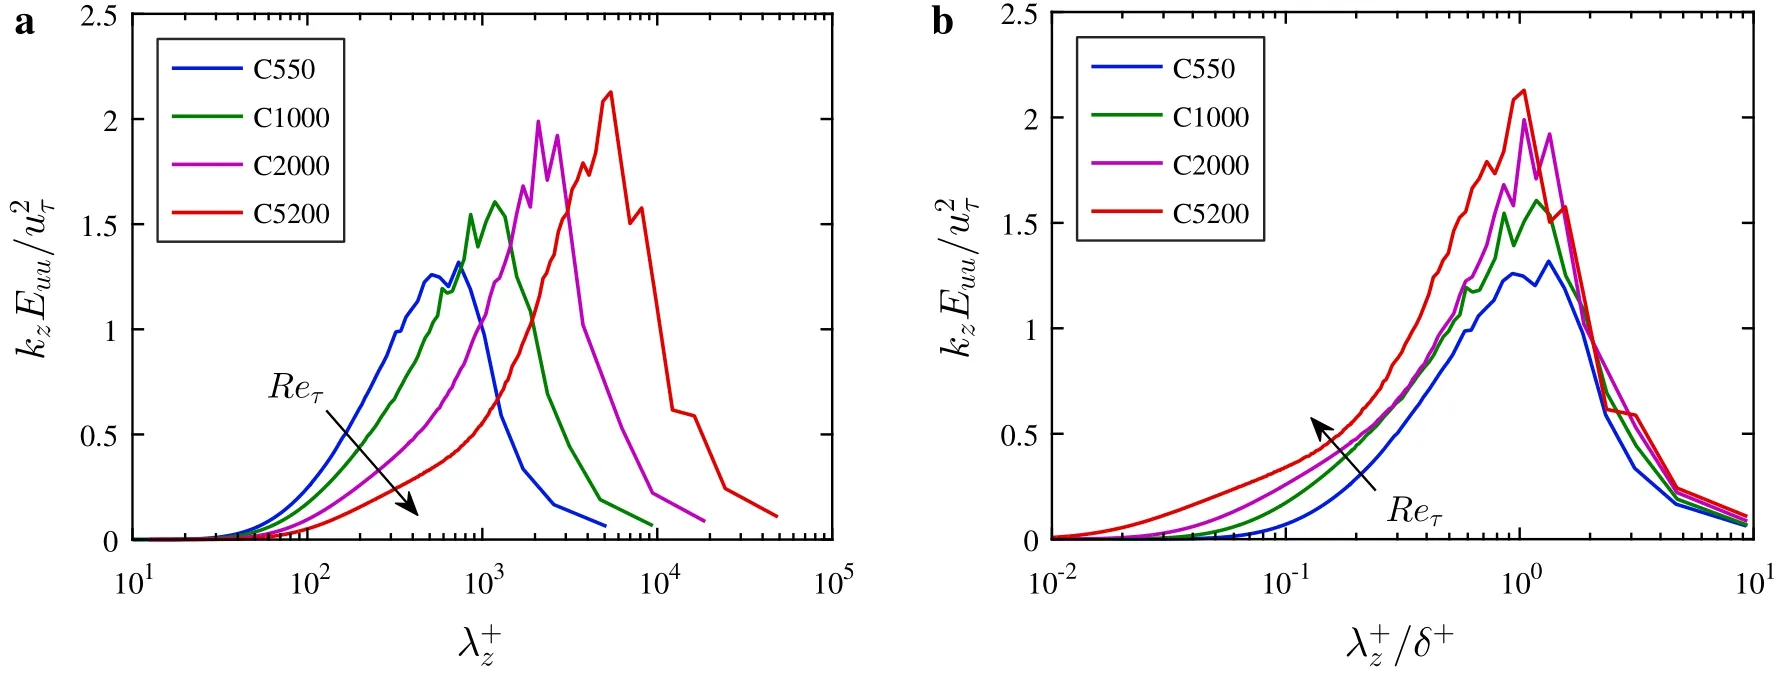
Fig.9 The spanwise spectra of the channel flows at the outer peak,where the different colors represent different Reynolds numbers.In the plot of a,the spanwise wavelength is scaled to the viscous wall units,whereas the spanwise wavelength is normalized using the outer length scale δ+in the plot of b
In the paper by Mathiset al.[31],the wall-normal location of the outer peak of the pre-multiplied streamwise spectra is in good agreement with the nominal mid-point of the log region.The location is given by the formulay+=3.9Re1/2τ,which is shown as the dashed red line in Fig.7.Clearly,the location of the outer peak of the spanwise spectra is much higher than that of the streamwise spectra.It seems that the outer peak of the spanwise spectra is located at the upper boundary,not at the middle of the log layer.The spanwise wavelength of the outer peak represents the mixing length scale of both LSMs and VLSMs[25],while the streamwise wavelength of the outer spectral maximum mainly reflects the length scale of VLSMs in the streamwise direction.According to the paper by Vallikivi et al.[33],for streamwise spectra,the VLSM peak gradually disappears,and the LSM peak remains in the region ofy+/δ+>0.15 for boundary layers.If this result is also suitable for turbulent channel flows,one possible reason for the wall-normal location difference between streamwise and spanwise spectra is the hierarchical distribution of coherent structures.
From Fig.2,another obvious phenomenon is that the intensity of the outer peak seems to increase with increasingReτ.The energy distributions as a function of the spanwise wavelength at the wall-normal locations of the outer peaks are plotted in Fig.9.In the plot of a,the spanwise wavelength is scaled to viscous wall units,whereas the spanwise wavelength is normalized using the outer length scaleδ+in the plot of b.The figure shows that the values of the outer peaks(the maximum of the curves)are indeed dependent on the Reynolds numbers.The outer-normalized spanwise spectra display a good consistency for the large scales.In contrast,the near-wall spanwise spectra normalized by the wall units show a good agreement for the small scales(Fig.4).
4 Conclusions
The pre-multiplied spanwise energy spectra of the streamwise velocity from turbulent channel flows atReτ=180,550,1000,2000,5200 and ZPG boundary layer flows atReτ=1300–2000 are studied in this paper.At low Reynolds numbers,both for turbulent channel flows and boundary layer flows,the spanwise spectra clearly display two distinct energy peaks:one locates at the outer region,and the other is found in the inner region.The comparison between turbulent channel flow and boundary layer flow atReτ=2000 indicates that the location of the outer peak may be slightly different between these two cases of wall-bounded turbulence.These two spectral peaks indicate that the coherent structures have differents calesin the outer and inner regions.From the streamwise velocity fluctuations along the spanwise direction atReτ=1000,it is observed that the outer large scales maintain a “footprint”in the near-wall region.This implies that scale separation can be applied to the velocity signals in the spanwise direction to explore the super position and modulation effect even at low Reynolds numbers.
The properties of the inner and outer peaks in the spanwise spectra are analyzed.For the spanwise spectra aty+=15,the values of the peaks decrease with increasingReτfor turbulent channel flows,and an energetic plateau appears in the region of larger scales.The plateau in boundary layer flows is not as clear as in channel flows due to the limitation of the Reynolds numbers.The energy magnitudes of the plateau in turbulent channel flows and boundary flows are 0.85 and 1.1,respectively.The outer peak typically resides iny+=0.1δ+~ 0.3δ+andfor both channel flows and boundary layer flows,and a strongRe-dependence effect is observed for the intensity of the outer peaks.
There are differences between the pre-multiplied streamwise velocity spectra in the spanwise direction and those in streamwise direction.The review article by Smits et al.[9]states that the spectral peak separation of the streamwise spectra starts to appear forReτapproximately greater than 1700,but Hutchins and Marusic[8]proposed thatReτ>4000 is required to ensure a sufficient scale separation for high-Reynolds-number turbulence.However,there is an obvious scale separation in the spanwise direction at lower Reynolds numbers due to the appearance of two spectral peaks in the spanwise spectra.The influence of the outer large-scale motions on the near-wall structures may exist at low Reynolds numbers and may gradually increase with increasingReτ.The wall-normal locations of the outer peaks in the spanwise spectra are substantially larger than those in the streamwise spectra.The outer peaks of the streamwise spectra appear in the middle of the log layer,and the outer peaks of the spanwise spectra seem to appear in the upper boundary of the log layer.The causes of these differences are not yet understood and will be an interesting topic in the future.
AcknowledgementsThis work was supported by the National Natural Science Foundation of China(Grants 11302238,11232011,11572331,and 11490551).The authors would like to acknowledge the support from the Strategic Priority Research Program(Grant XDB22040104),the Key Research Program of Frontier Sciences of the Chinese Academy of Sciences(Grant QYZDJ-SSW-SYS002),and the National Basic Research Program of China(973 Program 2013CB834100:Nonlinear Science).
1.Marusic,I.,McKeon,B.J.,Monkewitz,P.A.,et al.:Wall-bounded turbulent flows at high reynolds numbers:recent advances and key issues.Phys.Fluids 22,065103(2010)
2.Kline,S.J.,Reynolds,W.C.,Schraub,F.A.,et al.:The structure of turbulent boundary layers.J.Fluid Mech.30,741–773(1967)
3.Smith,C.R.,Metzler,S.P.:The characteristics of low-speed streaks in the near-wall region of a turbulent boundary-layer.J.Fluid Mech.129,27–54(1983)
4.Marusic,I.,Mathis,R.,Hutchins,N.:High reynolds number effects in wall turbulence.Int.J.Heat Fluid Flow 31,418–428(2010)
5.Jiménez,J.,Pinelli,A.:The autonomous cycle of near-wall turbulence.J.Fluid Mech.389,335–359(1999)
6.Schoppa,W.,Hussain,F.:Coherent structure generation in nearwall turbulence.J.Fluid Mech.453,57–108(2002)
7.Wang,Y.S.,Huang,W.X.,Xu,C.X.:On hairpin vortex generation from near-wall streamwise vortices.Acta Mech.Sin.31,139–152(2015)
8.Hutchins,N.,Marusic,I.:Large-scale influences in near-wall turbulence.Philos.Trans.A Math.Phys.Eng.Sci.365,647–664(2007)
9.Smits,A.J.,McKeon,B.J.,Marusic,I.:High-Reynolds number wall turbulence.Ann.Rev.Fluid Mech.43,353–375(2011)
10.Lee,M.,Moser,R.D.:Direct numerical simulation of turbulent channel flow up toReτ≈ 5200.J.Fluid Mech.774,395–415(2015)
11.Hutchins,N.,Marusic,I.:Evidence of very long meandering features in the logarithmic region of turbulent boundary layers.J.Fluid Mech.579,1–28(2007)
12.Balakumar,B.J.,Adrian,R.J.:Large-and very-large-scale motions in channel and boundary-layer flows.Philos.Trans.R.Soc.Math.Phys.Eng.Sci.365,665–681(2007)
13.Kim,K.C.,Adrian,R.J.:Very large-scalemotion in the outer layer.Phys.Fluids 11,417(1999)
14.del álamo,J.C.,Jiménez,J.:Linear energy amplification in turbulent channels.J.Fluid Mech.559,205–213(2006)
15.M cKeon,B.J.,Sharma,A.S.:A critical-layer framework for turbulent pipe flow.J.Fluid Mech.658,336–382(2010)
16.Townsend,A.A.:Equilibrium layers and wall turbulence.J.Fluid Mech.11,97–120(1961)
17.Townsend,A.A.:The Structure of Turbulent Shear Flow.Cambridge University Press,Cambridge(1980)
18.Hoyas,S.,Jiménez,J.:Scaling of the velocity fluctuations in turbulent channels up toReτ=2003.Phys.Fluids 18,011702(2006)
19.Ganapathisubramani,B.,Hutchins,N.,Monty,J.P.,et al.:Amplitude and frequency modulation in wall turbulence.J.Fluid Mech.712,61–91(2012)
20.Tomkins,C.D.,Adrian,R.J.:Spanwise structure and scale grow th in turbulent boundary layers.J.Fluid Mech.490,37–74(2003)
21.Abe,H.,Kawamura,H.,Choi,H.:Very large-scale structures and their effects on the wall shear-stress fluctuations in a turbulent channel flow up to Re=640.J.Fluids Eng.126,835–843(2004)
22.Iwamoto,K.,Kasagi,N.,Suzuki,Y.:Dynamical roles of large-scale structures in turbulent channel flow.Comput.Mech.WCCM VI in Conjunction with APCOM 4,5–10(2004)
23.EI Khoury,G.K.,Schlatter,P.,Brethouwer,G.,et al.:Turbulent pipe flow:statistics,Re-dependence,structures and similarities with channel and boundary layer flows.J.Phys.Conf.Ser.506,012010(2014)
24.Sillero,J.A.,Jiménez,J.,Moser,R.D.:One-point statistics for turbulent wall-bounded flows at reynolds numbers up toδ+=2000.Phys.Fluids 25,105102(2013)
25.Hwang,Y.:Statistical structure of self-sustaining attached eddies in turbulent channel flow.J.Fluid Mech.767,254–289(2015)
26.Lozano-Duran,A.,Jiménez,J.:Effect of the computational domain on direct simulations of turbulent channels up toReτ=4200.Phys.Fluids 26,011702(2014)
27.Perry,A.E.,Henbest,S.,Chong,M.S.:A theoretical and experimental study of wall turbulence.J.Fluid Mech.165,163–199(1986)
28.Perlman,E.,Burns,R.,Li,Y.,et al.:Data exploration of turbulence simulations using a database cluster.In:ACM/IEEE Conference on High Performance Networking and Computing,SC 2007,November 10-16,Reno,Nevada,USA,1–11(2007)
29.Li,Y.,Perlman,E.,Wan,M.P.,et al.:A public turbulence database cluster and applications to study lagrangian evolution of velocity increments in turbulence.J.Turbulence 9,1–29(2008)
30.Graham,J.,Kanov,K.,Yang,X.I.A.,et al.:A web services accessible database of turbulent channel flow and its use for testing a new integral wall model for les.J.Turbulence 17,181–215(2016)
31.Mathis,R.,Hutchins,N.,Marusic,I.:Large-scale amplitude modulation of the small-scale structures in turbulent boundary layers.J.Fluid Mech.628,311–337(2009)
32.Mathis,R.,Hutchins,N.,Marusic,I.:A predictive inner-outer model for streamwise turbulence statistics in wall-bounded flows.J.Fluid Mech.681,537–566(2011)
33.Vallikivi,M.,Ganapathisubramani,B.,Smits,A.J.:Spectral scaling in boundary layers and pipes at very high Reynolds numbers.J.Fluid Mech.771,303–326(2015)
- Acta Mechanica Sinica的其它文章
- Instability waves and low-frequency noise radiation in the subsonic chevron jet
- Density enhancement mechanism of upwind schemes for low Mach number flows
- Hydrodynamic studies on two wiggling hydrofoils in an oblique arrangement
- The dimension split element-free Galerkin method for three-dimensional potential problems
- Zero group velocity longitudinal modes in an isotropic cylinder
- Partition method and experimental validation for impact dynamics of flexible multibody system

