
Patterns of reptile and amphibian species richness along elevational gradients in Mt. Kenya
2015-04-10 00:58:35PatrickKinyattaMALONZA
Zoological Research 2015年6期
Patrick Kinyatta MALONZA
National Museums of Kenya, Herpetology Section, 40658-00100, Nairobi, Kenya
INTRODUCTION
Species of plants and animals do not have random distributions and a central aim of community ecology seeks to understand what drives the patterns (Rahbek, 1997; Sanders et al, 2003).Identifying and understanding the causes of species richness patterns in the tropics is critical as human activities and threats to biodiversity increases (Sanders et al, 2003; Smith et al,2007). Modern interest has focused on distributions along latitudinal and elevational gradients and the processes that control these patterns (Colwell et al, 2004; Watkins et al, 2006;Sanders et al, 2012). In both patterns, an inverse relationship occurs between species richness, elevation and latitude (Rahbek, 1997; Willig et al, 2003; Carpenter, 2005; Watkin et al,2006). Studies on elevation gradients have observed several patterns and two main patterns of species richness are common:first a monotonical decrease in richness with increasing elevation and second, a “humped” distribution, with species richness highest near the middle of the gradient (Watkins et al, 2006). Understanding species richness patterns in montane regions is important as most of them are centers of species diversity and endemism in the tropical regions (Smith et al, 2007).
Little is known about the underlying factors that govern the distributional patterns of species although much research has suggested that contemporary climate constrains terrestrial taxonomic richness over broad geographic extents due to its controlling energy dynamics (Hawkins et al, 2003a). Climatic, biological,and historical factors have been suggested to drive variation in species richness along elevational gradients (Rahbek, 1997; Sanders et al, 2003). Climate via the water–energy dynamics hypothesis has influenced primary productivity (Hawkins et al, 2003b), which in turn positively correlates with species richness (Hawkins et al,2003a; Rahbek, 2005; Malonza & Veith, 2012).1
Herein, this study examines the herpetofaunal diversity along elevation gradient in Mt. Kenya and explores the probable causal factors. Mt. Kenya is one of five Kenyan water towers and a United Nations Educational, Scientific and Cultural Or-ganization (UNESCO) world heritage site. It is as well a key biodiversity area harbouring endemic and near endemic species. However, it hosts some of the key Kenya endemic herpetofauna namely Mt. Kenya striped Chameleon Trioceros schubotzi, Mt. Kenya puddle frog Phrynobatrachus irangi, Mt.Kenya Hornless ChameleonKinyongia excubitor, Alpine Meadow Lizard Adolfus alleni Mt. Kenya Bush Viper Atherisdesaixiand Kenya Montane ViperMontatheris hindii. Despite its relevance and importance, no comprehensive survey of reptiles and amphibians exists. Most studies involve species descriptions,a few notes on species and general anecdotes. Andrén (1976)provided a list of reptiles with brief comments from the lower alpine zone (Ontulili, northwestern Mt. Kenya) and Reilly (1982)noted the ecological characteristics of Trioceros schubotzi, an alpine zone species. No detailed analysis considers elevation,ecology, natural history or distribution of the herpetofauna of Mt.Kenya. To rectify this dearth of analyses, this manuscript reports on a short survey done in Chogoria (windward side) and Sirimon(leeward side) blocks of forest that start at approximately 1 700 m and 2 600 m a.s.l., respectively.
This study evaluates the influence of elevation on the distribution of herpetofaunal assemblages. The hypotheses that amphibian and reptilian composition does not change with elevation and that patterns of species richness relate to climatic factors as a function of changes in elevation were tested.
MATERIALS AND METHODS
Study area
Located in central Kenya, the administration of Mt. Kenya is shared by greater Meru (Meru and Tharaka-Nithi), Embu, Kirinyaga and Nyeri counties. The lower slopes are covered by mixed indigenous forest that depending on the windward or leeward side gives way to bamboo then montane grasslands and heather (alpine) zones. On the windward side, forest starts at elevations of about 1 700 m a.s.l.,while on the extreme leeward side at about 2 600 m a.s.l.. Herpetofaunal sampling was carried out between March 4th and March 24th 2009 at elevations for about 1 700 m to 3 200 m in Chogoria and from 2 600 m to 3 800 m in Sirimon.
Sampling sites
On each transect, four sampling points were selected for both Chogoria and Sirimon based on the length of each transect from the forest edge to the alpine zone. Chogoria was longer than Sirimon. The former was sampled every 6 km and the latter every 4 km. For Chogoria, sampling started at the Chogoria Forest Station and for Sirimon around Sirimon Gate.These sites fell within different vegetation/habitat zones that associated with elevation (Table 1). Vegetation zonation occurred clearly with increasing elevation along Chogoria but Sirimon had a mixture ofEricaand bamboo occurring almost from the base of the forest zone.
Patterns of species richness
Reptiles and amphibians were sampled using three methods.First, time-limited searches (TLS) were conducted as described by Karns (1986), Heyer et al (1994) and Sutherland(1996). All possible amphibian and reptilian microhabitats,such as wetlands, under leaves debris, on trees, decomposing tree stumps and logs, including digging, were searched intensively for one person/hour. Second, visual (VES) and acoustic encounter surveys (AES) were used only for gathering qualitative and semi-qualitative data mainly for presence or absence of species (R?del & Ernst, 2004; Veith et al,2004). Finally, drift fences and pitfall traps were set up in X-shaped arrays a modification of Corn (1994) with segments of 5 m in length. The pitfall traps consisted of 10 L plastic buckets located flush with the ground and every trap had five buckets. Traps were set for three days (trap nights) and checked once every morning before 0730h. Equal sampling effort was applied within mixed indigenous forests, bamboo and montane grassland zones. Amphibian specimens were humanely euthanized with MS222 and reptiles with pentobarbital solution and then preserved in 10% formalin and in the lab stored in 70% ethanol solution. Selected tissue samples for later molecular analysis were taken and stored in absolute ethanol. Voucher and DNA materials collected are deposited in the Herpetology Section reference collection at the National Museums of Kenya (NMK), Nairobi.
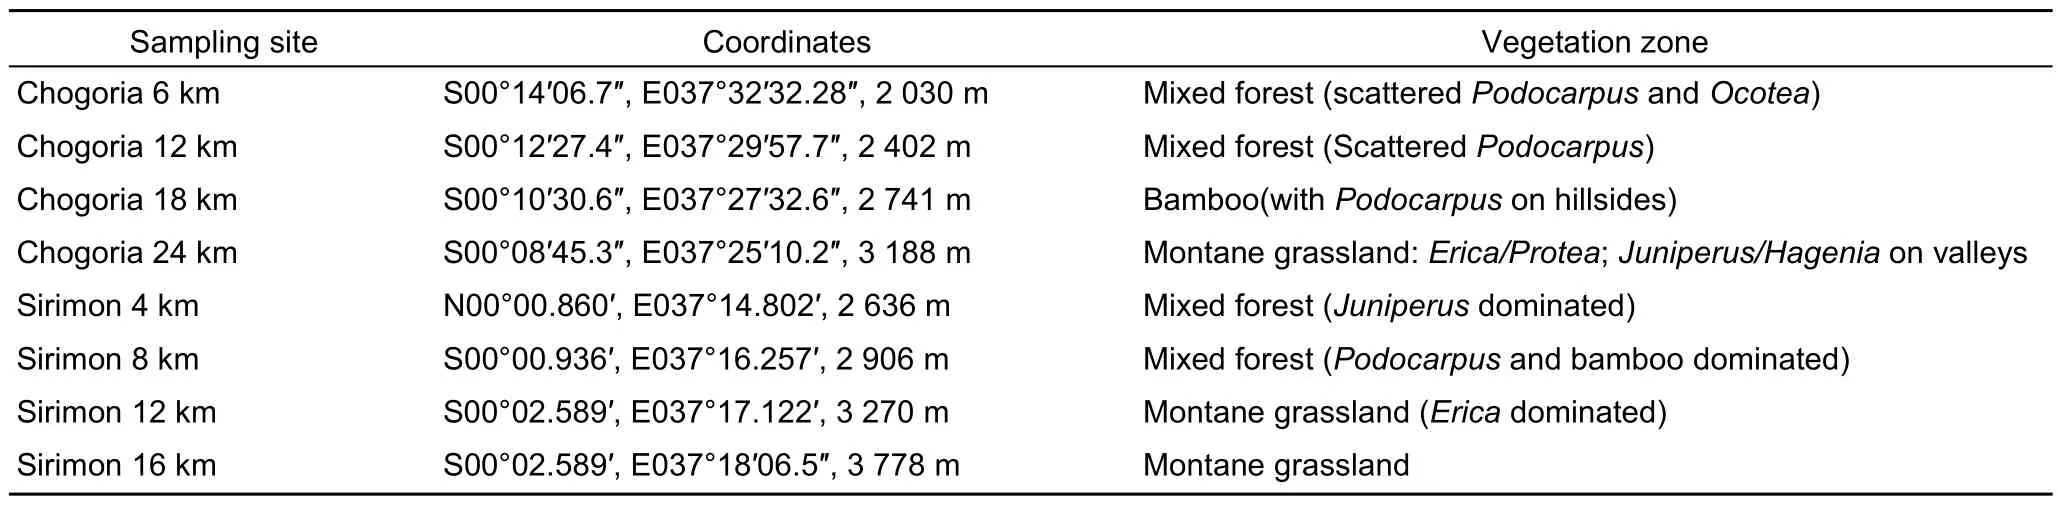
Table 1 Eight sampling sites selected on both Chogoria and Sirimon transect routes
Statistical analysis
Species richness and diversity for every collecting site was estimated from the TLS data using EstimateS 8.2 (Colwell,2009). Species diversity was estimated using the Shannon Index (H′). Chao 1, ACE, and Jackknife 1 species richness estimators were used and compared to the observed species(Sobs). Species accumulation curves of observed species were generated using EstimateS based on 1 000 randomizations. In the curves, the species richness was plotted as a function of the accumulated number of samples (number of time-limited searches). One way ANOVA was used to test the differences in mean species diversity among the different vegetation types in the two transects. Data were analyzed with STATISTICA 6.0(StatSoft, 2001) with a significance level of 5%.
RESULTS
Species richness and diversity
Trapping was unsuccessful; only one specimen was caught during the sampling period. TLS and VES were the most successful methods (Table 2) of assessing the species diversity.Species diversity indices in the Chogoria transect for forest,bamboo and montane zones were 1.71, 0.92 and 0.92, respectively, and 0.69, 0.56 and 0.92 for Sirimon, respectively. Species diversity among the two transect vegetation zones differed highly significantly (ANOVA: F1,4=47.02, n=6, P=0.0023).Though diversity was highest in the forest zone in Chogoria, the alpine zone hosted the most species. In comparison, Sirimon had very poor species richness and diversity (Table 2).Whereas the entire Sirimon transect had five species, species were confined to habitat edges.
Observed species richness and number of individuals per transect differed among vegetation types. In the alpine/monatne zoneTrachylepis variaandAdolfus alleniwere the most abundant species in Chogoria and Adolfus jacksoni on the forest zone. In Sirimon, species abundance was generally very low in the entire transect. In its alpine/montane zone Adolfus alleni andTrioceros schubotziwere the only species encountered,and then only occasionally.
The first order Jackknife estimator of species richness was higher than the real number of species observed (Sobs) in most of the counts. In the lower alpine/montane and indigenous zones of Chogoria, the species accumulation curve did not reach an asymptote (Figure 1), indicating that more species could be recorded with additional sampling. However, the curves plateaued for Sirimon transect sitesindicating that it was unlikely that additional sampling would discover more species.

Table 2 Numbers of species recorded in different habitat types using the three methods along the two transects
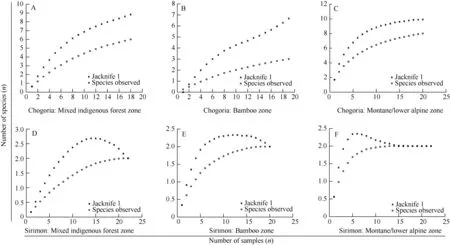
Figure 1 Species accumulation curves of the two transect sites with more than one observed species showing species richness in different vegetation zones
Elevational species turnover
There is no support for the hypothesis that amphibian and reptilian composition does not change with elevation. Ecological separations of some species occurred clearly as elevation changed (Figure 2). The chameleonTrioceros schubotziwas found mainly above 3 000 m while its relative,Trioceroshoehnelii, occupied in areas from around 3 100 m and below.Trioceros jacksoni also occurred up to an elevation of about 3 000 m. Some lizards normally known to occur above 3 000 m,such asTrachylepis irregularisandAdolfus alleni, were recorded below this elevation. For example, A. alleni occurred in a grassland (natural seasonal grassed dam or forest glade)patch at 2 400 m. This was within the Chogoria forest zone inhabited byA. jacksoni. There was no clear species richness pattern because species richness peaked twice (Figure 3).

Figure 2 Elevational ranges (m) of reptiles and amphibians on Mt. Kenya
DISCUSSION
The results show that the abundance and richness of species differ significantly among the three vegetation types (forest,bamboo, montane). Montane (lower alpine, 3 000-4 000 m) and the lower forest zone (1 700-2 000 m) have the greatest number of species. Time-limited searching shows that the bamboo zone is very depauperate in both species richness and species abundance. This is a common feature of pure stands of vegetation such as exotic plantations (Evans, 1982). In general,more species occur in Chogoria, which is on the windward side and receives more rainfall, than Sirimon, which is on the leeward side and dry.
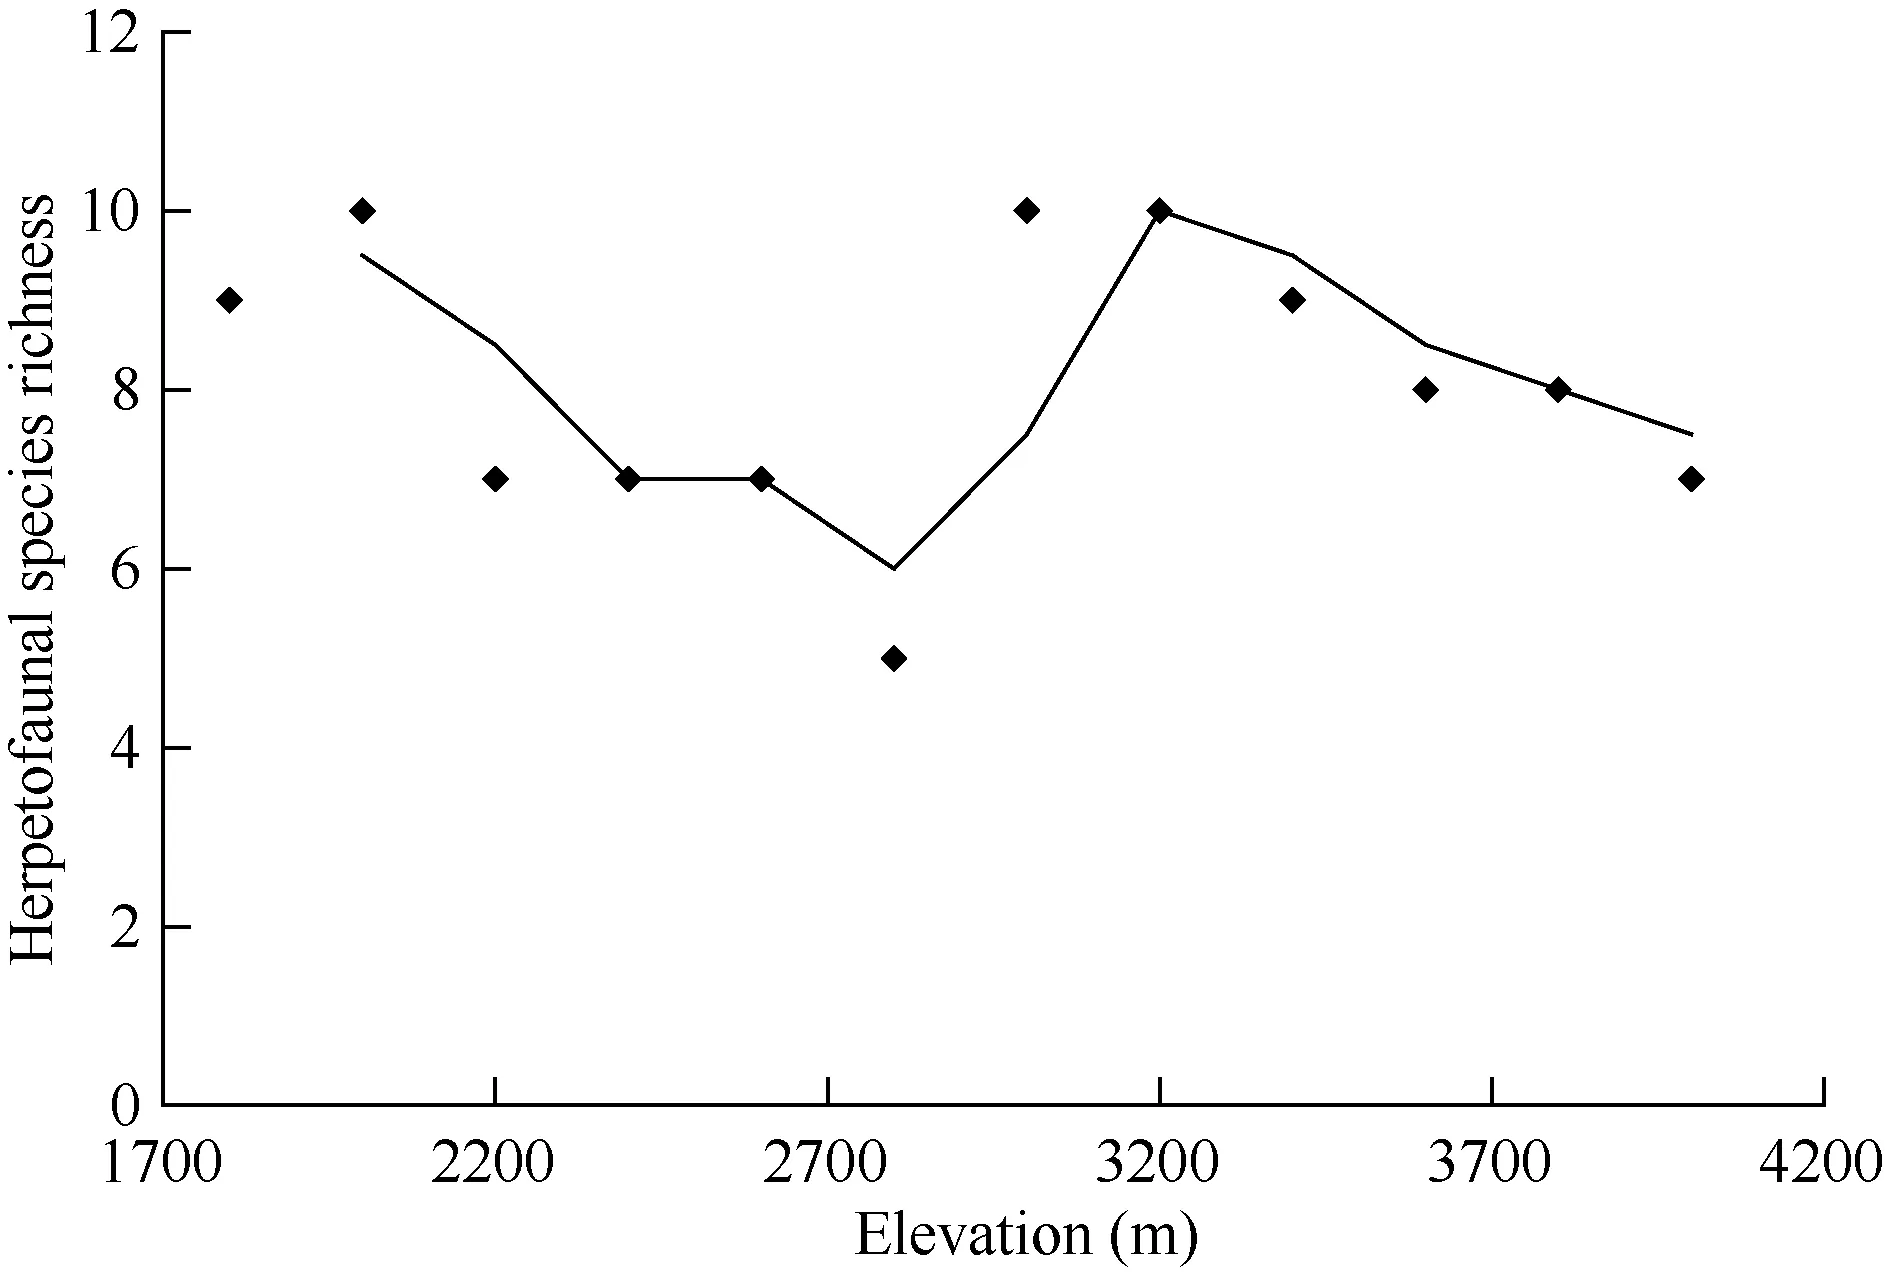
Figure 3 Elevational pattern of species richness along the Chogoria transect
The results demonstrate mixed patterns of species turnover with more species at the mixed forest zone around 1 700-2 200 m and at mid-elevation around 3 000 m as the mountain rise up to around 5 200 m. The results does not support the hypothesis that amphibian and reptilian composition does not change with elevation. Species richness increases with increasing elevation up to a certain level. Although there is no data for amphibians during the wet season in this study, reptile species richness peaks between 3 000 m and 4 000 m (lower alpine zone) and exceeds that of the forest zone (1 700-3 000 m). The species of reptiles in the lower alpine zone are those reported by Andrén (1976) from the lower alpine zone of Aberdare and Mt. Kenya National Parks.
The higher number of species in Chogoria compared to Sirimon likely owes to high rainfall and intermediate temperatures. Rainfall and temperature have been shown to serve as indirect measures of primary productivity for birds(van Rensburg et al, 2002), ants (Sanders et al, 2003) and amphibians (Malonza & Veith, 2012). The pattern of more species at low and mid elevations in this study agrees with patterns reported for a wide range of taxonomic groups,such as small mammals (Heaney, 2001) and tree frogs(Smith et al, 2007). High species richness at lower elevations (Chogoria) associates with high energy and productivity (e.g., Hawkins et al, 2003a; Willig et al, 2003). However,past studies have repeatedly shown that many taxonomic groups including birds, amphibians, invertebrates, mammals and plants exhibit mid-elevational peaks, the so-called middomain effect (MDE) in species-richness (e.g., Rhabek,1997; Sanders, 2002; Sanders et al, 2003; McCain, 2004;Smith et al, 2007). However, in the Mt. Kenya ecosystem this, this does not occur due to the concurrent influences of latitude and elevation.
The total number of species recorded in this study may not be exhaustive and more studies are highly recommended covering different seasons. Mt. Kenya is a diverse ecosystem that is underexplored and new species may still exist. The endemic Mt. Kenya Puddle frog Phrynobatrachus irangi was not recorded during this period despite being expected especially in Chogoria forest block.
The results of this study show that elevation, temperature and rainfall are highly interdependent variables. In high elevation areas, rainfall is high while temperatures and species richness are low. Therefore, the occurrence of few species at high elevations may be due to physiological constraints (Navas, 2006).Climate (rainfall and temperature) influences primary productivity that in turn affects species diversity (Hawkins et al, 2003b;Sanders et al, 2003).
Future studies on the drivers of variation in species richness along environmental gradients should consider the multiple mechanisms that contribute to the pattern. This study indicates that elevation, temperature and rainfall influence the regional species richness of reptiles and amphibians on Mt. Kenya.
ACKNOWLEDGEMENTS
I wish to thank my colleagues Vincent Muchai, Joash O. Nyamache and Jacob M. Ngwava who participated in the field work. Security in the forest and park was provided by Kenya Wildlife Service (KWS) and Kenya Forest Service (KFS) rangers. All the other transport and logistical support was organized by KWS management. This study was part of a general biodiversity work support by IFAD/GEF through Kenya Wildlife Service Mt. Kenya East Pilot project (MKEPP).
Andrén C. 1976. The reptile fauna in the lower alpine zone of Aberdare Mountains and Mt. Kenya. British Journal of Herpetology, 5 (7): 566-575.
Carpenter C. 2005. The environmental control of plant species density on a Himalayan elevation gradient.Journal of Biogeography,32(6): 999-1018.
Colwell RK. 2009. EstimateS: Statistical estimation of species richness and shared species from samples. Version 8.20. User’s Guide and Application.Department of Ecology and Evolutionary Biology, University of Connecticut,Storrs. Available from: http: //viceroy.eeb.uconn.edu/estimates.
Colwell RK, Rahbek C, Gotelli NJ. 2004. The mid-domain effect and species richness patterns: What have we learned so far?American Naturalist,163(3): E1-E23.
Corn PS. 1994. Straight-line drift fences and pitfall traps. In: Heyer WR,Donnelly MA, McDiarmid RW, Hayek LC, Foster MS (Eds). Measuring and Monitoring Biological Diversity: Standard Methods for Amphibians. Washington DC: Smithsonian Institution Press, pp109-117.
Evans J. 1982. Plantation in the Tropics. Oxford: Claredon Press.
Hawkins BA, Field R, Cornell HV, Currie DJ, Guegan JF, Kaufman DM, Kerr JT, Mittelbach GG, Oberdorff T, O’Brien EM, Porter EE, Turner JRG. 2003a.Energy, water and broad-scale geographic patterns of species richness.Ecology,84(12): 3105-3117.
Hawkins BAE, Porter E, Diniz-Filho JAF. 2003b. Productivity and history as predictors of the latitudinal diversity gradients of terrestrial birds.Ecology,84(6): 1608-1623.
Heaney LR. 2001. Small mammal diversity along elevational gradients in the Philippines: an assessment of patterns and hypotheses.Global Ecology and Biogeography,10(1): 15-39.
Heyer WR, Donnelly MA, McDiarmid RW, Hayek LC, Foster MS (Eds).1994. Measuring and Monitoring Biological Diversity: Standard Methods for Amphibians. Washington DC: Smithsonian Institution.
Karns DR. 1986. Field Herpetology: Methods for the study of amphibians and reptiles in Minnesota. James Ford Bell Museum of Natural History,University of Minnesota, Occasional Paper: No. 18 September.
Malonza PK, Veith M. 2012. Amphibian community along elevational and habitat disturbance gradients in the Taita Hills, Kenya.Herpetotropicos,7(1-2): 7-16.
McCain CM 2004. The Mid-domain effect applied to elevational gradients:species richness of small mammals in Costa Rica.Journal ofBiogeography,31(1): 19-31.
Navas CA. 2006. Patterns of distribution of anurans in high Andean tropical elevations: Insights from integrating biogeography and evolutionary physiology.Integrative and Comparative Biology,46(1): 82-91.
Rahbek C. 1997. The relationship among area, elevation and regional species richness in Neotropical birds.American Naturalist,149(5): 875-902.Rhabek C. 2005. The elevational gradient of species richness: a uniform pattern?Ecology letters8 (2): 224-239.
Reilly SM. 1982. Ecological notes onChamaeleo schubotzifrom Mount Kenya.Journal of the Herpetological Association of Africa,28: 1-3.
R?del MO, Ernst R. 2004. Measuring and monitoring amphibian diversity in tropical forests. I. An evaluation of methods with recommendations for standardization.Ecotropica,10: 1-14.
Sanders NJ. 2002. Elevational gradients in ant species richness: area,geometry, and Rapoport’s rule.Ecography,25(1): 25-32.
Sanders NJ, Moss J, Wagner D. 2003. Patterns of ant species richness along elevation gradients in an arid ecosystem.Global Ecology and Biogeography,12(2): 93-102.
Sanders NJ, Rahbek C. 2012. The patterns and causes of elevational gradients.Ecography35:1-3.
Smith SA, De Oca ANM, Reeder TW, Wiens JJ. 2007. A phylogenetic perspective on elevational species richness patterns in Middle American treefrogs: why so few species in lowland tropical rainforests?Evolution,61(5): 1188-1207.
Sutherland WJ (Ed). 1996. Ecological Census Techniques: A Handbook.UK: Cambridge University Press.
Van Rensburg BJ, Chown SL, Gaston KJ 2002. Species richness, environmental correlates, and spatial scale: A test using South African birds.The American Naturalist,159(5): 566-577.
Veith M, L?tters S, Andreone F, R?del MO. 2004. Measuring and monitoring amphibians diversity in tropical forests. II. Estimating species richness from standardized transect censing.Ecotropica,10(2): 85-99.
Watkins JE, Cardelús C, Colwell RK, Moran RC. 2006. Species richness and distribution of ferns along an elevational gradient in Costa Rica.American Journal of Botany,93(1): 73-83.
Willig MR, Kaufman DM, Stevens RD. 2003. Latitudinal gradients of Biodiversity: Pattern, process, scale and synthesis.Annual Reviews of Ecology and Evolutionary Systematics,34(1): 273-309.

- Zoological Research的其它文章
- Morphometric studies of genus Placocheilus (Teleostei:Cypriniformes) from Red River, China
- Stress-relevant social behaviors of middle-class male cynomolgus monkeys (Macaca fascicularis)
- Morphometric variability of Arctodiaptomus salinus(Copepoda) in the Mediterranean-Black Sea region
- Accelerated evolution of constraint elements for hematophagic adaptation in mosquitoes
- Physiological approaches to understanding molecular actions on dorsolateral prefrontal cortical neurons underlying higher cognitive processing
- Editor’s comments