Revision of P-wave Velocity and Thickness of Hydrate Layer in Shenhu Area, South China Sea
GONG Jianming, ZHANG Xunhua ZOU Changchun, CHEN Qiang WANG Lichen, YUAN Chunfang, HU Gaowei and JIANG Yubo
1) Key Laboratory of Marine Hydrocarbon Resources and Environmental Geology, Qingdao Institute of Marine Geology, Qingdao 266071, P. R. China
2) School of Geophysics and Information Technology, China University of Geosciences (Beijing), Beijing 100083, P. R. China
3) College of Geoscience and Surveying Engineering, China University of Mining and Technology (Beijing), Beijing 100083, P. R. China
4) College of Marine Geosciences, Ocean University of China, Qingdao 266100, P. R. China
Revision of P-wave Velocity and Thickness of Hydrate Layer in Shenhu Area, South China Sea
GONG Jianming1),*, ZHANG Xunhua1), ZOU Changchun2), CHEN Qiang1), WANG Lichen2), YUAN Chunfang3), HU Gaowei1), and JIANG Yubo1),4)
1) Key Laboratory of Marine Hydrocarbon Resources and Environmental Geology, Qingdao Institute of Marine Geology, Qingdao 266071, P. R. China
2) School of Geophysics and Information Technology, China University of Geosciences (Beijing), Beijing 100083, P. R. China
3) College of Geoscience and Surveying Engineering, China University of Mining and Technology (Beijing), Beijing 100083, P. R. China
4) College of Marine Geosciences, Ocean University of China, Qingdao 266100, P. R. China
To revise P-wave velocity and thickness of the hydrate layer in the Shenhu area of the South China Sea, acoustic and resistivity logging curves are reanalyzed. The waterlogging phenomenon is found in the shallow sediments of five drilling wells, which causes P-wave velocity to approximate the propagation velocity of sea water (about 1500 m s-1). This also affects the identification of the hydrate layer and results in the underestimate of its thickness. In addition, because there could be about a 5 m thick velocity ramp above or below the hydrate layer as interpreted by acoustic and resistivity logging curves, the recalibrated thickness of this layer is less than the original estimated thickness. The recalibrated P-wave velocity of the hydrate layer is also higher than the original estimated velocity. For the drilling well with a relatively thin hydrate layer, the velocity ramp plays a more important role in identifying and determining the thickness of the layer.
velocity ramp; thickness; hydrate layer; Shenhu area
1 Introduction
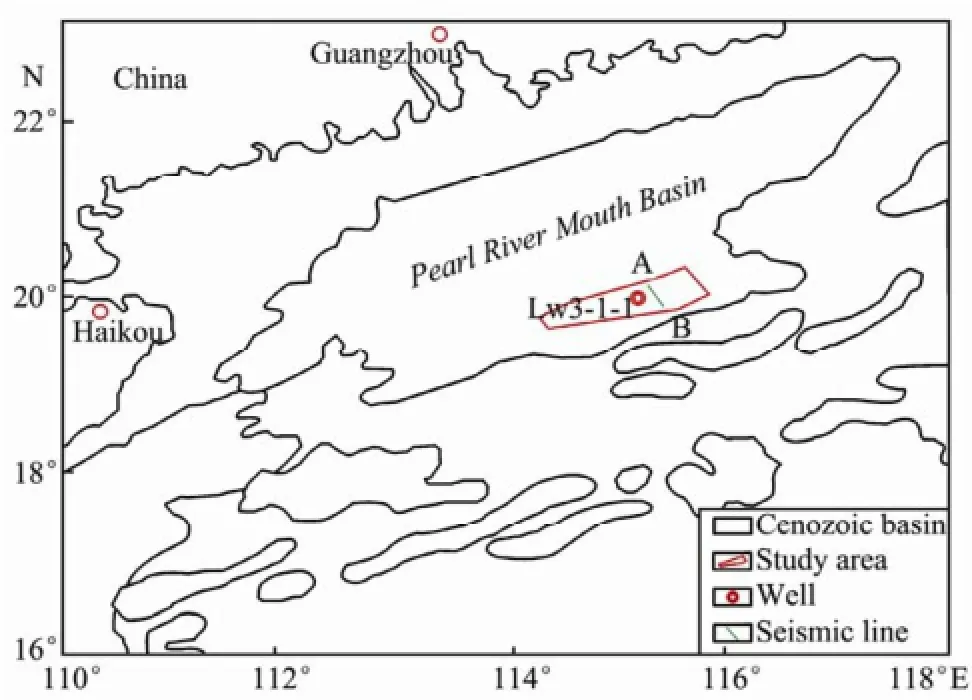
The Shenhu area is located in the southeast of the Pearl River Mouth Basin between the Xisha Trough and Dongsha Islands in the middle of the continental slope of the northern South China Sea (Wu et al., 2007) (Fig.1). There exist large Cenozoic sedimentary thickness and rich sedimentary organic matter in this area. A number of large and medium-sized oil and gas fields have been discovered here. For instance, the LW3-1-1 gas field with the resource attaining about 1000×108m3is located only 40 km from the hydrate-drilled portion of the Shenhu area. Therefore, the gas resource of hydrate in this area is considerable. Since the Mesozoic, three tectonic movements have occurred in this area, and numerous fractures and gas chimneys were produced. These tectonic structures furnish the conduit system and reservoir space for the formation and accumulation of hydrate, and provide conditions for the migration of hydrocarbon gases, turbidity fans, slumping blocks, canyon waterways and other sedimentary bodies (Gong et al., 2010, 2011; Zhang, 2007).

Fig.1 Map of the study area in the South China Sea (modified from Wu et al., 2007). The red cycle is the LW3-1-1 well; the green line is a seismic section.
In 2007, China Geological Survey conducted the gas hydrate drilling in the Shenhu area. Hydrate samples were taken in three (A, B, C) of the eight drilled wells (Wu et al., 2007; Liang et al., 2006). According to the analysis of drilling data and seismic profiles of the three wells, the seismic profile at well B shows the largest amplitude, the best continuity, and the most obvious augen blanking zoneof the bottom-simulating reflector (BSR) (Fig.2). However, the hydrate layer of this well has the smallest thickness of 17.5 m and the smallest velocity of 1900 m s-1(Table 1). Why does well B having such a thickness and velocity display the largest amplitude and the smoothest continuity of BSR? One hypothesis is that free gas exists under the hydrate layer (Liang et al., 2009). To further address this question, potential errors are discussed using the acoustic logging curve to determine the thickness and acoustic velocity of the hydrate layer, and the BSR characteristics of well B are investigated in the next section.

Fig.2 Seismic reflection profile of well B in Shenhu area, South China Sea (modified from Liang et al., 2009).

Table 1 Hydrate layer thicknesses at three hydrate-bearing drilling wells in Shenhu area
2 Well Logging Method
The logging combination, logging parameters and interpretation of logging data in investigated area are based on the range of the gas hydrate stability zone and the BSR characteristics interpreted from the seismic profile (Zou and Shi, 2003; Lu et al., 2008). To obtain hydrate samples from the drilling cores, two wells were drilled at the same site. The first hole was the pilot to confirm the hydrate horizon through wireline logging; the second was designed for coring. The logging combination consists of seven instruments–gamma ray, resistivity logging, density logging, full-wave acoustic logging, temperature-azimuth logging, caliper logging, and neutron logging tools. The logging parameters include gamma ray, deep and shallow resistivity, long and short spacing density, P-wave and S-wave velocity, well temperature, well deviation, well azimuth, caliper, long and short spacing neutron count rate, and others (Fan and Zhu, 2011).
There are system and non-system measurement errors (Liang et al., 2010). Because gas hydrate in the Shenhu area accumulates in unconsolidated sediments, non- system errors caused by sidewall collapse and waterlogging are common and can be eliminated by selecting the standard well and standard curve. According to the normal distribution of measured values on the curve, the environmental correction for interval transit time and the process of decompaction and compaction have been done (Lu et al., 2008).
To revise the thickness of hydrate and P-wave velocity in the Shenhu area, the above-mentioned deep and shallow resistivity, P-wave velocity and other parameters were analyzed before (Mathews, 1986; Paull et al., 2000; Tréhu et al., 2003). In this study, the impact of the ubiquitous waterlogging phenomenon of hydrate was investigated.
3 Results
3.1 P-Wave Velocity Response of Hydrate Layer in Shenhu Area
Generally speaking, P-wave velocities in the eight drilling wells slowly increased from top to bottom. However, the logging velocity was nearly constant between the seafloor and 125 mbsf for most of drilling wells. Below 125 m, velocity changed with lithology variation (e.g., the varied section of gamma ray logging corresponding to wells D, E, and C). With regard to the hydrate layer, the velocities had abnormally high values relative to the background value (Liang et al., 2009; Lu and Liang, 2008). The velocity of hydrate-bearing sediments in well A reached2200 m s-1, but the velocity above or below the hydrate layer fell after a rise, to about 1800 m s-1. The corresponding velocity in well B reached 1900 m s-1; the velocity above the hydrate layer was 1800 m s-1, but below this layer it was only 1600 m s-1, for which the speculation is due to the existence of a free gas. Finally, the velocity of hydrate-bearing sediments in well C was 2400 m s-1, and the velocity above the hydrate layer was about 1900 m s-1.
It was found that the velocity of the hydrate-bearing section was significantly higher than that of the non- hydrate section at wells A and C. At well B, the velocity of the hydrate-bearing section was not much higher than that of the non-hydrate section above the hydrate layer.
3.2 Effects of Waterlogging Phenomenon on P-Wave Velocity
In general, the P-wave velocity of hydrate-bearing sediments is greater than that of non-hydrate sediments. However, for loose non-hydrate sediments influenced by seawater, this velocity is reduced, which may greatly impact the velocity of the sedimentary strata.
Normally, the waterlogging phenomenon leads to two kinds of variations in the velocity logging curve. First, the logging velocity is close to seawater velocity. Second, there is a decrease in swing amplitude of the velocity curve (lower frequency) (He et al., 2010; Wang, 2012). In view of these characteristics, the data collected at the eight drilling wells were analyzed and the waterlogging phenomenon was found in five of them. The P-wave velocity was about 1500 m s-1, close to the velocity of wave propagation in seawater or unconsolidated seabed surface sediments (Fig.3). In three of these five wells, there could be the second waterlogging phenomenon near the BSR. If the waterlogging occurred in the hydrate layer, the P-wave velocity could be underestimated, and the correct thickness of the hydrate layer could be difficult to obtain.

Fig.3 P-velocities of 4 drilling wells in Shenhu area (modified from Lu et al., (2008)). A, C–hydrate-bearing drilling wells; G, C, H–waterlogging drilling wells.
3.3 Effects of Velocity Ramp on Hydrate Layer Thickness
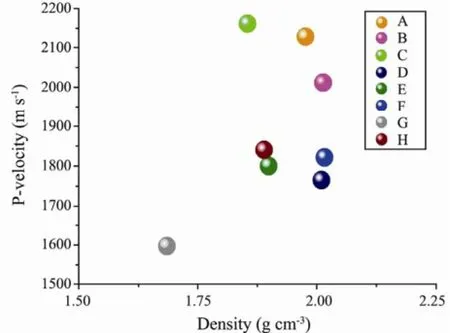
As mentioned above, the P-wave velocity of hydratebearing sediments is significantly higher than that of non-hydrate sediments. From the plot of density versus P-wave velocity in the hydrate layer based on seismic profiles (Fig.4), the velocities at wells A and C reach to 2130 m s-1and 2170 m s-1, respectively, which are significantly greater than those at non-hydrate-bearing drilling wells (such as D, E, F, G, H). The velocity at well B is about 1900 m s-1, which is a little higher than those at nonhydrate-bearing drilling wells.

Fig.4 Average density versus P-wave velocity in hydrate layer based on seismic profiles. A, B, C–hydrate-bearing drilling wells, D, E, F, G and H–non-hydrate-bearing drilling wells.
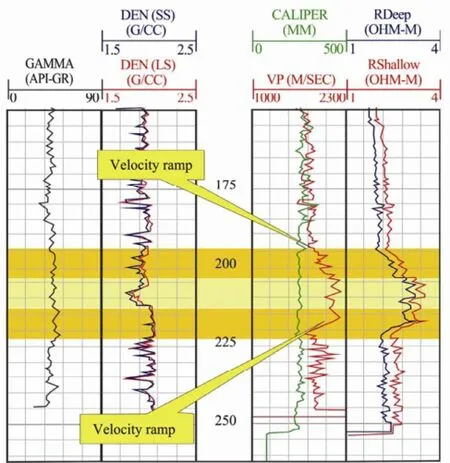
To explain the velocity difference, the acoustic and resistivity logging curves in the hydrate layer at well A were reanalyzed and the thickness and actual velocity in the hydrate layer at well B recalibrated. Table 1 lists the statistical results of the hydrate layer thicknesses from the logging data. The dagger represents the data from the cruise report, and the double dagger the recalibrated results. The differences between the two datasets may be caused by the velocity ramp above or below the hydrate layer (or the half amplitude point), which is considered the outer edge of the hydrate layer. Therefore, the mature hydrate layer thickness is at least 5 m less than the originally estimated thickness (Fig.5).
Fig.5 shows the thickness and velocity ramp of the hydrate layer at well A, which is recalibrated from Table 1. As seen in the figure, the P-wave velocity increases gradually from the outer edge of the hydrate layer to the mature core, forming the velocity ramp, which indicates that the ramp thickness can reach 5 meters from drilling wells C and A. It is also seen that the velocity logging curve of the hydrate layer at well B is within the range of the velocity ramp, and the velocity of the hydrate layer at the well is the average velocity with the velocity ramp, therefore the hydrate layer velocity in Fig.4 is underestimated. To obtain the actual velocity of the thin hydrate layer at well B, the velocity ramp influence must beeliminated. Fig.6 shows the plot of density versus P-wave velocity that was recalculated after eliminating that influence. As seen in Fig.6, the velocity of the hydrate layer at well B is clearly increased to nearly 2000 m s-1, while the velocities of hydrate layers at wells C and A almost remain unchanged. Generally, if the thickness of a hydrate layer is less than 5 m, the velocity of the hydrate layer will be underestimated. Because the velocity of the actual hydrate layer at well B is relatively high, it is assumed that free gas is under the BSR (Liang et al., 2009). Therefore, it can be understood that the seismic profile of well B possesses the characteristics of the largest BSR amplitude, the greatest continuity, and the most obvious augen blanking zone.

Fig.5 Logging curve of well A with velocity ramp (modified from Liang et al. (2009)).

Fig.6 Density versus P-wave velocity, recalculated by eliminating the influence of velocity ramp.
4 Discussion
Seismic attributes are obtained from relative variations of lithology and physical properties of underground strata. Parameters must be calibrated by logging data, the accuracy of which affects the parameter calibration. Because of the influence of logging device parameters, sidewall condition, logging time and other operating factors, there will be varying magnitudes of errors in the longitudinal direction, along with systematic errors at each well, during well logging. Petrophysical parameters directly calibrated by logging data may be in error. As a result, the credibility of the wireline logging response in a loose marine sediment environment is often greatly compromised (Fan and Zhu, 2011).
4.1 Impact of Waterlogging on Hydrate Layer
As mentioned above, shallow sediments are unconsolidated and waterlogging is ubiquitous. In this study, waterlogging appeared at five of eight wells and the P-wave velocity was only 1500 m s-1between the seafloor and 125 mbsf. The actual velocity of strata is obscured because of waterlogging. If there is a hydrate layer above 125 m, the high-velocity characteristics of that layer may be concealed, and thereby difficult to detect. If a hydrate layer thickness influenced by waterlogging is relatively large and hydrate saturation is high, the high resistivity of the layer can not greatly be influenced and the hydrate layer can still be identified. For this reason, the impact on the hydrate layer identification may be related to its thickness and hydrate saturation.
Recent drilling results from the Shenhu area show that hydrate is something related to waterlogging phenomenon. In two (A, B) of the three wells (A, B, F) hydrate was found without the waterlogging phenomenon ,while it was found in only one (C) of the five wells (C, D, E, G, H) with such a phenomenon. It should be noted that even in well C, there is no direct contact between the hydrate layer and the waterlogging layer, or rather there is a transition zone with gradually increased velocity (Fig.3). Therefore the waterlogging phenomenon or waterlogging layers can be used as an indirect indicator for detecting the existence of hydrate during drilling operations.
4.2 Influences on Velocity Ramp
As mentioned above, there is a 5-m thick velocity ramp above or below the hydrate layer based on the hydrate samples from the two wells. Because of limited number of drilling wells, the results might not be representative for this area. The boundary between conventionally consolidated sandstone and mudstone layers can usually be determined by the half amplitude point, and then the thicknesses of the two layers can be confirmed. However, the boundary between the hydrate and non-hydrate layers has a gradual change, and the boundary distinction is greatly influenced by the hydrate saturation; besides, the ramp is modified by the lithology of overlying strata, porosity and other factors. In particular, the ramp has a stronger impact on the hydrate layer velocity for a thin hydrate layer.
Limited by logging instruments, it is difficult to avoid the impact of the velocity ramp on velocities of hydratelayers (especially thin hydrate layers). To reduce or weaken such impacts on the hydrate layer velocities, the relationship between the thicknesses and acoustic wave velocities of hydrate layers was examined and the velocity ramp determined in this study. To obtain a better velocity ramp and a more objective hydrate layer velocity, the future study should focus on fitting the acoustic wave velocity from hydrate drilling to the crossing-well seismic velocity or on correcting the acoustic wave velocity by density-velocity and gamma-velocity methods.
5 Conclusions
The measured data at the three wells (A, B, and C) in the Shenhu area show that the velocity of the hydratebearing layer is generally higher than that of the nonhydrate layer. However, there are fewer anomalies of velocity at well B than at wells A and C. On the logging curve, the anomaly of the P-wave velocity is the primary basis for delimiting hydrate layer thickness.
The hydrate drilling wells in the Shenhu area have small depths; most of strata encountered during drilling consist of unconsolidated sediments of the late Neogene. The implementation of naked hole logging resulted in the waterlogging phenomenon at most of the drilling wells, which reduced the P-wave velocity of sedimentary strata and caused the thickness deviation of the hydrate layer.
According to the P-wave velocity data at wells A and C, a 5-m thick velocity ramp might exist above and below the hydrate layer. If the hydrate layer is thick, the influence of this ramp on the layer velocity may be slight. Note that the velocity may be underestimated for a thin hydrate layer.
After eliminating the velocity ramp influence, the hydrate layer velocity at well B was clearly increased to nearly 2000 m s-1, and the hydrate layer thickness was reduced by about 7 m and to just 10.5 m.
Acknowledgements
This work is supported by the National Natural Science Foundation of China (Nos. 41273066 and MRE200805). The authors are grateful to Dr. Jingan Lu and Prof. Chunshan Dai for their suggestions. Many thanks also go to the reviewers for their helpful comments.
Fan, Y. R., and Zhu, X. J., 2011. Review on logging responses and evaluation methods of natural gas hydrated reservoir. Well Logging Technology, 35 (2): 104-111.
Gong, J. M., He, Y. H., Yan, G. J., Yang, C. S., Li, G., and Yuan, C. F., 2011. Features and controlling factors of BSR in Shenhu area, South China Sea. Petroleum Geology & Experiment, 33 (6): 25-30.
Gong, J. M., Yang, Y. Q., Yan, G. J., Hu, X. P., Li, G., and Ma, L. J., 2010. Research on the bottom boundary of thermogenic gas hydrate stability zone in Shenhu area, South China Sea. Journal of China University of Mining & Technology, 39 (6): 870-876.
He, S. Y., Xie, N., Peng, H. B., and Zhang, C. X., 2010. Identification and evaluation of water flooded zones with logging data and its application. Offshore Oil, 30 (2): 91-95.
Liang, J., Wang, H. B., and Guo, Y. Q., 2006. Study of seismic velocity about gas hydrates in the northern slope of the South China Sea. Geoscience, 20 (1): 123-129.
Liang, J., Wang, M. J., Lu, J. A. ,Wang, H. B., Liang, J. Q., and Su, P. B., 2010. Logging response characteristics of gas hydrate formation in Shenhu area of the South China Sea. Geoscience, 24 (3): 506-514.
Liang, J., Wang, M. J., Wang, H. B., Lu, J. A., and Liang, J. Q., 2009. Relationship between the sonic logging velocity and saturation of gas hydrate in Shenhu area, northern slope of South China Sea. Geoscience, 23 (2): 217-223.
Lu, J. A., and Liang, J. Q., 2008. The impact analysis of disseminated gas hydrates on reservoir properties. Geological South China Sea, 20 (1): 55-57.
Lu, J. A., Yang, S. X., Wu, N. Y., Zhang, G. X., Zhang, M., and Liang, J. Q., 2008. Well logging evaluation of gas hydrates in Shenhu area, South China Sea. Geoscience, 22 (3): 447-451.
Mathews, M., 1986. Logging characteristics of methane hydrate. The Log Analyst, 27: 26-63.
Paull, C. K., Matsumoto, R., and Wallace, P. J., 2000. Proceedings of the Ocean Drilling Program Leg164, Scientific Results. College Station, Ocean Drilling Program, Texas.
Tréhu, A. M., Bohrmann, G., Rack, F. R., et al., 2003. Proceedings of the Ocean Drilling Program Leg 204, Initial Reports. College Station, Texas: Ocean Drilling Program.
Wang, Z. J., 2012. Well logging features of water flooded zones in Shasi member Chunhua Oilfield. Journal of Oil and Gas Technology, 34 (2): 84-87.
Wu, N. Y., Zhang, H. Q., Yang, S. X., Liang, J. Q., Wang, H. B., Su, X., Lu, Z. Q., Fu, S. Y., Zhang, G. X., and Lu, J. A., 2007. Preliminary discussion on natural gas hydrate reservoir system of Shenhu area, north slope of South China Sea. Natural Gas Industry, 27 (9): 1-6.
Zhang, S. L., 2007. Accumulation conditions and prospect for natural gas hydrate resources in Baiyun Sag, Pearl River Mouth Basin. China Petroleum Exploration, 6: 23-27.
Zou, C. C., and Shi, K., 2003. Well logging features of gas hydrate reservoir. World Well Logging Technology, 18 (6): 32-34.
(Edited by Xie Jun)
(Received December 17, 2012; revised September 12, 2013; accepted May 13, 2014) ? Ocean University of China, Science Press and Springer-Verlag Berlin Heidelberg 2014
* Corresponding author. Tel: 0086-532-80778387
E-mail: gongjianm@aliyun.com
 Journal of Ocean University of China2014年5期
- Journal of Ocean University of China的其它文章
- Identification of Fucans from Four Species of Sea Cucumber by High Temperature1H NMR
- The Appearance of Ulva laetevirens (Ulvophyceae, Chlorophyta) in the Northeast Coast of the United States of America
- Metabolic and Phylogenetic Profile of Bacterial Community in Guishan Coastal Water (Pearl River Estuary),South China Sea
- Distribution and Source of Main Contaminants in Surface Sediments of Tidal Flats in the Northern Shandong Province
- Analgesis and Wound Healing Effect of Chitosan and Carboxymethyl Chitosan on Scalded Rats
- Histological Observation of Germ Cell Development and Discovery of Spermatophores in Ovoviviparous Black Rockfish (Sebastes schlegeli Hilgendorf) in Reproductive Season
