Metabolic and Phylogenetic Profile of Bacterial Community in Guishan Coastal Water (Pearl River Estuary),South China Sea
HU Xiaojuan, LIU Qing LI Zhuojia, HE Zhili, GONG Yingxue, CAO Yucheng, and YANG Yufeng
1) Institute of Hydrobiology, College of Life Science and Technology, Jinan University, Guangzhou 510632, P. R. China
2) South China Sea Fisheries Institute, Chinese Academy of Fishery Sciences, Guangzhou 510300, P. R. China
3) Institute of Environmental Genomics and Department of Microbiology and Plant Biology, University of Oklahoma, Norman, OK 73019, USA
4) Research Center for Molecular Biology, Institute of Life and Health Engineering, College of Life Science and Technology, Jinan University, Guangzhou 510632, P. R. China
5) Key Laboratory of Eutrophication and Red Tide Prevention, Education Department of Guangdong Province, Guangzhou 510632, P. R. China
Metabolic and Phylogenetic Profile of Bacterial Community in Guishan Coastal Water (Pearl River Estuary),
South China Sea
HU Xiaojuan1),2), LIU Qing1), LI Zhuojia2), HE Zhili3), GONG Yingxue4), CAO Yucheng2), and YANG Yufeng1),5),*
1) Institute of Hydrobiology, College of Life Science and Technology, Jinan University, Guangzhou 510632, P. R. China
2) South China Sea Fisheries Institute, Chinese Academy of Fishery Sciences, Guangzhou 510300, P. R. China
3) Institute of Environmental Genomics and Department of Microbiology and Plant Biology, University of Oklahoma, Norman, OK 73019, USA
4) Research Center for Molecular Biology, Institute of Life and Health Engineering, College of Life Science and Technology, Jinan University, Guangzhou 510632, P. R. China
5) Key Laboratory of Eutrophication and Red Tide Prevention, Education Department of Guangdong Province, Guangzhou 510632, P. R. China
Characteristics of a microbial community are important as they indicate the status of aquatic ecosystems. In the present study, the metabolic and phylogenetic profile of the bacterioplankton community in Guishan coastal water (Pearl River Estuary), South China Sea, at 12 sites (S1–S12) were explored by community-level physiological profiling (CLPP) with BIOLOG Eco-plate and denaturing gradient gel electrophoresis (DGGE). Our results showed that the core mariculture area (S6, S7 and S8) and the sites associating with human activity and sewage discharge (S11 and S12) had higher microbial metabolic capability and bacterial community diversity than others (S1–5, S9–10). Especially, the diversity index of S11 and S12 calculated from both CLPP and DGGE data (H >3.2) was higher than that of others as sewage discharge may increase water nitrogen and phosphorus nutrient. The bacterial community structure of S6, S8, S11 and S12 was greatly influenced by total phosphorous, salinity and total nitrogen. Based on DGGE fingerprinting, proteobacteria, especially γ- and α-proteobacteria, were found dominant at all sites. In conclusion, the aquaculture area and wharf had high microbial metabolic capability. The structure and composition of bacterial community were closely related to the level of phosphorus, salinity and nitrogen.
Microbial community; environmental factor; mariculture; CLPP; DGGE
1 Introduction
Guishan Island in Pearl River Estuary is an important base of the marine cage culture in Guangdong Province, South China (Wu et al., 2008). By 2010, Guanshan Island had developed fish cage culture of 90000 m2and achieved mariculture production of 4729 t. The over-development of aquaculture may cause a variety of environmental problems such as eutrophication, pollution, oxygen depletion and community biodiversity change in coastal ecosystems (Troell et al., 2003). Therefore, it is required to develop the environmentally friendly aquaculture ecosystems in order to benefit both environments and farmers.
Microbes distribute dissolved organic matter, increase nutrient availability and affect many eco-environmental processes (González et al., 2000). The characteristics of a microbial community are important indicators of the status of aquatic ecosystems (Paerl et al., 2002). Community level physiological profiling (CLPP) is an approach commonly used to characterizing a microbial community function according to its sole carbon source utilization pattern (Weber and Legge, 2010). Kirk et al. (2005) considered that CLPP was sensitive enough for differentiating microbial populations. Denaturing gradient gel electrophoresis (DGGE) is another popular molecular method used to assessing the microbial community structure. Cook et al. (2007) and Song et al. (2011) analyzed the microbial community structure in the sediment of various aquatic environments with DGGE. However, studying microbial community composition and its relationship with environmental factors from a single research perspective may overlook some important information. Kirk et al. (2005) considered that comprehensive information of a microbial community should be obtained from multi-ple perspectives. Sala et al. (2005) used both DGGE and CLPP in combination to studying the phylogenetic and functional diversity of bacterioplankton during Alexandrium sp. blooms.
In the present study, the effect of aquaculture on the bacterial community structure and environmental factors in Guishan coastal water was explored with CLPP and DGGE in combination with redundancy analysis (RDA). The results provide new insights into our better understanding the bacterial community structure and function, and useful information for protection of coastal microbial resources and Guishan estuarine ecosystems.
2 Materials and Methods
2.1 Studying Sites
Twelve sampling sites (S1–S12) were established around the core mariculture area in Guishan coastal water, Pearl River Estuary, South China Sea (Fig.1). S6, S7 and S8 located at the core mariculture area, S10 was close to a navigation channel, S11 was in an abandoned culture area where fishing boats were docked, and S12 was adjacent to a wharf associated with sewage discharge. S11 and S12 were frequently affected by humans, for example, passengers ferry from Zhuhai to Guishan and fishmen. There was a breakwater between S8 and S9 as well as between S10 and S11. For microbial analysis, surface water sample (0.5 m) was collected from these sites on August 8, 2011.
2.2 Environmental Property Analysis
In situ water physicochemical variables including salinity, temperature, pH value and dissolve oxygen (DO) content were determined at the sampling sites using a YSI 556 system (YSI Incorporated, USA). Transparency was measured with a Secchi disk. The concentration of nutrients including total nitrogen (TN), total phosphorus (TP), ammonia (NH4+), nitrate (NO3-), nitrite (NO2-) and phosphate (PO43-) was determined with standard methods (GB/T 12763.4-2007, China). Dissolved inorganic nitrogen (DIN) was the sum of NH4+, NO3-and NO2-. The chlorophyll a (Chl a) concentration was measured with an acetone extraction method (Lorenzen, 1967).
2.3 Community-Level Physiological Profiling (CLPP) Analysis
CLPP of the microbial community functional diversity was performed with Eco-plates (Biolog Eco-plateTM, USA). An Eco-plate contains three replicate sets of 31 carbon substrates and a control. Each sample was inoculated into an Eco-plate, 150 μL each well, to determine the metabolic potential of microbial communities. The plates were incubated at 30℃ and analyzed spectrophotomically at 590 nm every 24 h during an incubating period of 168 h. The diversity index was calculated with the data obtained at 120 h.
2.4 Denaturing Gradient Gel Electrophoresis (DGGE) Fingerprinting and Sequencing of Representative Bands
The fresh water sample was concentrated onto 0.2 μm membrane filters (Millipore) for DNA extraction. Genomic DNA was extracted from 1 L of surface water from each site using an Omega E.Z.N.A.? Water DNA Kit (Omega Bio-Tek, USA), from which the selected gene was a amplified using a nested PCR. In detail, complete 16S rRNA gene was amplified using a nested PCR with the primers 8f (5’-AGA GTT TGA TCC TGG CTC AG-3’) and 1492r (5’-GGT TAC CTT GTT ACG ACT T-3’), while the V3 region of 16S rRNA gene was amplified with primer 341f-GC (5’-CGC CCG CCG CGC GCG GCG GGC GGG GCG GGG GCA CGG GGG GCC TAG GGG AGG CAG CAG-3’) and 534r (5’-ATT ACC GCG GCT GCT GG-3’) for DGGE (Muyzer et al., 1993). The nest PCR was carried out in a mixture of 50 μL in volume containing 0.5 μL of 16S rRNA gene PCR product, 5 μL of 10×PCR buffer (TaKaRa), 1 μL of each primer (10 μmol L-1), 4 μL of 2.5 mmol L-1of dNTP (each), and 2.5 U of Taq DNA polymerase (TaKaRa). The amplification protocol included a denaturation at 94℃ for 5 min, 20 touch-down cycles at 94℃ for 45 s, 65–55℃ for 45 s (0.5℃ decrease each cycle) and 72℃ for 30 s, followed by 10 normal cycles at 94℃ for 45 s, 55℃ for 45 s and 72℃ for 30 s, and a final extension at 72℃ for 10 min.
DGGE was performed with 8% denaturing acrylamide gel containing a linear gradient (45%–65%) of denaturants (7 mol L-1urea and 40% formamide were defined as 100%). Electrophoresis was performed at 100 V, and 60℃for 12 h with a Dcode Universal Mutation Detection System (Bio-Rad Laboratories, USA). DNA was visualized with ethidium bromide staining and photographed with UV transillumination. DGGE images were used for microbial community structure comparisons with Quantity One v4.6.2.
Individual DGGE bands of interest were excised,placed in 1.5 mL sterile tubes and rinsed with 100 μL of sterile distilled water (SDW). After washing, the bands were crushed, resuspended in 30 μL of SDW, and incubated overnight at 4℃. One microliter of eluting water for each band was used as the template for the amplification of V3 region under the same condition as was used for DGGE to verify the band position and purity. One microliter of eluting water was used also to PCR amplification with the primer 341 (forward, lacking GC clamp) and 518 (reverse) by denaturing at 94℃ for 5 min, followed by 35 cycles of denaturing at 94℃ for 45 s, annealing 55℃ for 45 s, and extending at 72℃ for 30 s, and a final extension at 72℃ for 10 min. The amplifying product was purified with an Omega E.Z.N.A.? PCR Purification Kit (Omega Bio-Tek, USA), and inserted into pMD18-T (TaKaRa) according to the manufacturer’s instructions. Recombinant plasmids were amplified in E. coli with standard procedures and submitted for sequencing commercially in Shanghai Majorbio Bio-Pharm Technology Co., Ltd.
The sequences were used as queries in searching Gen-Bank with the basic local alignment search tool algorithm for homologs (Lee et al., 2010). The sequences described in this study have been deposited in GenBank with accession numbers JX195613-JX195632.
2.5 Statistical Analysis
Average well color development (AWCD) presents the potential utilization of various carbon sources by a microbial community. To compare the control and samples, AWCD was calculated from the OD595value of each well in an Eco-plate according to


where C is the OD595value of each well, R is the OD595value of control well, and n is the number of substrates used (Garland and Mills, 1991). The Shannon diversity index (H) was calculated using where Pi was calculated by the OD595value in each substrate over the total value of OD595in all the substrates (or intensity of individual DGGE band over the total intensity of all the bands), expressed as

In addition, the Shannon evenness index (E) that presents the distribution of individuals within species is given by (Moss and Bassall, 2006)

where S is the number of positive wells in each sample (or the total number of species in the sample).
A multivariate ordination method was used to analyze the relationship between microbial community structure and environmental variables in CANOCO v4.5. Detrended correspondence analysis (DCA) was performed to test whether weighted-averaging techniques or linear methods were appropriate. The longest gradient resulted from DCA of CLPP and DGGE data were 0.705 and 1.547, respectively. Accordingly, redundancy analysis (RDA) (Ter Braak and ?milauer, 2002) of CLPP and DGGE data was performed to select the environmental predictors that best explained the variance of microbial communities. Data of microbial communities were also obtained from

where Cidis the OD595value of each well on day i (or the intensity of each DGGE band), Ridis the OD595value of control well on day i (or zero for DGGE), and AWCDidis the AWCD value on day i (or the average intensity of total possible bands) (Lee et al., 2010).
3 Results
3.1 Environmental Characteristics
No significant temperature and acidity variation ofsurface water was detected among different sampling sites (Table 1). Water depth at S7, S8, S11 and S12 (inside the breakwater) was shallower than that at other sites. The DO content ranged from 5.42 to 6.67 mg L-1, generally lower at S7, S8, S9, S11 and S12 than at others. The TN and TP level ranged from 33.14 μmol L-1to 73.05 μmol L-1, and 1.07 μmol L-1to 3.31 μmol L-1, respectively, with the highest recorded at S11 and S12, respectively. The average DIN and PO43-concentrations were 26.89 μmol L-1and 0.61 μmol L-1, respectively. According to the concentration of nitrogen and phosphorus, the surface water in Guishan Island was mostly at a state of potential eutrophication with medium limited phosphorous. The Chl a concentration ranged from 0.56 μg L-1to 6.03 μg L-1.
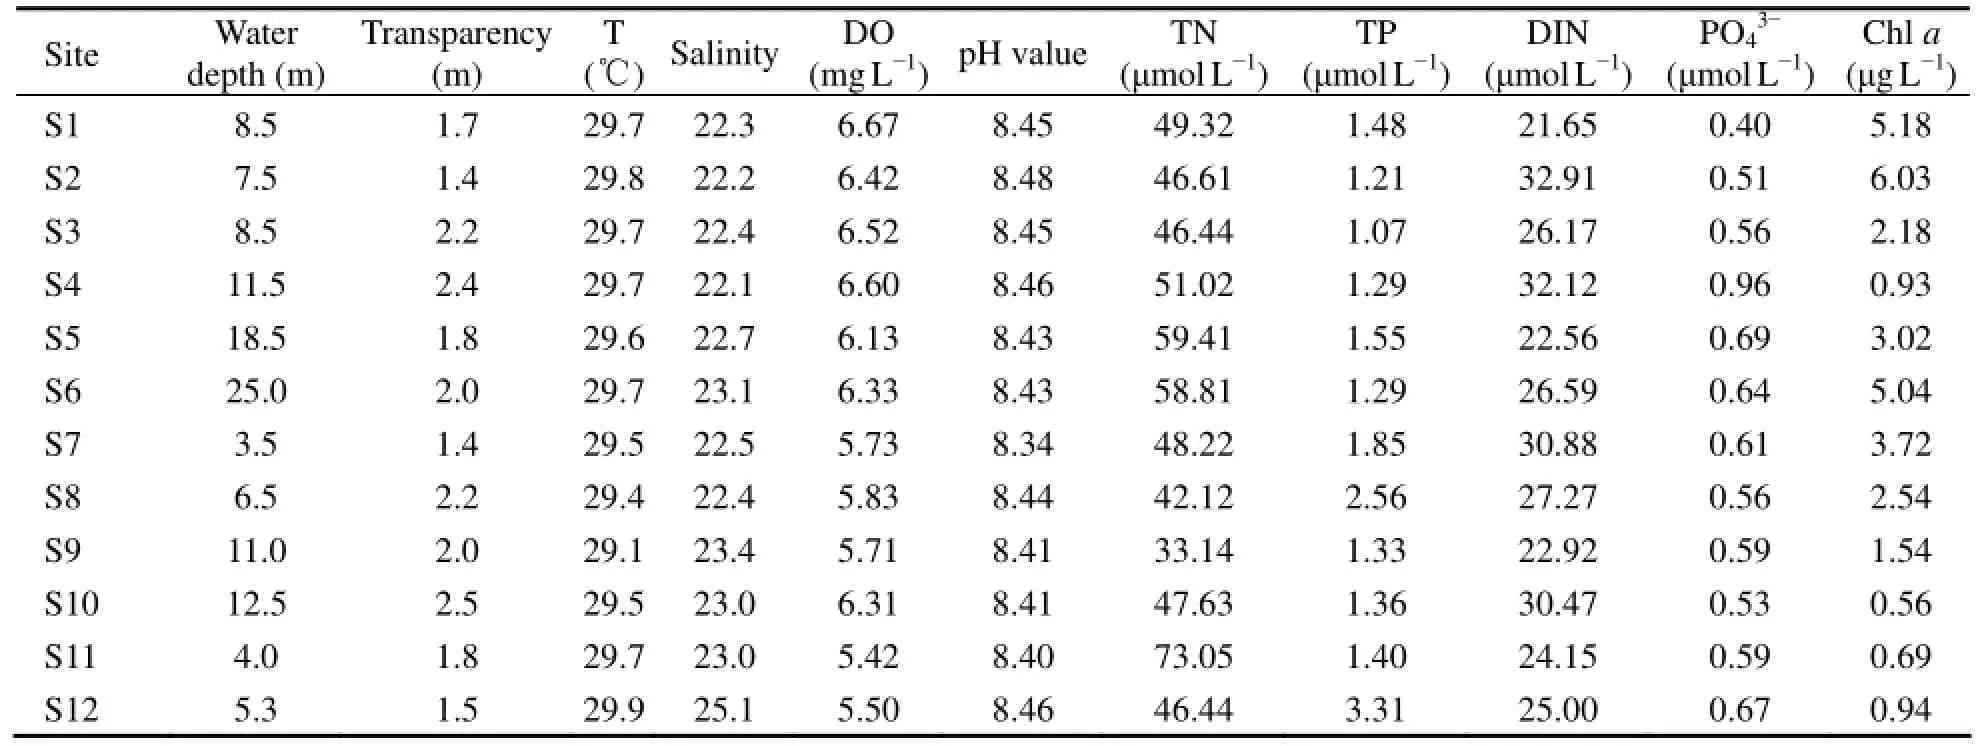
Table 1 Water physicochemical properties of the 12 sampling sites at Guishan Island
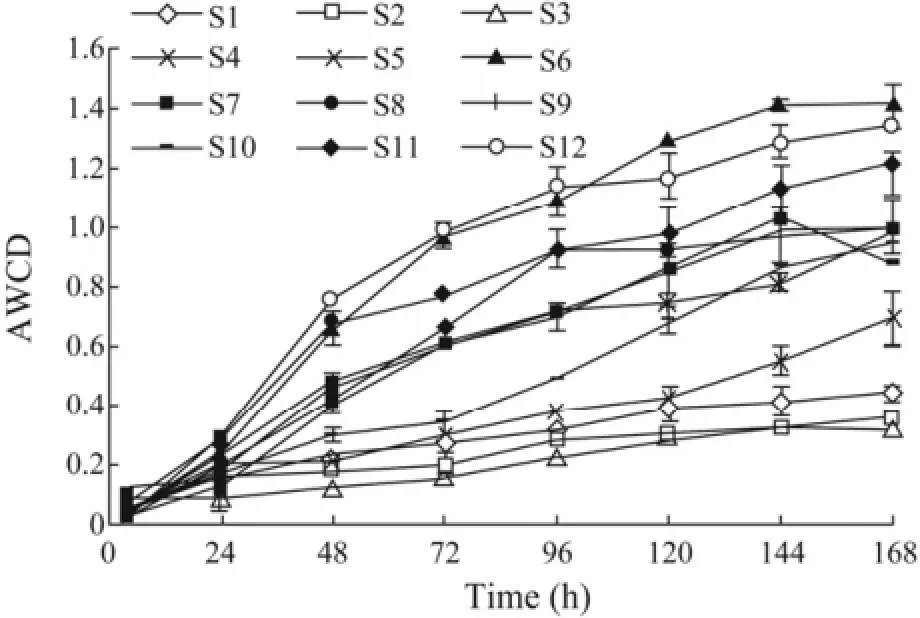
Fig.2 Variations in the average well color development (AWCD) from the community-level physiological profile assay using Eco-plates.
3.2 Metabolic Potential of Bacterial Communities Detected by CLPP
The variation in the optical density of culture suspension was measured at different time points as a microbial growth indicator (Fig.2). The samples exhibited different variation patterns with individual substrates. As an expression of heterotrophic bacterial activity, the AWCD value was generally high at S6, S12, S11, S7 and S8 associating with mariculture operations and S11 and S12 being affected by anthropogenic activities (e.g., transportation), and low at S4, S3, S2, and S1.
3.3 Phylogenetic Composition of Bacterial Communities Detected by DGGE
The DGGE profile of 12 samples sites produced 16, 21, 27, 15, 16, 17, 13, 18, 21, 25, 31 and 30 distinct bands, respectively (Fig.3). In general, S3, S10, S11 and S12 had more bands than others. There were some common bands. The prominent DGGE bands that separated the sampling sites, 25 in total, were sequenced. They represented diverse phylotypes (Table 2). In addition to S10 and S12, the most dominant bacterium at other sites was Pseudoalteromonas sp. (G7, G9, and G11) of γ-proteobacteria. The bacterial community structure at S10, S11 and S12 was different from that at others. Following γ-proteobacteria, α-proteobacteria were the second most predominantat S10, S11 and S12, especially S11 and S12. The sequenced fragments were clustered into four major phylogenetic groups, most in γ-proteobacteria and α-proteobacteria while a small proportion in cyanobacteria and uncultured bacteria. The closest relatives of retrieved from GenBank (Table 2) were 98%–100% similar to those obtained in this study.
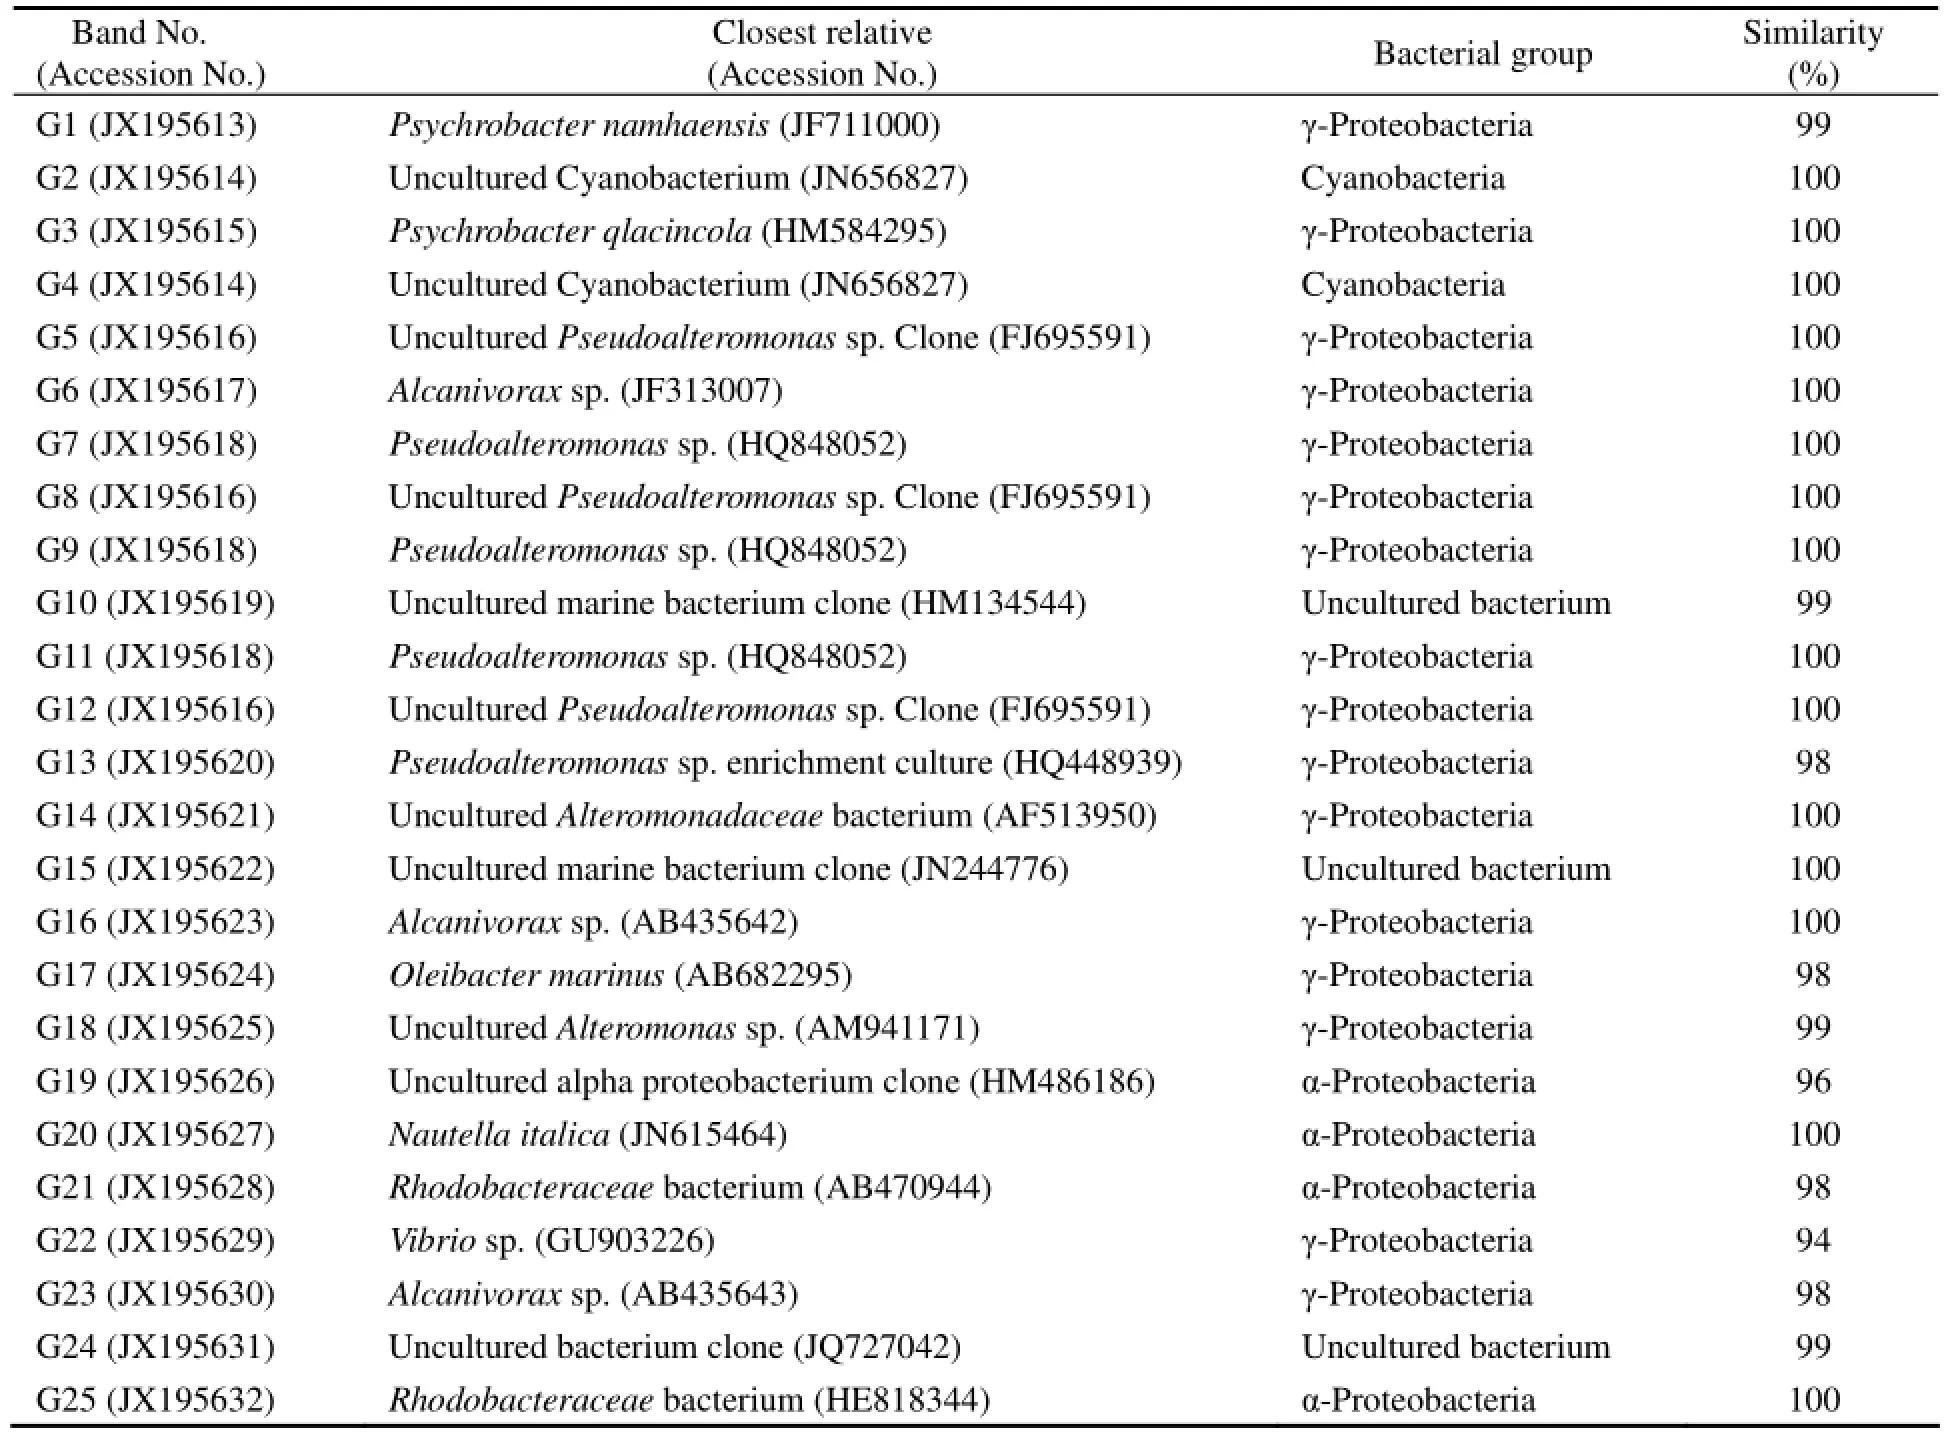
Table 2 The similarity of the sequences obtained in this study to the closest relatives and their phylogenetic affiliations
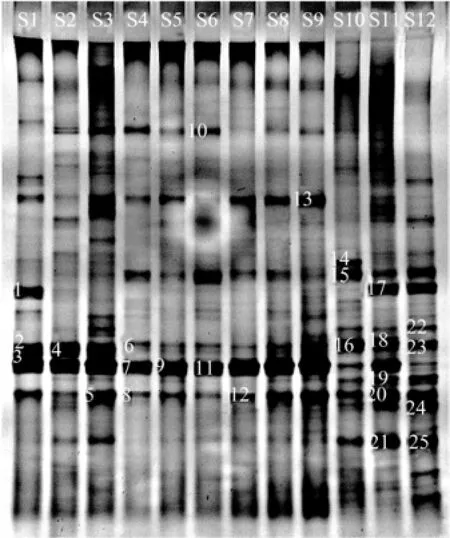
Fig.3 Denaturing gradient gel electrophoresis pattern of 16S rRNA gene fragments amplified from surface water at 12 sampling sites in Guishan Island. Sequences were obtained from the bands marked by numbers on the left. G1 through G25, band 1 through band 25 were marked.
The clustering of normalized DGGE gels was analyzed with Jacard coefficient (Table 3). The comparison analysis of DGGE bands showed that S8 and S9 were 77.9% similar with each other, the closest between sites, and S6 and S12 were 31.7% similar with each other, the farthest between sites. In total, 25 pairs of sites were >60% similar with each other, indicating that the similarity in bacterial community structure between sites was relatively high.
3.4 Microbial Diversity Detected by DGGE and CLPP
The Shannon diversity index (H) calculated from DGGE data varied in a relatively wide range (2.45–3.40), indicating that microbial diversity of the samples in terms of bacterial community structure was substantially different (Fig.4a). The DGGE-based diversity index value was >3.0 at S3, S10, S11 and S12, which was consistent with the number of distinct DGGE bands at these sites. On the contrary, the CLPP-based Shannon index showed a relatively narrow range (2.90–3.26). The highest value of CLPP-based Shannon index was found at S6, S8, S11 and S12, being similar to the result of AWCD. Similarly, the result of DGGE and CLPP indicated also higher diversity at S11 and S12 where human activity was intensive than others where human activity was weak.
The Shannon evenness index (E) calculated from DGGE data showed a small change (0.95–0.99) (Fig.4b). However, the value of CLPP-based Shannon evenness index showed large differences among sampling sites. The E values at S1, S2 and S4 were the highest because of the low ability of the microbial communities of utilizing carbon sources.
3.5 Redundancy Analysis (RDA)
RDA ordination was performed to correlate environmental factors with bacterial communities measured by DGGE (Fig.5a) and CLPP (Fig.5b). Results showed that the first two axes explained 39.0% of the total variation in DGGE profiles. TP, transparency and DIN made a great contribution to Axis 2 according to the biplot scaling of RDA (Fig.5a). Moreover, salinity and TP were the major environmental factors influencing the abundance and distribution of bacterioplankton. G7, the most dominant bacterial population, was less affected by environmental factors. Concerning the utilization property of individual substrate at 12 sites, the first axis explained 28.8% of the total variation and the first and second axes explained 46.6% of the total variation in CLPP data. Biplot scaling of RDA indicated that salinity, temperature, acidity and DO were the major environmental factors influencing bacterial communities (Fig.5b). The bacterial community structure at S6, S8, S11 and S12 based on CLPP data was greatly influenced by TP, TN and salinity.

Table 3 Jacard coefficient clustering of normalized DGGE gels
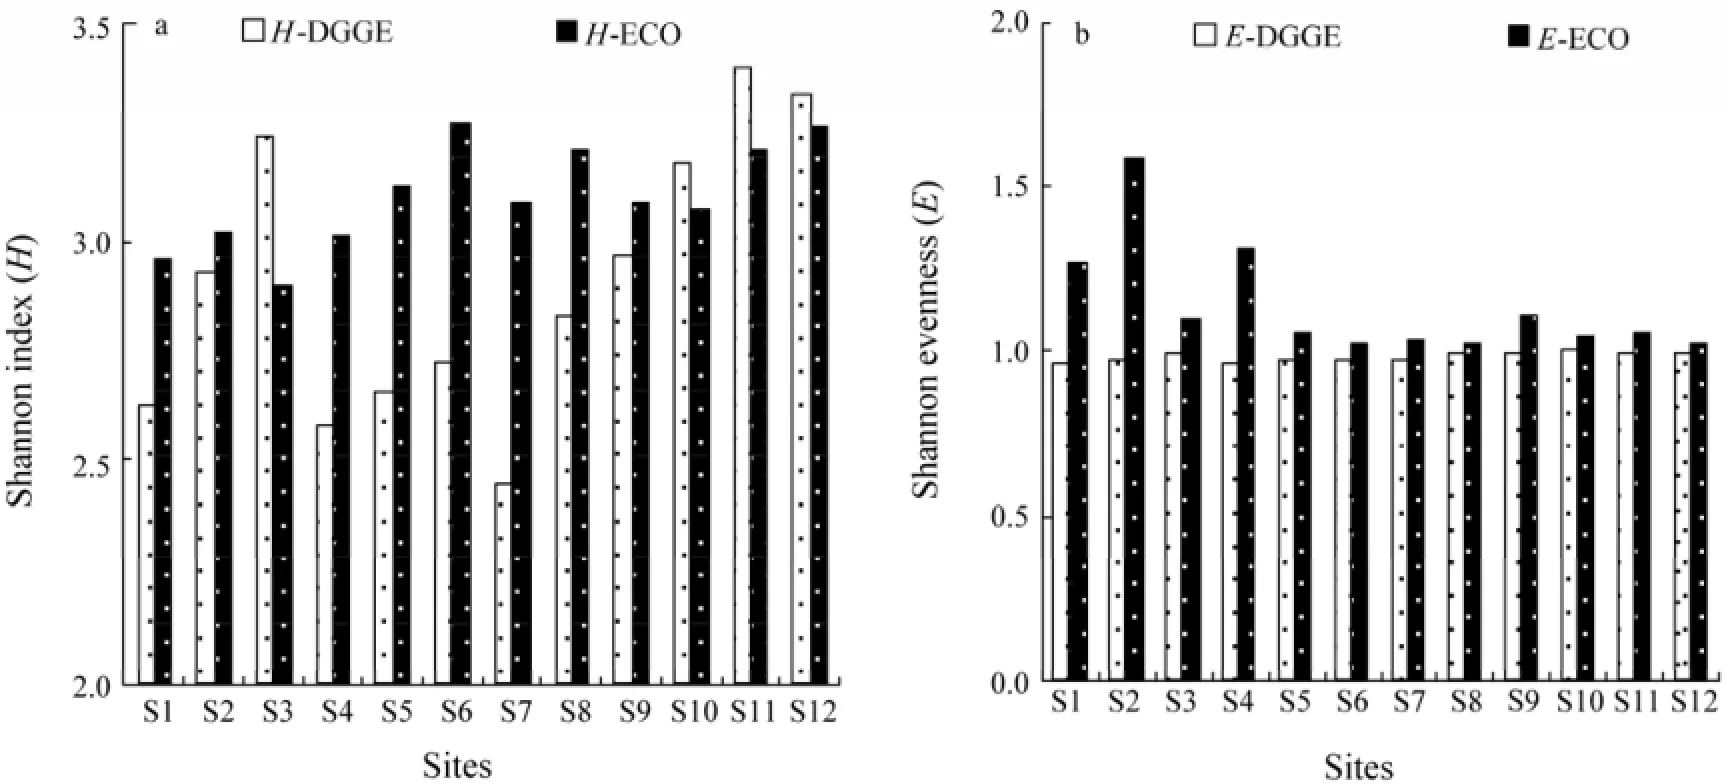
Fig.4 The diversity and evenness index of the bacterial community at 12 sampling sites based on DGGE and CLPP data. a, Shannon diversity index (H); H-DGGE, H of bacterial community in sampling sites based on DGGE data; H-ECO, H of bacterial community based on CLPP data; b, Shannon evenness index (E); E-DGGE, E of bacterial community at sampling sites based on DGGE data; E-ECO, E of bacterial community based on CLPP data.
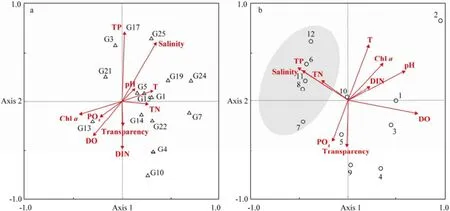
Fig.5 Redundancy analysis (RDA) ordination of data from denaturing gradient gel electrophoresis (DGGE) and community-level physiological profiling (CLPP). a, RDA ordination of DGGE data, in which triangles and numbers indicate dominant bacteria and arrows indicate environmental variables; b, RDA ordination of CLPP data, in which circles and numbers indicate sampling sites and arrows indicate environmental variables.
4 Discussion
The impacts of aquaculture on environment are evident. It is estimated that approximately 80% and 75% of input fish food carbon and nitrogen in a fish cage aquaculture are respectively released to the aquatic environment (Hall et al., 1992). Over-development of aquaculture without considering the environment may cause eutrophication, pollution and oxygen depletion of coastal waters (Troell et al., 2003). Bacteria in seawater are considered acting on the increased organic matters loaded from fish farms or sewage (Paerl et al., 2003), which provide sensitive, meaningful and quantifiable indications of ecological changes (Sakami et al., 2007). Therefore, a comprehensive characterization of bacterial community is an important mean of assessing the effect of aquaculture and anthropogenic activity on environment.
CLPP is an approach of characterizing microbial community function based on the sole carbon source utilization pattern (Weber and Legge, 2010), which provides data of the metabolic characteristics and overall stability of a specific microbial community over time (Weber and Legge, 2011). In the present study, CLPP data showed that the core mariculture area (S6, S7 and S8) and the area associated with human activity and sewage discharge (S11 and S12) had higher microbial metabolic capability and diversity than others. The AWCD and Shannon index value at S6, S12, S11, S7 and S8 were higher than those at other sites. Lee et al. (2010) considered that more heterotrophic bacteria should have higher microbial activity detected by aerobic Eco-plates. Interestingly, the diversity indices calculated from both DGGE and CLPP data were higher at S11 and S12 (H>3.2) thanat other sites, indicating that sewage discharge possibly increases water nitrogen and phosphorus nutrient (Table 1), thus stimulates the growth of microorganisms and their activity. Moreover, there was a breakwater between S8 and S9 as well as between S10 and S11. These four sites (S7, S8, S11 and S12) located inside an artificial dam with shallower water depths and lower DO content than other sites. Due to the presence of breakwater, water exchange was poor at S7, S8, S11 and S12 in comparison with other sites. Thus, the nutrients accumulate easy in waters beside the breakwater. As expected, the highest concentration of TN and TP were recorded at S11 and S12.
The bacterial community structure detected by CLPP at S6, S8, S11 and S12 was greatly influenced by TP, salinity and TN (Fig.5b). As a major nutrient for aquatic ecology, phosphorus is recognized as the most critical nutrient that limits the productivity (Jin et al., 2005). Yuan et al. (2011) reported that phosphorus regulate primary and bacterial production, being a potential limiting nutrient in Pearl River water. It is clear that estuaries are subjecting to the dual impact of freshwater and seawater. Thus, the difference in microbial distribution pattern between sampling sites may be attributed to the difference of ambient environments. Environmental factors may play an important role in controlling the restructure of a bacterial community (Sun et al., 2012).
DGGE fingerprinting showed that proteobacteria, especially γ- and α-proteobacteria, was dominant in the studied area. The dominance of proteobacteria in Pearl River estuary was consistent with the reported early (Du et al., 2011). These findings indicated that this group of bacteria played a critical role in biogeochemical cycling of nitrogen and phosphorus in marine environments (Sun et al., 2012). The most dominant bacterial genus, Pseudoalteromonas, was previously found to be the most representative obligate marine bacteria comprising of numerous clusters (Yoza et al., 2007). Competitive survival pressure in diverse environments has promoted the evolution of numerous metabolic pathways in this genus (Kalinovskaya et al., 2004).
In conclusions, this study revealed that bacterial community in mariculture area and where affected by humans was higher in metabolic capability and diversity than others, and the structure and composition of bacterial communities were closely related to the level of water phosphorus, salinity and nitrogen.
Acknowledgements
We thank Dr. Yangguang Gu of Jinan University for the assistances in sample collection and data processing. This research was supported by the Support Project of Science and Technology of China (Grant No. 2012BAD18B01), Special Fund for Agro-scientific Research in the Public Interest (201403008) and the Natural Science Foundation of China (Grant Nos. U1301235, 41173079), special scientific research funds for central non-profit institutes, South China Sea Fisheries Research Institute, Chinese Academy of Fishery Sciences (2014TS04).
Cook, P., Veuger, B., B?er, S., and Middelburg, J. J., 2007. Effect of nutrient availability on carbon and nitrogen incorporation and flows through benthic algae and bacteria in nearshore sandy sediment. Aquatic Microbial Ecology, 49: 165-180.
Du, J. K., Xiao, K., Huang, Y. L., Li, H. X., Tan, H. M., Cao, L. X., Lu, Y. J., and Zhou, S. N., 2011. Seasonal and spatial diversity of microbial communities in marine sediments of the South China Sea. Antonie van Leeuwenhoek, 100: 317-331.
Garland, J. L., and Mills, A. L., 1991. Classification and characterization of heterotrophic microbial communities on the basis of patterns of community-level, sole-carbon-source utilization. Applied Environment Microbiology, 57: 2351-2359.
GB/T 12763.4-2007. Specifications for oceanographic survey-Part 4: Survey of chemical parameters in sea water. National Standards of the P. R. China.
González, J. M., Simó, R., Massana, R., Covert, J. S., Casamayor, E. O., Pedrós-Alió, C., and Moran, M. A., 2000. Bacterial community structure associated with a dimethylsulfoniopropionate-producing North Atlantic algal bloom. Applied Environment Microbiology, 66: 4237-4246.
Hall, P. O. J., Holby, O., Kollberg, S., and Samuelsson, M. O., 1992. Chemical fluxes and mass balances in a marine fish cage farm. IV. Nitrogen. Marine Ecology Progress Series, 89: 81-91.
Jin, X., Wang, S., Pang, Y., Zhao, H., and Zhou, X., 2005. The adsorption of phosphate on different trophic lake sediments. Colloids and Surfaces A, 254: 241-248.
Kalinovskaya, N. I., Ivanova, E. P., Alexeeva, Y. V., Gorshkova, N. M., Kuzentsova, T. A., Dmitrenok, A. S., and Nicolau, D. V., 2004. Low molecular weight biologically active compounds from marine Pseudoalteromonas species. Current Microbiology, 48: 441-446.
Kirk, J. L., Klironomos, J. N., Lee, H., and Trevors, J. T., 2005. The effects of perennial ryegrass and alfalfa on microbial abundance and diversity in petroleum contaminated soil. Environmental Pollution, 133: 455-465.
Lee, E. H., Kim, J., Kim, J. Y., Koo, S. Y., Lee, S. D., Ko, K. S., Ko, D. C., Yum, B. Y., and Cho, K. S., 2010. Comparison of microbial communities in petroleum-contaminated groundwater using genetic and metabolic profiles at Kyonggi-Do, South Korea. Environmental Earth Sciences, 60: 371-382.
Lorenzen, C. J., 1967. Determination of chlorophyll and pheopigments: Spectrophotometric equations. Limnology and Oceanography, 12: 343-346.
Moss, A., and Bassall, M., 2006. Effects of disturbance on the biodiversity and abundance of isopods in temperature grasslands. European Journal of Soil Biology, 42: S254-S268.
Muyzer, G., De-Waal, E. C., and Uitterlinden, A. G., 1993. Profiling of complex microbial populations by denaturing gradient gel electrophoresis analysis of polymerase chain reaction-amplified genes coding for 16S rRNA. Applied Environment Microbiology, 59: 695-700.
Paerl, H., Dyble, J., Twomey, L., Pinckney, J., Nelson, J., and Kerkhof, L., 2002. Characterizing man-made and natural modifications of microbial diversity and activity in coastal ecosystems. Antonie van Leeuwenhoek, 81: 487-507.
Paerl, H. W., Dyble, J., Moisander, P. H., Noble, R. T., Piehler, M. F., Pinckney, J. L., Steppe, T. F., Twomey, L., and Valdes,L. M., 2003. Microbial indicators of aquatic ecosystem change: Current applications to eutrophication studies. FEMS Microbiology Ecology, 46: 233-246.
Sakami, T., Abo, K., and Takayanagi, K., 2007. Microbial activity and community structure in a net pen aquaculture area. Bulletin of Fisheries Research Agency, 19: 53-68.
Sala, M. M., Balagué, V., Pedrós-Alió, C., Massana, R., Felipe, J., Arin, L., Illoul, H., and Estrada, M., 2005. Phylogenetic and functional diversity of bacterioplankton during Alexandrium spp. Blooms. FEMS Microbiology Ecology, 54: 257-267.
Song, H., Li, Z., Du, B., Wang, G., and Ding, Y., 2011. Bacterial communities in sediments of the shallow Lake Dongping in China. Journal of Applied Microbiology, 112: 79-89.
Sun, F. L., Wang, Y. S., Wu, M. L., Wang, Y. T., and Qian, P. L., 2012. Spatial and vertical distribution of bacteria in the Pearl River estuary sediment. African Journal of Biotechnology, 11: 2256-2266.
Ter Braak, C. J. F., and ?milauer, P., 2002. CANOCO reference manual and CanoDraw for Windows user’s guide: Software for canonical community ordination (version 4.5). Microcomputer Power, Ithaca, New York.
Troell, M., Hallling, C., Neori, A., Chopin, T., Buschmann, A. H., Kautsky, N., and Yarish, C., 2003. Integrated mariculture: Asking the right questions. Aquaculture, 226: 69-90.
Weber, K. P., and Legge, R. L., 2010. Community-level physiological profiling. In: Bioremediation: Methods in Molecular Biology. Vol. 599. Cummings, S. P., ed., Humana Press, New York, 263-281.
Weber, K. P., and Legge, R. L., 2011. Dynamics in the bacterial community-level physiological profiles and hydrological characteristics of constructed wetland mesocosms during start-up. Ecological Engineering, 37: 666-677.
Wu, Z. J., Zhou, H. Y., Peng, X. T., Jia, N., Wang, Y. H., and Yuan, L. X., 2008. Anaerobic oxidation of methane in coastal sediment from Guishan Island (Pearl River Estuary) South China Sea. Journal of Earth System Science, 117: 935-943.
Yoza, B. A., Harada, R. M., Nihous, G. C., Li, Q. X., and Masytani, S. M., 2007. Impact of mariculture on microbial diversity in sediments near open ocean farming of Polydactylus sexfilis. Ecological Indicators, 7: 108-122.
Yuan, X. C., Yin, K. D., Harrison, P., He, L., and Xu, J., 2011. Variations in apparent oxygen utilization and effects of P addition on bacterial respiration in subtropical Hong Kong waters. Estuaries and Coasts, 34: 536-543.
(Edited by Qiu Yantao)
(Received March 4, 2013; revised May 22, 2013; accepted May 4, 2014)
? Ocean University of China, Science Press and Spring-Verlag Berlin Heidelberg 2014
? Corresponding author. Tel: 0086-20-85221397
E-mail: tyyf@jnu.edu.cn
 Journal of Ocean University of China2014年5期
- Journal of Ocean University of China的其它文章
- Identification of Fucans from Four Species of Sea Cucumber by High Temperature1H NMR
- The Appearance of Ulva laetevirens (Ulvophyceae, Chlorophyta) in the Northeast Coast of the United States of America
- Distribution and Source of Main Contaminants in Surface Sediments of Tidal Flats in the Northern Shandong Province
- Analgesis and Wound Healing Effect of Chitosan and Carboxymethyl Chitosan on Scalded Rats
- Histological Observation of Germ Cell Development and Discovery of Spermatophores in Ovoviviparous Black Rockfish (Sebastes schlegeli Hilgendorf) in Reproductive Season
- Identification of Five Sea Cucumber Species Through PCR-RFLP Analysis
