Analysis on characteristics of aerosol absorption and scattering over Zhangye, China
XianJie Cao, Lei Zhang, Jing Bao, Xia Li, Bi Zhou
Key Laboratory for Semi-Arid Climate Change of the Ministry of Education, College of Atmospheric Sciences, Lanzhou University, Lanzhou, Gansu 730000, China
Analysis on characteristics of aerosol absorption and scattering over Zhangye, China
XianJie Cao, Lei Zhang, Jing Bao, Xia Li, Bi Zhou
Key Laboratory for Semi-Arid Climate Change of the Ministry of Education, College of Atmospheric Sciences, Lanzhou University, Lanzhou, Gansu 730000, China
The first China-US joint dust field experiment was carried out by Lanzhou University, Chinese Academy of Sciences, China Meteorological Administration, and University of Maryland, the Department of Energy (DOE), USA, from April to June, 2008. The observation sites are located at Zhangye National Climatological Observatory, Semi-Arid Climate and Environment Observatory of Lanzhou University (SACOL), and Jingtai with the Mobile Facilities of SACOL. The measurements of Particle Soot Absorption Photometer and TSI Integrating Nephelometer are used to analyze the aerosol absorption and scattering characteristics over Zhangye. The results are: the aerosol absorption, total scattering, and backscattering coefficients present similar diurnal variation trends with their bi-peaks at 08:00 and 22:00, and they are generally higher in nighttime than in daytime. Their monthly average coefficient is the highest in April, and then drops in succession in May and June. Frequency analysis of aerosol single scattering albedo (SSA) shows that the magnitudes of SSA at 450, 550, and 700 nm are mainly within 0.7-0.9. The maximum frequency of SSA at 450 and 700 nm distribute at 0.8, and at 0.85 for 550 nm. The averages of SSA at 450, 550, and 700 nm are 0.72, 0.75, and 0.68, respectively.
aerosol; scattering; absorption; SSA; 2008 China-US joint dust field experiment
1. Introduction
Aerosols directly affect the radiation budget of the Earth and Atmospheric systems by scattering and absorbing solar radiation (McCormick and Ludwig, 1967), and indirectly by increasing cloud albedo and suppressing precipitation through modifying cloud microphysical properties as cloud condensation nuclei (Twomey, 1977). The direct aerosol absorption of solar radiation will evaporate low layer clouds(Grassl, 1975), and the existence of aerosols could evidently reduce the surface radiation condition (Xiet al., 2002; Shaoet al., 2009). The aerosol radiative effect is one of the most important uncertainties in climate research due to its drastic temporal and spatial distributions and heterogeneous chemical composition.
Numerous field experiments have been carried out all over the world, such as the Radiation, Aerosol and Cloud Experiment (RACE) in North America, ACE-I in Oceania,ACE-II in Europe and Africa, the Aerosol Characterization Experiments over Asia (ACE-Asia), and the Indian Ocean Experiment (INDOEX).In China much progress also has been achieved. Huet al.(2003, 2005) studied aerosol scattering characteristics and its relationship with air pollution using measurements of integrating nephelometer, multi-wavelength photometer and PM10monitor, and presented good correlation between scattering coefficient and PM10concentration. Similar research has been accomplished in Taiyuan (Menget al., 2007), Shangdianzi background station (Xuet al., 2008), Xilinhot observatory (Zhanget al.,2008), Zhangbei and Minqin meteorological stations (Yanet al., 2008). The widely used method of retrieving aerosol absorption properties is using the black carbon measurement,providing the mass concentration of black carbon. The variation characteristics of black carbon are analyzed (Gaoet al.,2009; Taoet al., 2009; Zhanget al., 2009), and then the absorption coefficient. Meanwhile, using a numerical model on spatial distribution of black carbon, its radiative forcing(Zhuanget al., 2009) and impact on Asian summer monsoon(Wanget al., 2009) can be simulated.
The first China-US joint dust field experiment was carried out by Lanzhou University, Chinese Academy of Sciences,China Meteorological Administration, and University of Maryland, the Department of Energy (DOE), USA, from April to June, 2008. The observation sites are located at the Zhangye National Climatological Observatory (39.08°N, 100.27°E,1,461 m a.s.l.), the Semi-Arid Climate and Environment Observatory of Lanzhou University (SACOL, 35.95°N,104.13°E, 1,965 m a.s.l.), and Jingtai (37.35°N, 104.01°E,1,604 m a.s.l.) with the Mobile Facilities of SACOL, of which the Zhangye observatory was commissioned by the Atmospheric Radiation Measurement (ARM) Program of DOE with SMART-COMMIT, SACOL and the Jingtai mobile facilities was by the college of Atmospheric Sciences, Lanzhou University. With the collection of advanced measurements, the joint dust field experiment constructed the dust monitoring network in the Hexi Corridor, with the purpose of better understanding the formation mechanism and transportation of dust, and its impact on climate change.
The Gravel Gobi is the dominant substrate underlying the Zhangye observatory, with a habitat of scattered poplar grooves, which represents the upstream dust transportation path in the joint dust field experiment. Studies of absorption and scattering characteristics over the Zhangye region will contribute to better understanding of the radiative characteristics of aerosols.
2. Measurements and data
2.1. Particle Soot Absorption Photometer
In the joint dust field experiment, the aerosol light absorption coefficient was measured by a Particle Soot Absorption Photometer (PSAP) at 470, 522, and 660 nm, based on the integrating plate technique and Beer’s Law, in which the optical transmission change of filter is related to the light absorption coefficient of particles deposited on the filter,while the filter transmittance significantly impacts retrieval of absorption coefficient, especially when it is rather small.In the field experiment, the threshold transmittance to change filter is set to 0.6. Meanwhile, a reference filter is placed adjacent to the primary filter, and the sample flow first passes through the primary filter which removes particles, and then the clean airstream passes through the reference filter, to ensure the observed change in filter transmittance is not due to intensity changes of the light source. Then spot size correction, scattering aerosol correction, and flow calibration are applied to the data. As to the scattering aerosol correction, PSAP uses fiber filters which allow particles to become partly or completely embedded in an optically diffusive environment to minimize sensitivity to backscattering; also the absorption measurement may induce error response to non-absorbing particles, which could be corrected by using multiple linear regression. This method takes the non-absorption particles effect as an independent variable, or simply by measuring the response of non-absorbing salt such as ammonium sulfate or sodium chloride. Appling the ratio of scattering in absorption measurement whenever simultaneous light scattering is available, the impact of scattering could be further corrected (Bondet al., 1999). Data resolution of PSAP is 1 s.
2.2. TSI integrating nephelometer
Based on the Beer-Lambert Law, the integrating nephelometer 3563 (TSINeph) measures aerosol light scattering coefficients at 450, 550, and 700 nm, of which the angular integration for total scattering is 7°-170° and 90°-170° for backscattering. The Rayleigh scattering and PMT dark current are subtracted from the total scattering and backscattering. For ideal conditions, the angular integration for total scattering is 0°-180°, and 90°-180° for backscattering measurement, so TSINeph measurement truncation error exists to a certain degree (Andersonet al., 1996; Anderson and Ogren, 1998). Generally, the truncation error is calculated using the Mie theory. As to large particles, forward truncation error is calculated using geometric optics and diffraction theory. For small truncation angles (i.e., <10°), diffraction theory is sufficient (Moosmüller and Arnott, 2003).
TSINeph is calibrated before the joint dust field experiment, including high span and low span calibration respectively using CO2and clean air as sample flow. Data resolution of TSINeph is 5 min.
3. Results
3.1. Diurnal change of aerosol absorption coefficient
Seen from the total sky imager measurement, full sun was dominant during the field experiment, with scattered thin cirrus clouds in the morning and sunset on April 29; on May 18 there was thin cirrus clouds at sunset; there was clear skies all day on June 3, 2008; visibility was near 10 km for these three days. In this paper, these three days are chosen to analyze the diurnal changes of aerosol absorption coefficients.
Presented in Figure 1, the aerosol absorption coefficients show characteristics of diurnal changes with bi-peaks at 08:00(Beijing Time) and 22:00. April 29 is a bit different from other two days mainly during 00:00-05:00 where aerosol absorption coefficient reaches a maximum at 01:00 and then decreases with time, but on May 18 and June 3 the coefficients increase with time and reach the maximums at 08:00.
The peak at 08:00 is chiefly due to enhancement of emission from industries, vehicular transportation, and daily anthropogenic activity, meanwhile the diffusion condition is unfavorable. Then the aerosol absorption coefficients decreases with time and remains at a low value range with small variation amplitude during 12:00-20:00, which is mainly caused by strong development of planetary boundary layer and convection in the afternoon which leads to better diffusion conditions. After 20:00 the aerosol absorption coefficient increases again and reaches to the second peak at 22:00, which is related to reduction of solar radiation after sunset and then to the formation of surface inversion layer.While a peak exists at 01:00 on April 29, the reason is not exactly known, which should be explained in the future in combination with other observations.
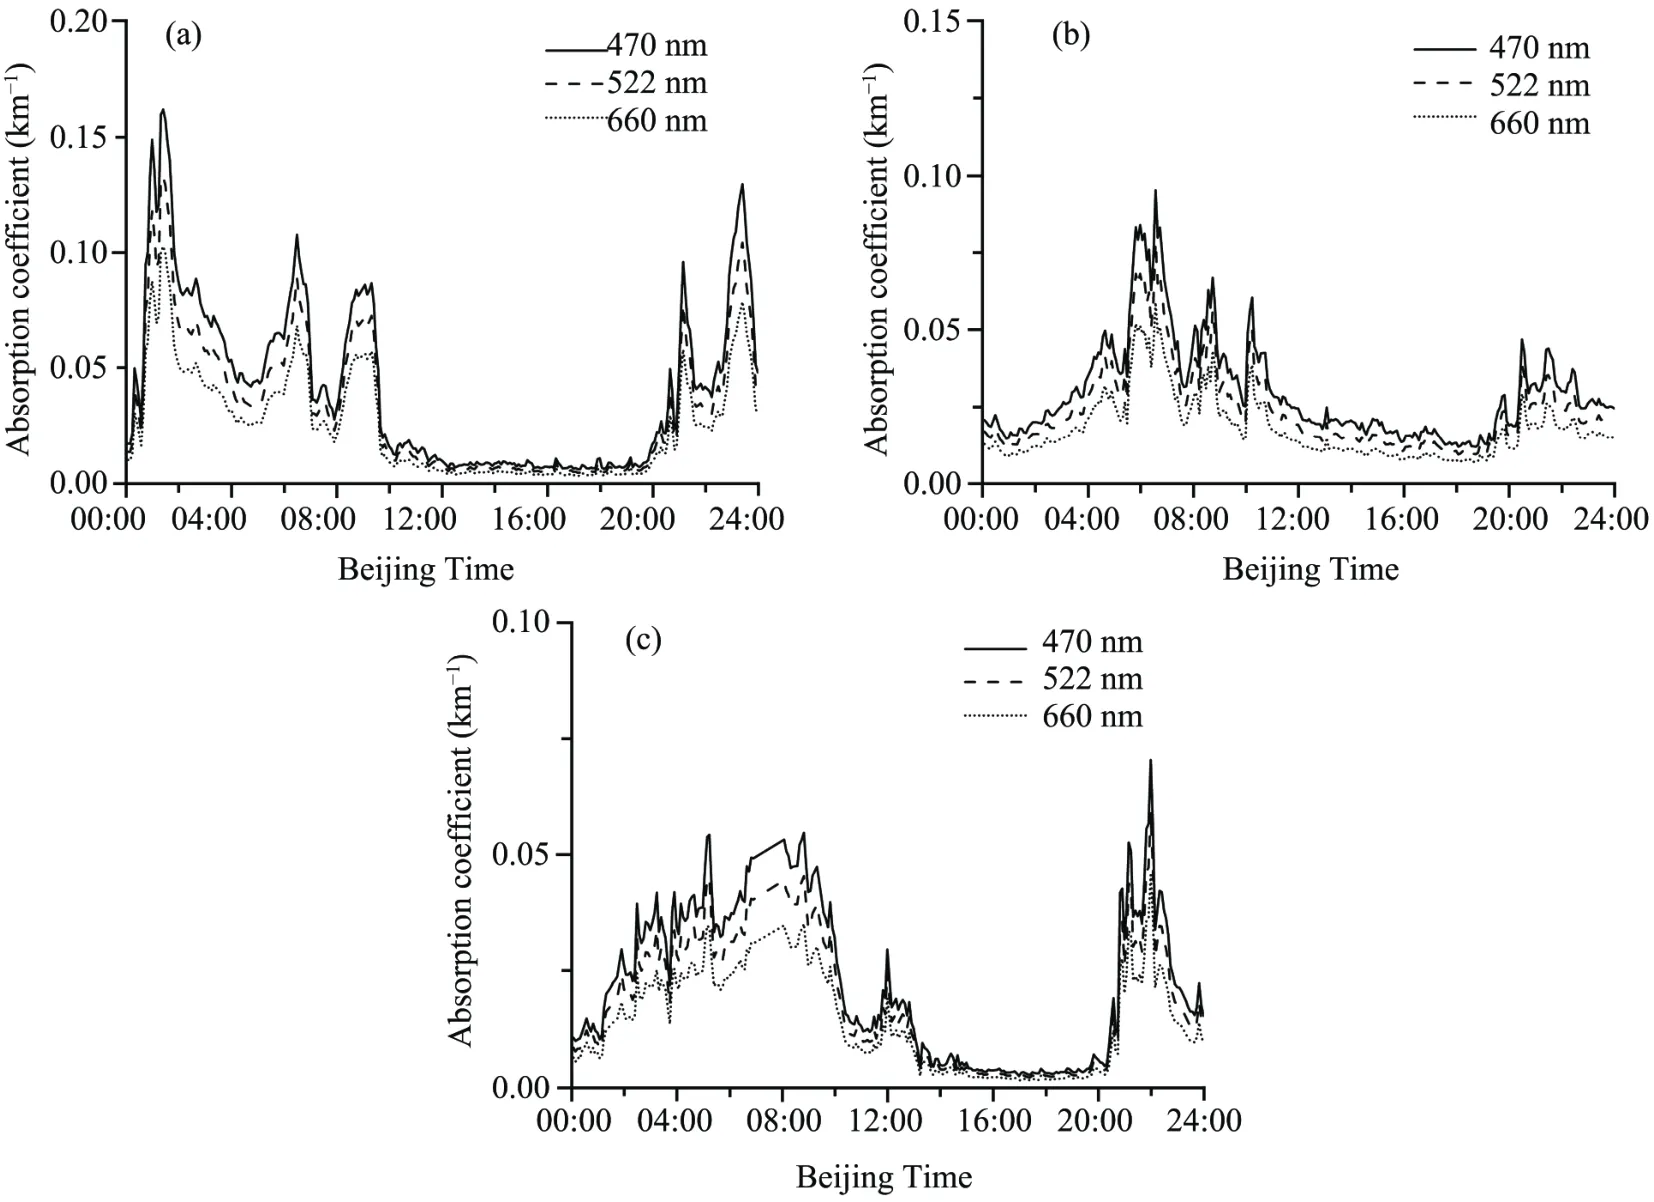
Figure 1 Diurnal changes of aerosol absorption coefficients on (a) April 29, (b) May 18, and (c) June 3, 2008
3.2. Diurnal changes of aerosol total scattering and backscattering coefficients
Figures 2 and 3 show diurnal changes of aerosol total scattering and backscattering coefficients at 450, 550, and 700 nm respectively on April 29, May 18, and June 3, 2008 with bi-peaks at 08:00 and 22:00. Beside these two peaks,there is also a peak at 01:00 on April 29. Comparing Figures 2 and 3, the aerosol total scattering and backscattering coefficients have similar diurnal change patterns; the ratio of backscattering to total scattering coefficient is rather small,about 15%. Integrating Figures 1, 2, and 3, measurements of PSAP and TSINeph show similar diurnal changes.
3.3. Diurnal changes of monthly average for aerosol absorption, total scattering, and backscattering coefficients
Presented in Figure 4, the diurnal changes of monthly average for aerosol absorption coefficients at 470, 522, and 660 nm are consistent and show characteristic bi-peaks at 08:00 and 22:00, which agree with the above analysis. As to April, 02:00 is also a peak time, which coincided with the diurnal change of aerosol absorption coefficient on April 29. On May 18 at 04:00, there is a small peak in the diurnal change of aerosol absorption coefficient, and in June the monthly average of aerosol absorption coefficient shows typical bi-peak characteristics. Comparing the diurnal changes of monthly average aerosol absorption coefficients in April, May, and June, their variation trends are similar during 06:00-24:00, while slightly different during 00:00-06:00.
Their average monthly coefficient is the highest in April,and then drops in succession in May and June. The differences mainly exist during nighttime, while rather small in daytime,which is probably caused by pollution emission and diffusion conditions. Municipal integrating heating ends in April, while residential heating still continues to a certain degree, mainly at night, resulting in higher pollution emission. In daytime, due to relatively stable pollution emission and more favorable diffusion conditions, the differences among monthly average aerosol absorption coefficients in April, May, and June are very small. The smallest monthly average aerosol absorption coefficient in June is possibly caused by smaller quantities of pollution emission and better diffusion conditions.

Figure 2 Diurnal changes of aerosol total scattering coefficients on (a) April 29, (b) May 18, and (c) June 3, 2008
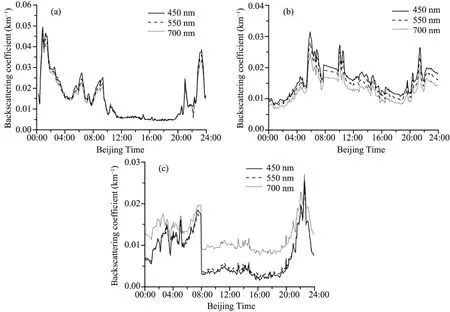
Figure 3 Diurnal changes of aerosol backscattering coefficients on (a) April 29, (b) May 18, and (c) June 3, 2008
Figure 5 shows the diurnal changes of monthly average of aerosol total scattering coefficients at 450, 550, and 700 nm, while Figure 6 is for backscattering coefficients. The variation trends of total scattering coefficients at 450, 550,and 700 nm are very similar showing characteristic bi-peaks at 08:00 and 22:00, which are similar for the backscattering coefficients. In addition, the monthly average for aerosol total scattering and backscattering coefficients in April and June reach maximums at 02:00, while at 04:00 for May.Comparing the variation changes of monthly average for aerosol total scattering and backscattering coefficients, they have rather good agreement.
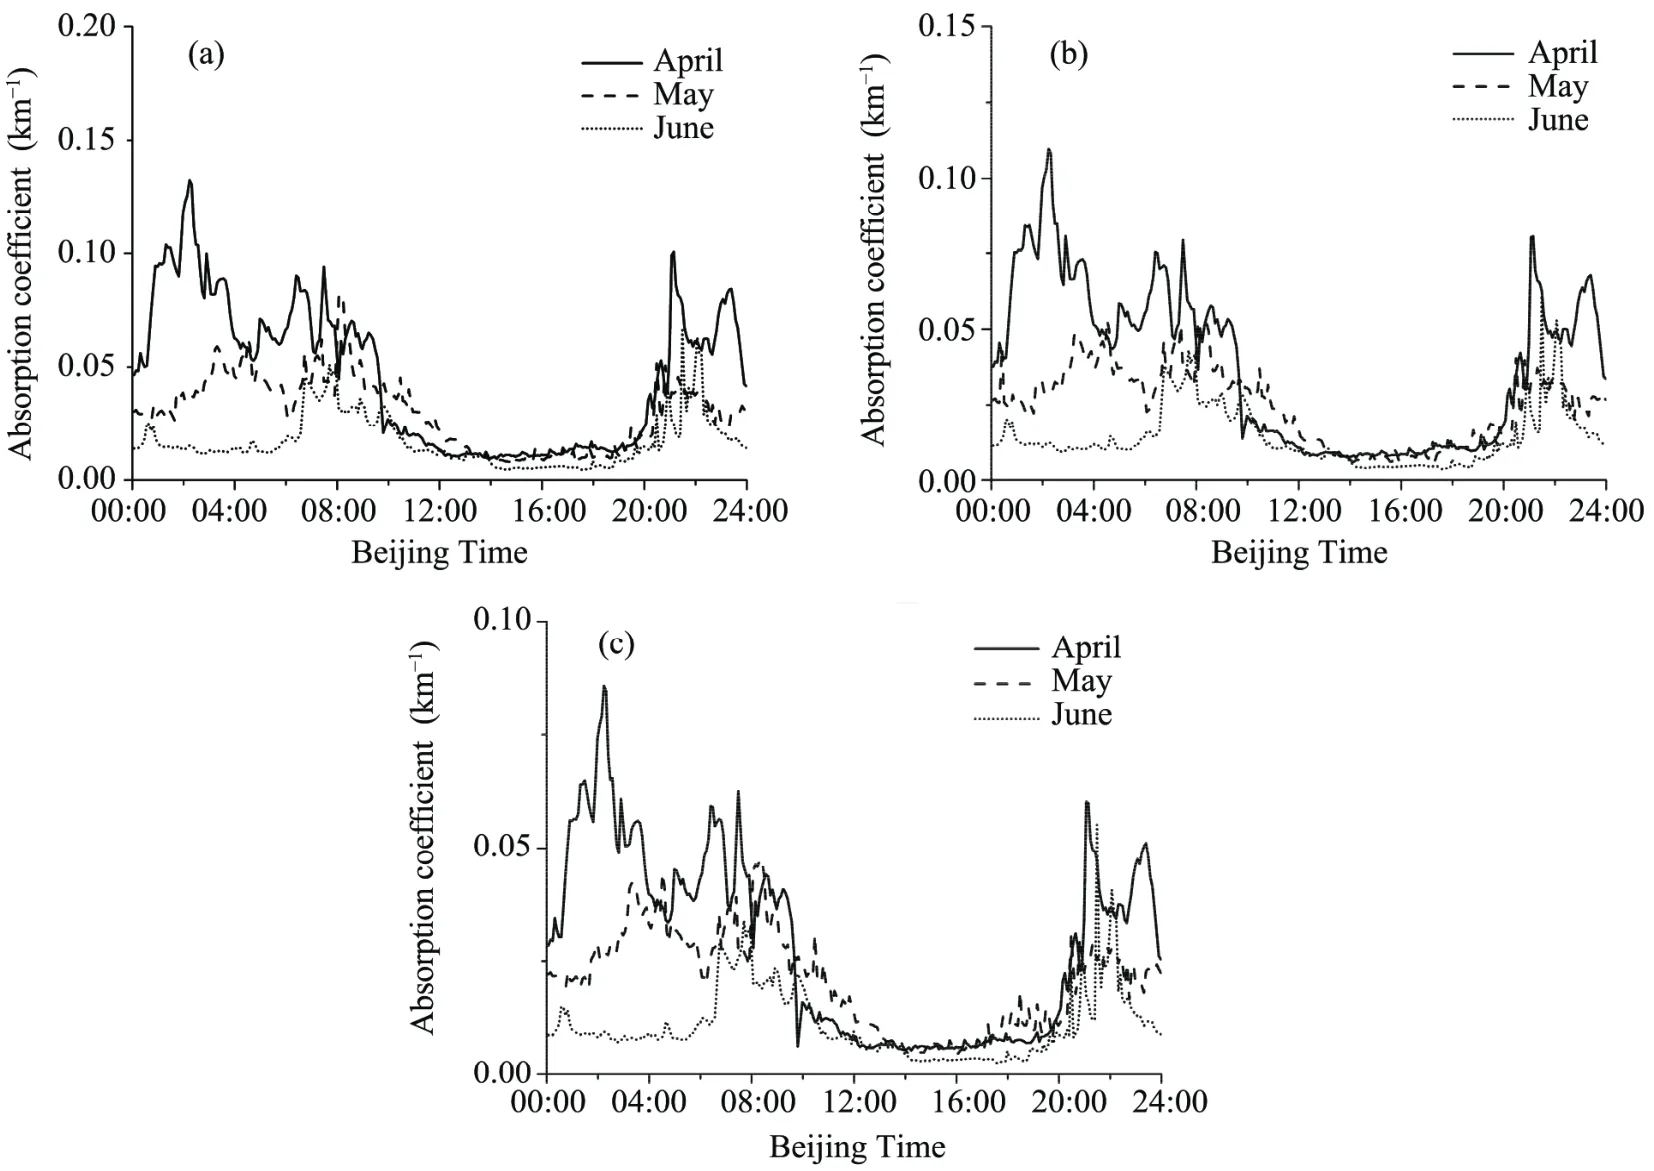
Figure 4 Diurnal changes of monthly average aerosol absorption coefficients at (a) 470 nm, (b) 522 nm, and (c) 660 nm
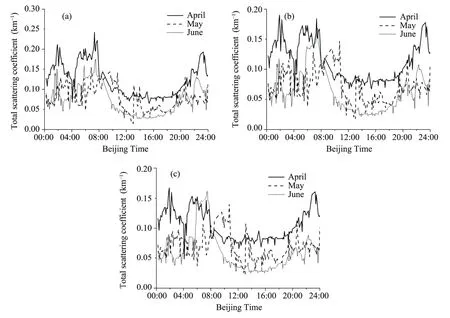
Figure 5 Diurnal changes of monthly average aerosol total scattering coefficients at (a) 450 nm, (b) 550 nm, and (c) 700 nm
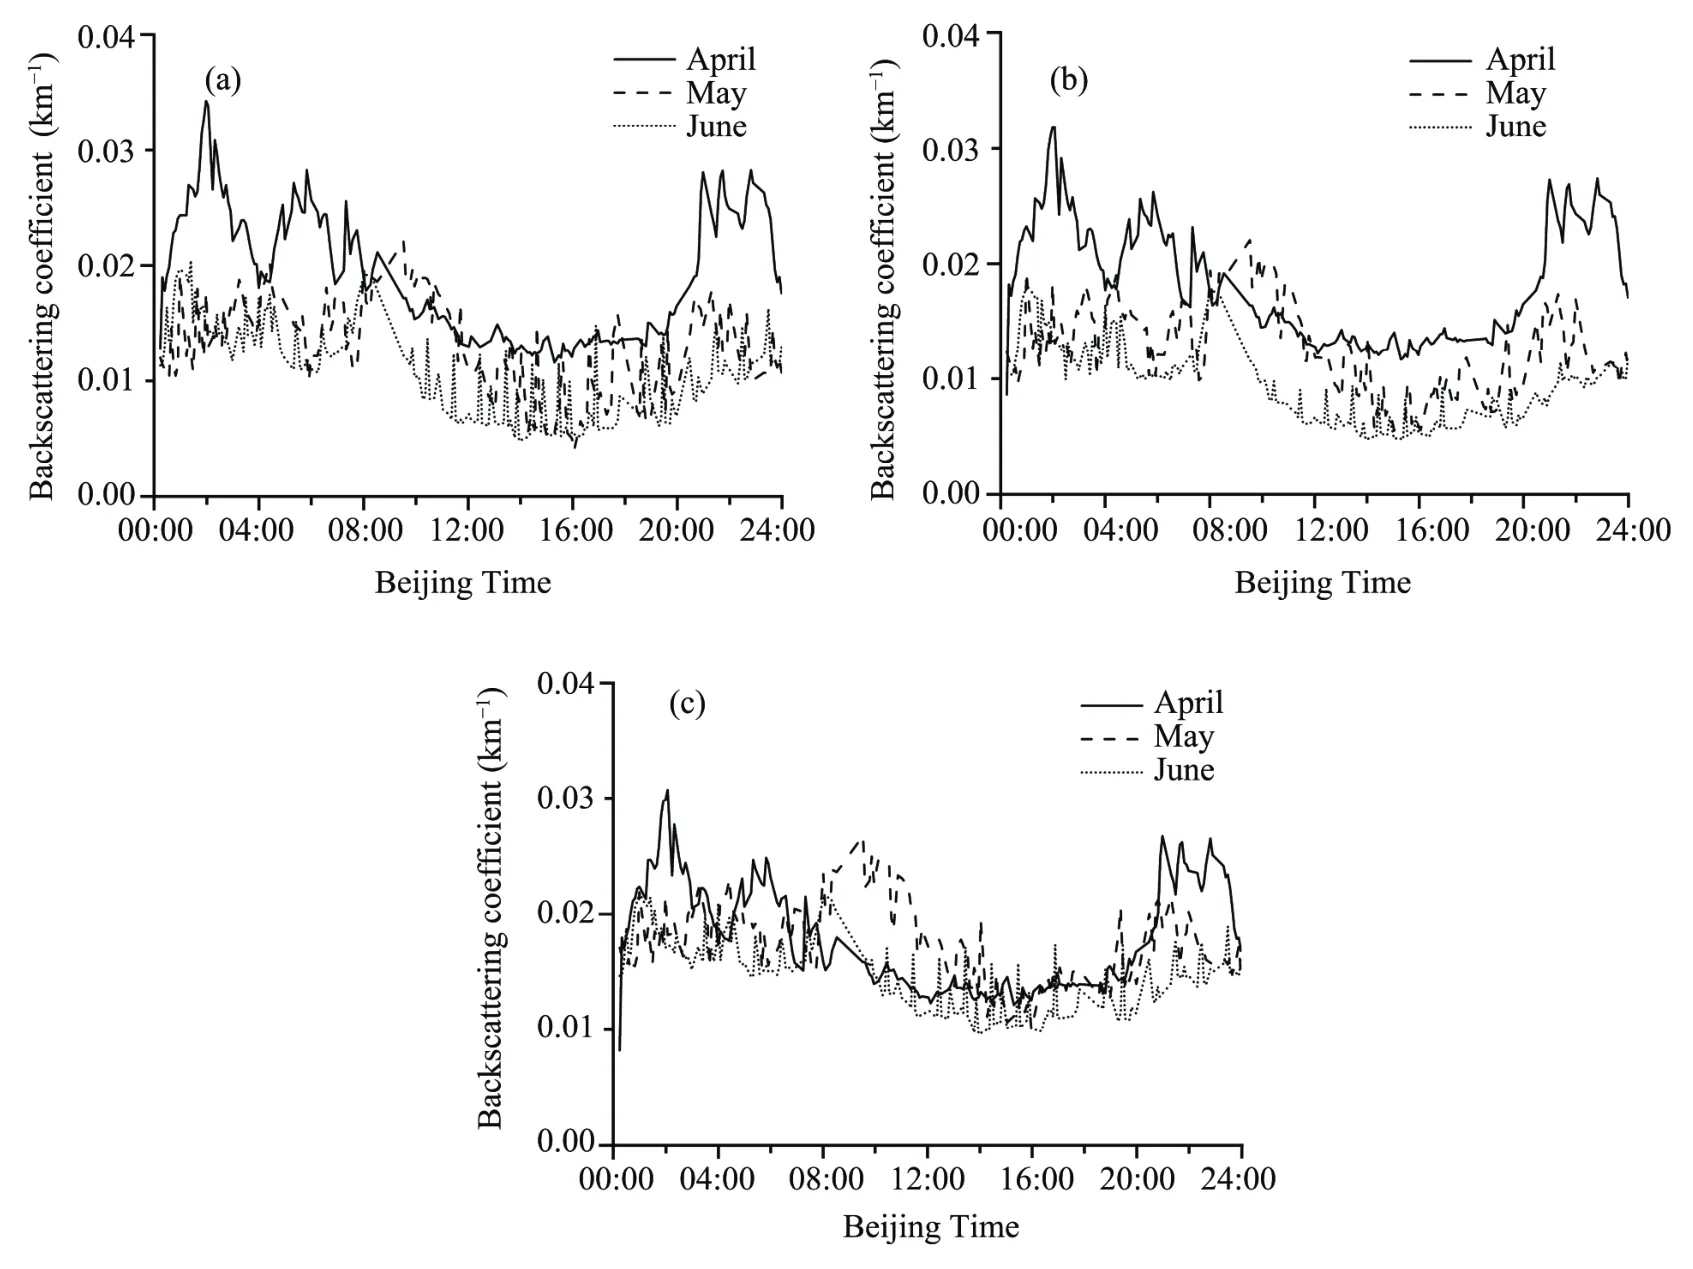
Figure 6 Diurnal changes of monthly average aerosol backscattering coefficients at (a) 450 nm, (b) 550 nm, and (c) 700 nm
Seen from the variation trends of monthly average for aerosol absorption, total scattering, and backscattering coefficients, they are reciprocally consistent; due to better pollution diffusion conditions, their values are smaller in daytime.
3.4. Day by day changes of daily average aerosol absorption, total scattering and backscattering coefficients
The day by day change of daily average aerosol absorption coefficient (presented in Figure 7a) shows a slightly decreasing variation trend, which is consistent with the aforementioned analysis that the monthly average coefficient for aerosol absorption is the largest in April, and then drops in succession in May and June. The average of aerosol absorption coefficients at 470, 522, and 660 nm during the field experiment are 0.0605, 0.0379, and 0.0315 km-1, respectively.
Figures 7b and 7c respectively show the day by day changes of daily average aerosol total scattering and backscattering coefficients. The day by day variation trends are rather rough, but the variation trends of total scattering and backscattering coefficients are very consistent. The average of aerosol total scattering coefficients at 450, 550, and 700 nm during the field experiment are 0.1269, 0.1101, and 0.0971 km-1; 0.0187,0.0175, and 0.0184 km-1for the corresponding backscattering coefficients.
3.5. Frequency analysis of single scattering albedo

Figure 8 presents the frequency histogram of SSA at 450,550, and 700 nm, and obviously SSA ranges mostly from 0.7-0.9, and relatively less in the >0.9 or <0.5 range. The maximum frequency of SSA at 450 and 700 nm distributes at 0.8, and at 0.85 for 550 nm. The averages of SSA at 450,550, and 700 nm are 0.72, 0.75, and 0.68, respectively. SSA at 450 and 550 nm ranges from 0.7-0.9, with proportions of 62.0% to 73.3%, while SSA at 700 nm ranges from 0.6-0.9,with a proportion of 67.7%.

Figure 7 Day by day changes of daily average (a) aerosol absorption, (b) total scattering, and (c) backscattering coefficients during the field experiment

Figure 8 Frequency histogram distribution of aerosol single scattering albedo
4. Conclusions
The first China-US joint dust field experiment was carried out at Zhangye National Climatological Observatory,Semi-Arid Climate and Environment Observatory of Lanzhou University (SACOL), and Jingtai with the Mobile Fa-cilities of SACOL during the period of April to June, 2008.With measurements of the Particle Soot Absorption Photometer and TSI Integrating Nephelometer, the characteristics of aerosol absorption and scattering over Zhangye are analyzed.
(1) The diurnal changes of aerosol absorption, total scattering, and backscattering coefficients present similar trends with their bi-peaks at 08:00 and 22:00. The peak at 08:00 is mainly induced by the enhancement of pollution emissions from industries, vehicular transportation, and daily anthropogenic activities with rather unfavorable diffusion conditions, while surface inversion layer and unfavorable diffusion conditions are the reasons for the peak at 22:00.
(2) The monthly average of aerosol absorption, total scattering, and backscattering coefficients are the highest in April, and then decrease in succession in May and June.
(3) The frequency analysis of aerosol single scattering albedo (SSA) shows that the magnitudes of SSA at 450, 550,and 700 nm are mainly within 0.7-0.9. The maximum frequency of SSA at 450 and 700 nm distribute at 0.8, and at 0.85 for 550 nm. The averages of SSA at 450, 550, and 700 nm are 0.72, 0.75, and 0.68, respectively.
The first China-US joint dust field experiment provided observational data for our research, and thanks are sincerely given to the field experiment staff for their hard and earnest work. The thesis is supported by the National Natural Science Foundation of China (41075104), and the Fundamental Research Funds for the Central Universities of Lanzhou University (lzujbky-2011-5).
Anderson TL, Covert DS, Marshall SF, Laucks ML, Charlson RJ, Waggoner AP, Ogren JA, Caldow R, Holm RL, Quant FR, Sem GJ, Wiedensohler A, Ahlquist NA, Bates TS, 1996. Performance characteristics of a high-sensitivity, three-wavelength total scatter/backscatter nephelometer.Journal of Atmospheric and Oceanic Technology, 13: 967-986.
Anderson TL, Ogren JA, 1998. Determining aerosol radiative properties using the TSI 3563 integrating nephelometer. Aerosol Science and Technology, 29: 57-69.
Bond TC, Anderson TL, Campbell D, 1999. Calibration and intercomparison of filter-based measurements of visible light absorption by aerosols. Aerosol Science and Technology, 30: 582-600.
Gao ZT, Zhang RJ, Su LX, 2009. Characteristic analysis of atmospheric black carbon aerosols in Changchun in autumn and winter. Plateau Meteorology, 28(4): 803-807.
Grassl H, 1975. Albedo reduction and radiative heating of clouds by absorbing aerosol particles. Contributions to Atmospheric Physics, 48:199-210.
Hu B, Zhang W, Zhang L, Chen CH, Feng GH, 2003. A study on scattering properties of aerosol particle over Xigu district of Lanzhou. Plateau Meteorology, 22(4): 354-360.
Hu B, Zhang J, Zhang W, Chen CH, Zhang L, 2005. A study of the properties of atmospheric aerosol over Lanzhou in winter and applications by using integrating nephelometer. Journal of Lanzhou University (Natural Sciences), 41(3): 19-25.
McCormick RA, Ludwig JH, 1967. Climate modification by atmospheric aerosols. Science, 156(3780): 1358-1389.
Meng ZY, Jiang XM, Yan P, Zhang HD, Wang Y, Lin WL, Yan SM, 2007.Characterization of aerosol scattering properties during winter in Taiyuan.Advances in Climate Change Research, 3(5): 255-259.
Moosmüller H, Arnott WP, 2003. Angular truncation errors in integrating nephelometry. Review of Scientific Instruments, 74(7): 3492-3501.
Shao ZY, Zhou T, Shi PJ, Gong DY, 2009. Spatial-temporal characteristics of the influence atmospheric pollutant on surface solar radiation changes for Chinese key cities. Plateau Meteorology, 28(5): 1105-1114.
Tao J, Zhu LH, Han JL, Zhang T, Chen LG, Xu ZC, 2009. Study on characteristics of black carbon aerosol pollution and preliminary exploration on its source in Guangzhou urban area during the winter. Environmental Monitoring in China, 25(2): 53-56.
Twomey S, 1977. Atmospheric Aerosols. Elevier, New York. 279-287.
Virkkula A, Ahlquist NC, Covert DS, Arnott WP, Sheridan PJ, Quinn PK,Coffman DJ, 2005. Modification, calibration and a field test of an instrument for measuring light absorption by particles. Aerosol Science and Technology, 39: 68-83.
Wang ZL, Zhang H, Guo PW, 2009. Effects of black carbon aerosol in south Asia on Asian summer monsoon. Plateau Meteorology, 28(2): 419-424.
Xi XX, Quan JN, Chen CH, Zhao XJ, 2002. Monitoring analysis of winter TSP over Chengguan district of Lanzhou and their effects on radiation.Plateau Meteorology, 21(4): 427-431.
Xu J, Zhang XL, Yan P, Ding GA, Xu XF, 2008. Observational study of aerosol extinction property during dust weather in background area. Meteorological Science and Technology, 36(6): 679-685.
Yan H, Jiao MY, Zhao LN, Zhang ZG, Niu RY, 2008. Characteristics of aerosol light-scattering and PM10concentration in north China. Plateau Meteorology, 27(4): 852-858.
Zhang QY, Niu SJ, Shen JG, Wang YS, Wu K, Wang M, Zhang KX, 2008.Observational study on aerosol scattering properties in semiarid area.Journal of Desert Research, 28(4): 755-761.
Zhang QY, Niu SJ, Shen JG, Wang YS, Wu K, Wang M, Zhang KX, 2009.Observational study on aerosol absorption properties in winter and spring in semiarid area. Journal of Desert Research, 29(1): 183-188.
Zhuang BL, Wang TJ, Li S, 2009. The first indirect radiative forcing of black carbon aerosol and its effect on regional climate of China. Plateau Meteorology, 28(5): 1095-1104.
10.3724/SP.J.1226.2011.00535
*Correspondence to: Dr. XianJie Cao, College of Atmospheric Sciences, Lanzhou University. No. 222, South Tianshui Road,Lanzhou, Gansu 730000, China. Email: caoxj@lzu.edu.cn
10 May 2011 Accepted: 15 July 2011
 Sciences in Cold and Arid Regions2011年6期
- Sciences in Cold and Arid Regions的其它文章
- Stress relaxation of warm frozen soil under drained or undrained conditions
- Research for length change of four seasons over China in recent 47 years
- Different characteristics of the structure of atmospheric boundary layer between dry and rainy periods overthe northern Tibetan Plateau
- Climatic changes have led to significant expansion of endorheic lakes in Xizang (Tibet) since 1995
- Characteristics of dynamic strain and strength of frozen silt under long-term dynamic loading
- Simulation and analysis of river runoff in typical cold regions
