Research for length change of four seasons over China in recent 47 years
ZhenYan Yu , GuangZhou Fan , Wei Hua , DingWen Zhou , Xin Lai , YaXing Liu
1. Zhejiang Climate Center, Hangzhou, Zhejiang 310017, China
2. Chengdu University of Information Technology, Chengdu, Sichuan 610225, China
Research for length change of four seasons over China in recent 47 years
ZhenYan Yu1*, GuangZhou Fan2, Wei Hua2, DingWen Zhou2, Xin Lai2, YaXing Liu2
1. Zhejiang Climate Center, Hangzhou, Zhejiang 310017, China
2. Chengdu University of Information Technology, Chengdu, Sichuan 610225, China
Using daily temperature data from 599 Chinese weather stations during 1961-2007, the length change trends of four seasons during the past 47 years were analyzed. Results show that throughout the region, four seasons’ lengths are: spring becomes shorter(-0.8 d/10yrs), summer becomes longer (3.2 d/10yrs), autumn (-0.5 d/10yrs) and winter (-1.6 d/10yrs) becomes shorter. This trend is different in spatial distribution, namely it is very obvious in northern than southern China, and also remarkable in eastern than western China. Summer change is most obvious, but autumn has little change comparatively. This trend is highly obvious in North, East, Central and South China. In the Southwest starting in the 21st century, summer becomes longer and winter shortens.The trend in the Plateau region since the 1980s is that spring becomes longer and winter shortens. The average annual temperature increased during the past 47 years, and the change of the average annual temperature precedes seasons’ length. Thus, the average annual temperature has a certain influence on the length change of seasons.
four seasons’ length; standard for season classification; seasonal change; global warming; climate trend coefficient
1. Introduction
Since the 1980s, scholars have used weather data to develop a series of experiments, and discovered that world temperature has been tending upward, increasing by about 0.5 °C on average over the last 100 years, with an obvious increase of 1 °C in the Northern Hemisphere (Houghton,1996). In the 1980s, temperature even appeared as a rapid change (Goossens and Berger, 1987). The changing temperature trend over China is similar to most of the Northern Hemisphere (Bradleyet al., 1987). It is a fact that climate is becoming warmer, with the world’s average temperature in the last century being the highest on record. The problem of global warming is cause for serious concern for various communities (Ding and Dai, 1994; Song, 1994; Zhai and Ren, 1997; Chenet al., 1998; Xueet al., 2007; Quet al.,2008; Hou and Chen, 2009). Song (1994) analyzed spatial and temporal change characteristics of temperature by using a period of 10-day temperature data from 336 Chinese stations for more than 40 years. Zhai and Ren (1997) used actual measurement data from 1951 to 1990 to analyze spatial and temporal change characteristics of the maximum and minimum temperature over China. Chenet al. (1998) used data from 400 stations to do a system research on spatial and temporal change characteristics of China for more than 40 years. Ding and Dai (1994) provided an overview of research on temperature variety within the last hundred years.In this paper, we discovered that the temperature trend in China is very similar to circumstances in the Northern Hemisphere, but obvious differences exist with global warming such as concrete variety and the temperature change range.The maximum temperature of China appeared in the 1940s and no later than the 1980s. Temperatures declined since the 1950s in the Southwest, while increasing in the Northeast,North and western region of Northwest mainly. Temperatures in China expressed two rapid changes within the last hundred years, one in 1919, and the other in 1952.
Most areas of China are in the subtropics and temperate zones, with bright summer sunshine, and multifarious cold air invading the South during the winter. Thus, seasonal change is very obvious due to cold winters and hot summers(Lin, 1987). Hence, in order to determine whether seasons’length has significantly different trends in various regions,we consulted Zhang (1991) and the spatial distribution of the mean length of the four seasons during 1961-2007, dividing China into eight regions: Northeast, North, Northwest, East,Central, South, Southwest, and the Plateau. Thus, we hope to understand the variety and distribution characteristics of seasons’ length within the last 47 years against the background of global warming.
2. Data and methods
2.1. Data
Daily temperature data for the years 1961-2007 gathered from 599 weather stations were provided by the National Climate Center of China. Before analysis, single missing values were interpolated using the central difference method,and consecutive missing values were interpolated using the average temperature of the missing day in all the other years.All interpolated values passed the statistical reliability test of 0.01; hence, we can consider the interpolated data to be reliable.
Winter generally begins at the end of a calendar year and continues through January or February of the following year.So the winter data we used were during the years of 1961-2006, for a total of 46 years, the other season’s data has it as 47 years. But the 599 weather stations are always presented as a unique situation. For example, vast areas of the Qinghai-Tibet Plateau experience winter throughout the year, while some areas of South China experience summer almost all year. The climate can also vary from year to year in the same area. Some areas, for example, experienced year-round summer in some years but not in others. Consequently, seasons’ length and its differing age did not include 599 stations each year.
2.2. Analysis method
2.2.1 The division of seasons
Zhang (1934) divided the year into four seasons according to phenology as follows: when the daily average temperature was consistently below 10 °C for five days, then the first day of the five-day period was defined to be the start date of winter; when the daily average temperature consistently reached 22 °C for five days, the first day of the five-day period was defined to be the start date of summer;when the daily average temperature was consistently between 10 °C and 22 °C for five days, the first day of the five-day period was defined to be the start date of spring or autumn, respectively. The duration of each season was defined to be the period from its start date to the start date of the following season.
After dividing the year into four seasons based on the method described above, we briefly analyzed the average spatial distribution of seasons’ length during 1961-2007,then determined the seasonal characteristics of decadal change, and used a T-test to find whether the differences of two ages had statistical meaning.
2.2.2 Climate trends coefficient
Shiet al. (1995) calculated the climate trend coefficientrxtto study the quantitative extent of meteorological factors in climate change.
rxtis defined as the correlation coefficient of thentimes(years) and the numbers of sequence 1, 2, 3…n.
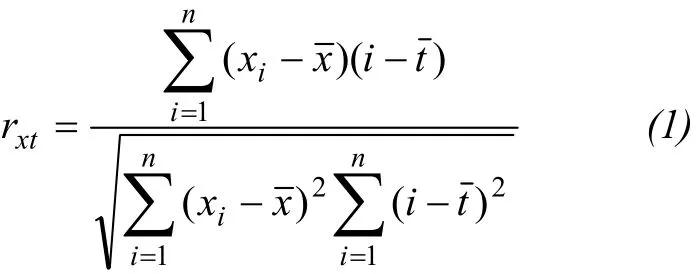
where,=(n+1)/2,nis the years.xiis the elements of value in yeari, andis the sample mean. Obviously, this value is positive (negative) when there is a linear increase (decrease) trend during thenyears of the elements in the calculation. It can also test whether this climate trend is meaningful, or just a random vibration of the T-test.
In this paper, we used the method above to calculate the average trend coefficient of seasons’ length over the whole country and in each district, the trend coefficient of each station, then performed statistics test, finally obtained spatial and temporal distribution characteristics of the change trend of seasons’ length in the last 47 years over China.
3. Results and discussion
3.1. The average seasons’ length over 47 years
The average duration of spring was about 30 days in South China, in the area where spring was the shortest. In East China, Central China, Northeast, North China, Xinjiang and the eastern region of the Southwest, spring lasted around 30-40 days. In surrounding regions of the Qinghai-Tibet Plateau, spring lasted around 40-50 days. West Sichuan Plateau can experience up to 100 days of spring.
In most areas of South China, summer last more than 200 days (Figure 1a), which is the area where summer was the longest. In the southern parts of East and Central China,as well as in the eastern part of the Southwest, summer lasted about 150 days; while in the northern parts of East and Central China, the southern part of North China, and Xinjiang, summer lasted 90-120 days. Most areas of the Northeast and the northern part of North China had only 30-60 days of summer. In large areas of the Qinghai-Tibet Plateau,it had essentially no summer because of the high altitude.West Sichuan Plateau had about 60 days of summer.
The duration of autumn was 40-50 days over most regions of China, and it can be said that spring merged into autumn around the Qinghai-Tibet Plateau, as there was no real summer. The northern part of North China experienced only 20-30 days of fall, whereas Yunnan had the longest autumn, sometimes lasting as long as 100 days.
In the Northeast, North China and northern part of the Northwest, winter sometimes lasted as long as 200 days or more (Figure 1b), and lasted about 150-180 days in the Tarim Basin. In the East, Central China and the eastern part of the Southwest, winter lasted 100-150 days; the northern part of South China had about 50 days of winter, while the southern part had essentially no winter. Large areas of the Qinghai-Tibet Plateau had winter essentially all year around;it can be said that winter was the longest there.

Figure 1 The distributions of the mean length of summer (a) and winter (b) during 1961-2007
3.2. The characteristics of inter-decadal changes
In the 1970s compared to the 1960s, spring became shorter in the Northeast, North China, Qinghai, Tibet and east of Xinjiang, and some of these areas passed the statistically significant level of 0.01. In the 1980s compared to the 1970s, spring became longer in the Northeast, North China and the Qinghai-Tibet Plateau, and became shorter in other areas, but only fragmentary parts passed the statistically significant level of 0.01. In the 1990s compared to the 1980s,spring became shorter in the Northeast, northern part of North China, southern part of East China, Qinghai and Xinjiang, and this phenomenon was obvious in some areas of northern Inner Mongolia, as well as in some parts of Qinghai and Xinjiang. At the beginning of the 21st century compared to the 1990s, spring became shorter in partial regions of the northern part of the Northeast, North China and the Northwest, and a partial region of Xinjiang was the most obvious.
In the 1970s compared to the 1960s, summer became longer in the Northeast, North China, Tarim Basin and western portion of the Southwest (Figure 2). After the 1980s,summer of each generation became obviously longer in most areas of China compared to the front generation, and most parts passed the statistically significant level of 0.01.Before the 21st century, summer became shorter over the West Sichuan Plateau and the Yunnan-Guizhou Plateau. This was good correspondence with the warming which was obvious in most areas of China, but temperatures in southwestern Sichuan Basin and northern Yunnan-Guizhou Plateau still maintained reducing slightly (Renet al., 2005).
The change of autumn was short in most areas of China,and obviously shorter trend in small regions. Autumn became obviously shorter in the southern part of South China and the northwestern part of Inner Mongolia in the 1970s. In the 1980s, north of Xinjiang, southern part of South China,small parts of Inner Mongolia and west of Qinghai all passed the statistically significant level of 0.01. In the 1990s,only fragmentary parts of Inner Mongolia passed the statistically significant level of 0.01, and north of Inner Mongolia as well as small parts of Qinghai also passed the statistically significant level of 0.01 at the beginning of the 21st century.
Except for the Northeast, North China, eastern part of the Northwest and the Qinghai-Tibet Plateau, winter became shorter in the 1970s compared to the 1960s (Figure 3). In the 1980s compared to the 1970s, winter became shorter in North China, the Qinghai-Tibet Plateau and east of Xinjiang,and became longer in other regions, basically below five days. In the 1990s compared to the 1980s, winter became shorter in the Northeast, Junggar Basin, Qinghai, Tibet,Yunnan and South China, and some of these areas passed the statistically significant level of 0.01. Winter became shorter in each region of China at the beginning of the 21st century compared to the 1990s, but the most obvious regions were in the Qinghai-Tibet Plateau, Yunnan and South China, and most of the regions passed the statistically significant level of 0.01.
With the aforementioned analysis, we know that in most areas of North, East, Central, and South China, seasons’length had the following basic trend under the background of global warming: spring and winter became shorter, summer became longer and the change was most obvious compared to other seasons, but the change of autumn was small.This phenomenon was most obvious at the beginning of the 21st century as this period saw a marked warming. The North was the most distinct region where the warm season became longer and the cold season became shorter. This is in agreement with results that the incalescence was the quickest in vast regions of North China, the Northeast and Northwest (Zouet al., 2004). Also, the incalescence occurred mainly in the Northeast, North China and western portion of the Northwest (Ding and Dai, 1994).
The phenomenon of a longer summer and shorter winter only occurred at the beginning of the 21st century in the Southwest, because northeast and southwest of the Sichuan Basin maintained a weak cooling trend during the last 40 years of the 20th century (Maet al., 2006). Since the 1980s,spring became longer and winter became shorter in the Plateau regions, which corresponds very well with a significant warming which occurred in these regions (Renet al., 2005).

Figure 2 The distribution difference of summer length for (a) the 1970s minus the 1960s, (b) the 1980s minus the 1970s,(c) the 1990s minus the 1980s, (d) the early 21st century minus the 1990s. The positive values represent seasons’ length increased; the negative values represent seasons’ length decreased.The shaded area passed the statistically significant level of 0.01.
3.3. Characteristics of the changing trends
3.3.1 National trends
The overall and very obvious length trends of the four seasons are as follows (Figure 4): spring began to shorten, in local parts of the Plateau and Yunnan, spring became longer,but the change of spring was mostly indistinctive; summer obviously became longer and most evident in major areas of the Northern, Eastern, Central China, and Yunnan; autumn was basically unchanged, only small parts of northern Inner Mongolia passed the statistically significant level of 0.01.Except for South China and the Tarim Basin, winter began to shorten and most notably in the Northwest, North, East and Central China.
From the average change trend of the whole country,spring, autumn and winter had become shorter, the tendency leads were -0.8 d/10yrs, -0.5 d/10yrs, -1.6 d/10yrs,respectively, and the trend coefficients were -0.26, -0.18,-0.37, respectively, thus the change in winter was the most dramatic (Figure 5). Overall, summer lasted longer, the tendency lead was 3.2 d/10yrs, and the trend coefficient was 0.69. We can conclude that warm seasons’ length increased and cold seasons’ length decreased in national average. The variety of summer and winter were the most obvious, and both passed the statistically significant level of 0.01, the shorter spring also passed the statistically significant level of 0.05.
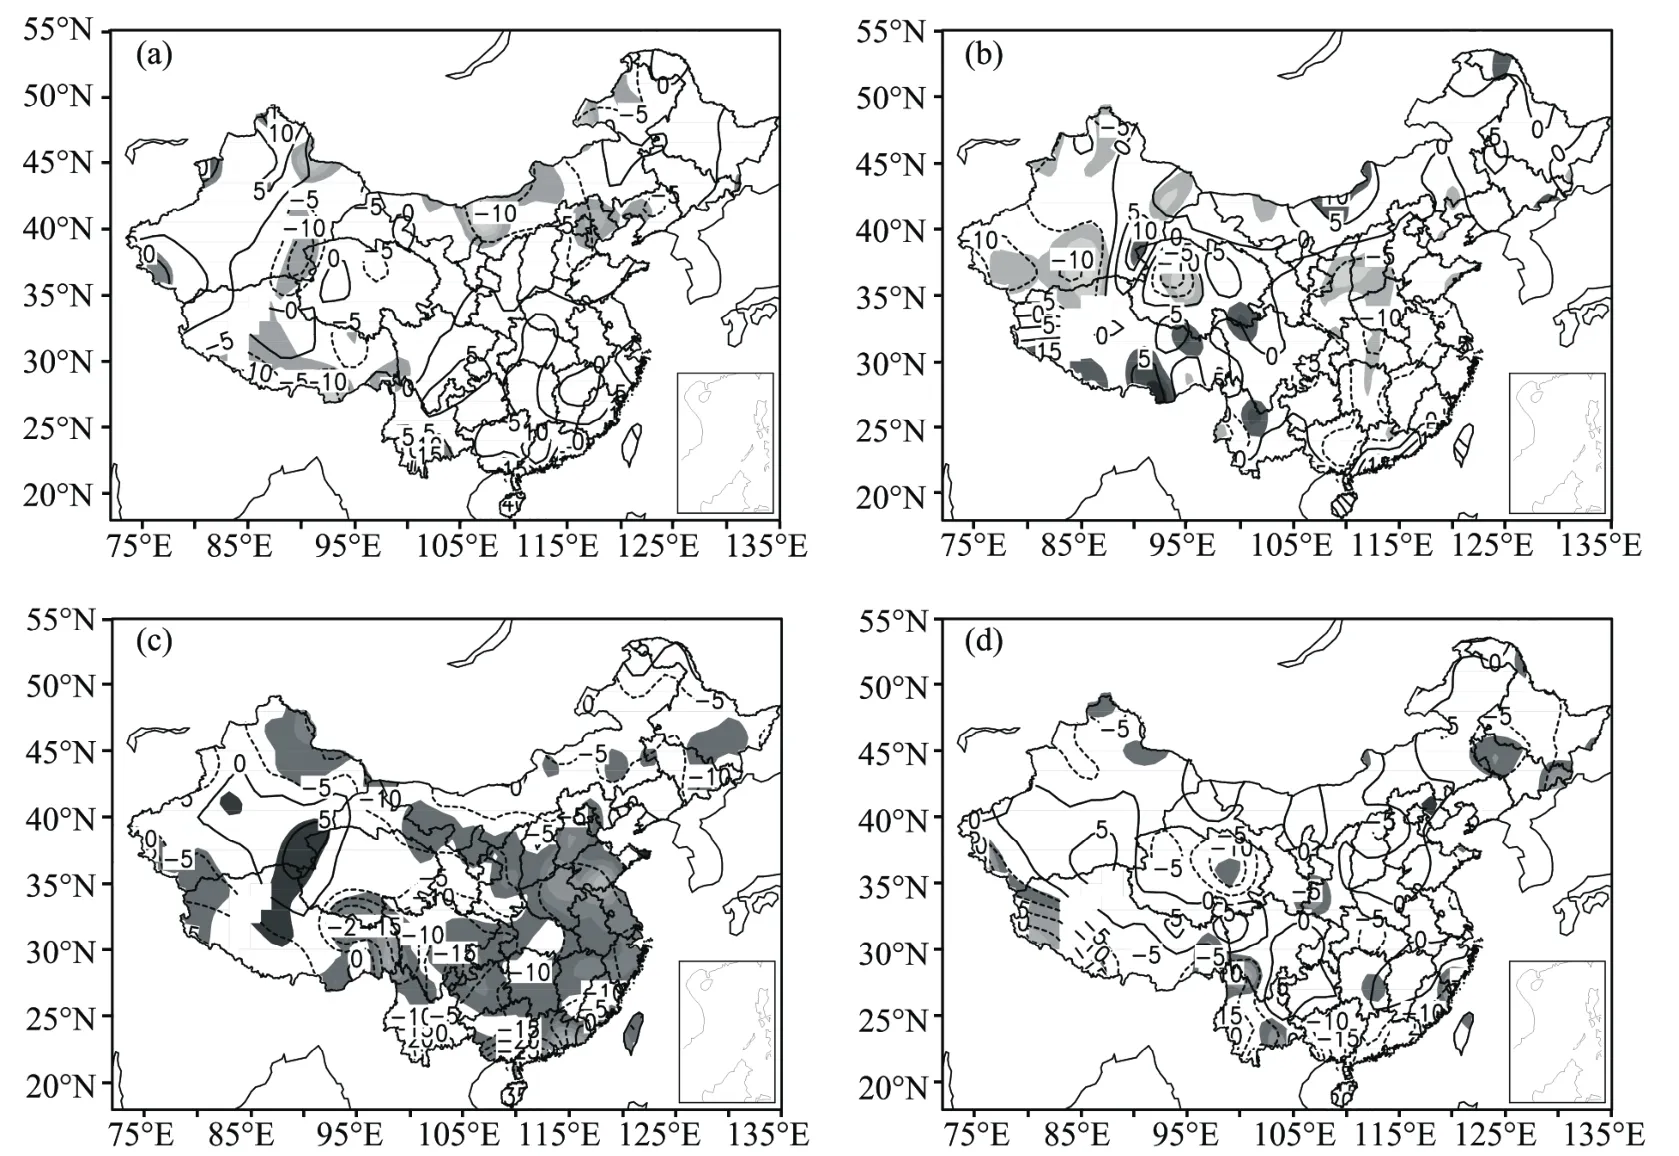
Figure 3 The distribution difference of winter length for (a) the 1970s minus the 1960s, (b) the 1980s minus the 1970s,(c) the 1990s minus the 1980s, (d) the early 21st century minus the 1990s. The positive values represent seasons’ length increased; the negative values represent seasons’ length decreased.The shaded area passed the statistically significant level of 0.01.
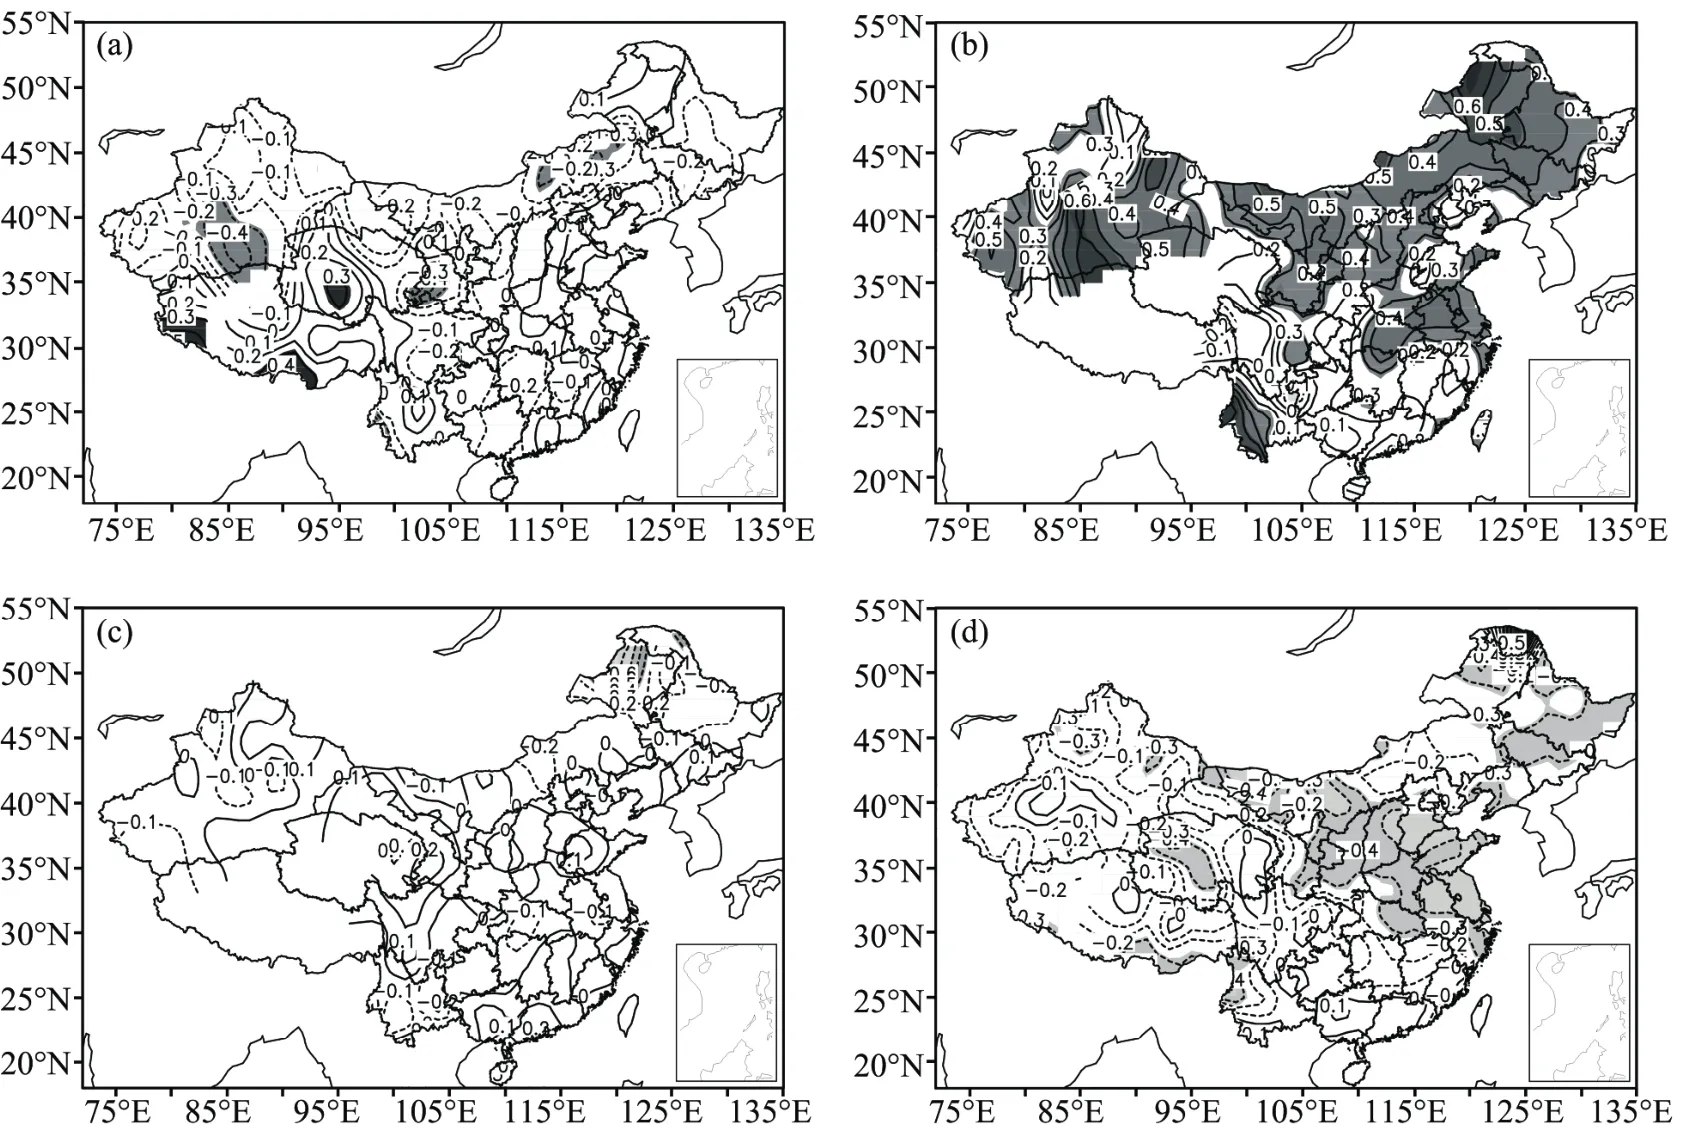
Figure 4 Trend coefficients in the mean length of four seasons during 1961-2007: (a) spring, (b) summer, (c) autumn, (d) winter.The positive values represent seasons’ length increased; the negative values represent seasons’ length decreased.The shaded areas have passed statistically significant level of 0.05.
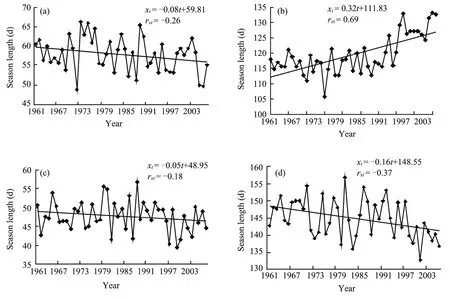
Figure 5 Trends in the mean length of four seasons in China during 1961-2007: (a) spring, (b) summer, (c) autumn, (d) winter
3.3.2 Change trends by regions
To objectively examine the differences of seasonal change trends among the various regions, we should combine information from Table 1 (Tibet had essentially no summer or autumn, and South China had no winter, thus the table does not list the coefficients for these three trends).At the national level there was a clear trend for the more variable-length summer. Except for the Southwest passing the statistically significant level of 0.05, this trend in other regions all passed the statistically significant level of 0.01. The duration of spring and winter also showed an obvious shortening trend. In the Plateau regions, however,the duration of spring appeared to be decreasing. The change of autumn was less pronounced, with a slight shortening.

Table 1 The trend coefficients of the four seasons’ length in different regions (unit: d/yr)
With the above data analysis, we can see that at the national level, the major length trends were that warm seasons lasted longer, cold seasons became shorter; spring, autumn and winter became shorter, and summer became longer,which was well inosculated to the obvious warming trend in the 1980s over much of China (Zouet al., 2004). These trends were different in spatial distribution, which was most obvious in North than in South China, and also in East than in West China, which is in accord with the warming trend in the North and cooling in the South in the 20th century (Shaet al., 2002). Wanget al. (2005) pointed out that temperature abnormality was most obvious in the Northeast and eastern part of North China. In the last hundred years, the range of increasing temperature in the Northeast and eastern part of North China was more obvious than the global average in the 20th century (Wanget al., 2005), and warming in the Northwest was also very obvious (Maet al., 2002). With the influence of global warming, as well as urban heat island which is attributed to rapid urbanization and industrialization,temperatures show an obvious increasing trend in East China in the last 50 years (Xuet al., 2005). The shortening of spring and winter were not obvious in the Southwest, and autumn length was basically constant, reflecting a constant to weakly reducing temperature in this area (Ding, 1994;Renet al., 2005). It is clear that seasonal change corresponds well to warming in the eastern part and cooling in the western part. The length change of summer was the most obvious, and the duration changes of spring and winter were also more obvious than that of fall, which was the smallest of all seasons. Although a warming occurred during the cold season mainly over China, a gradual warming during the warm season was also obvious in the 1990s (Renet al.,2005). So the length changes of seasons correspond well to changes of temperature.
4. The influence of the year average temperature variety upon the seasons’ length
On an national average, the yearly average temperature had an obvious increasing trend, the tendency rate was 0.3 °C/(10yrs), and the trend coefficient was 0.56 (Figure 6).Combining Figure 5, we find that the yearly average increased during 1961-2007; spring, autumn and winter became shorter, and summer became longer.
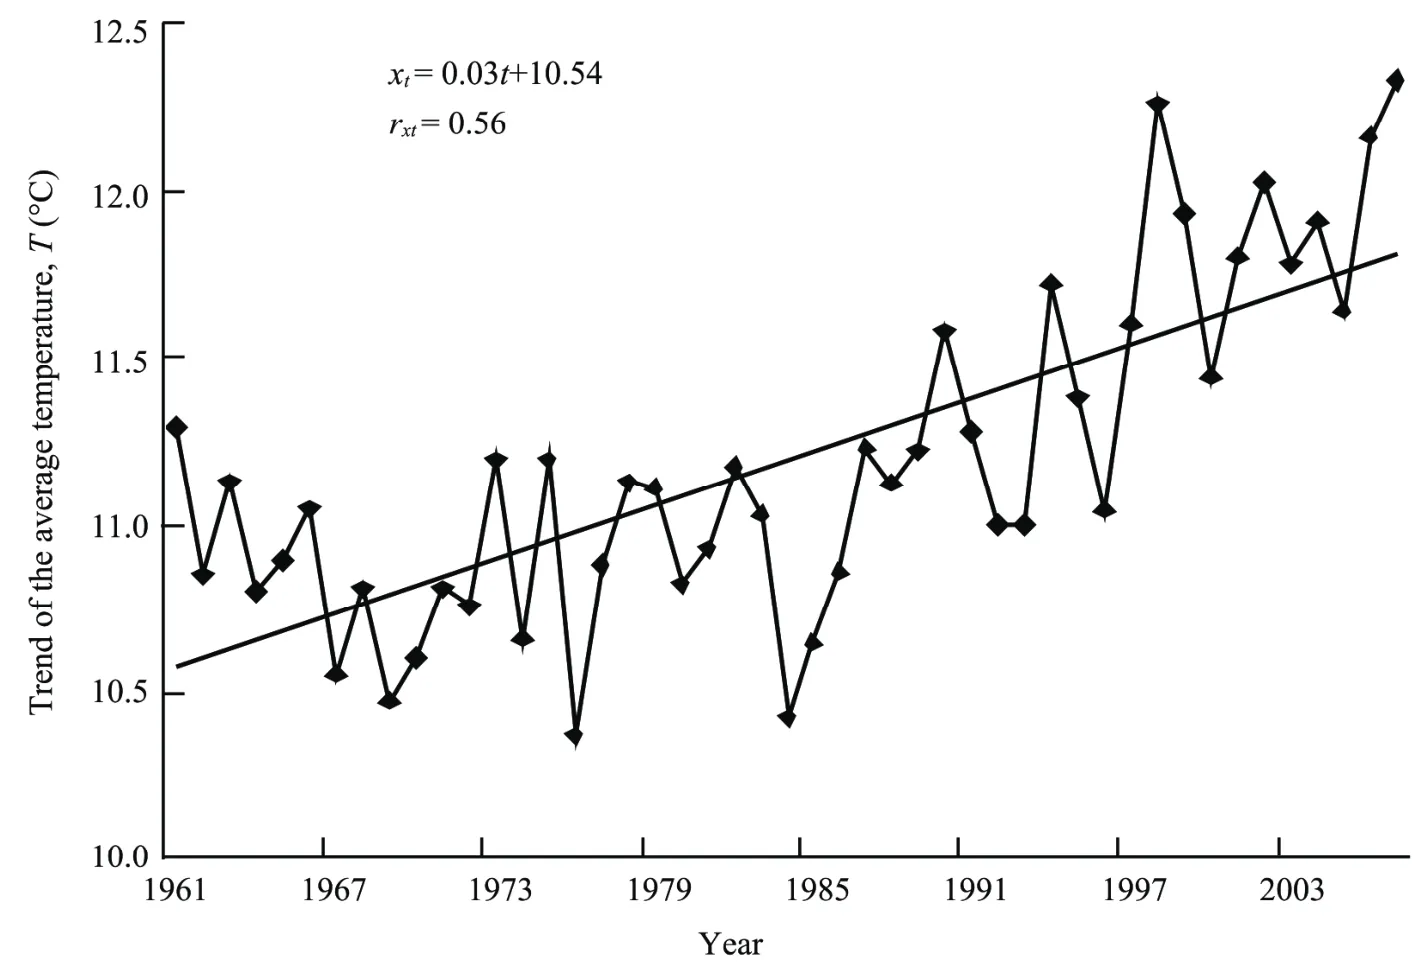
Figure 6 Trend of the average temperature in China during 1961-2007
To determine the length change characteristics of seasons and the yearly average temperature over the span of 10 years, we performed the Mann-Kendall test for the two separately, and the results are shown in Figures 7 and 8.
Nationally, spring shorten from the mid-1980s, summer and autumn both became longer starting in the mid-1990s,but autumn was shorter in the early 21st century, and winter became shorter since the early 1990s. The most obvious characteristics of seasons’ length were the two curves intersect in 1997, and the intersection points were all within the statistically significant threshold at the 0.05 level. It can be said that the four seasons experienced significant decadal changes from the end of the 1990s to the early 21st century.
Corresponding to Figure 8, the yearly average temperature began to rise from the 1970s, the two test curves intersected in 1994, and the intersection point was located near the statistically significant level of 0.05, which can be said that it experienced a significant decadal change from the mid-1990s and this time was earlier than the rapid change of seasons’ length.
Set against the background of global warming, the average temperature increased during 1961-2007, and the changes of seasons’ length occurred subsequently. Spring,autumn and winter had become shorter, and summer had become longer. The rapid change of yearly average temperature was earlier than the seasons’ length, and the former had a great influence on the latter.
5. Conclusions
Our analysis has resulted in the following major conclusions.
(1) Length changes of the four seasons were very obvious on a national average. In large areas of China spring became shorter (-0.8 d/10yrs), summer became longer (3.2 d/10yrs), and autumn (-0.5 d/10yrs) and winter (-1.6 d/10yrs) became shorter. Looking at the data from a regional point of view, these trends were more obvious in North than in South China, and more obvious in East than in West China. Nationally, on average, the longer summer had the most obvious change, less dramatic changes were that spring and winter was shorten, but autumn had little change comparatively. The shorter spring and winter were not obvious in the Southwest.
(2) In the North, East, Central and South China, summer became longer and had the most obvious change, autumn and winter were shorter, and spring lasted longer in East China but was shorter in other regions. In the Southwest,summer lasted longer and winter shortened starting in the 21st century. The Plateau regions had a trend that spring lasted longer and winter shortened from the 1980s.
(3) The average annual temperature increased during the past 47 years, the change of the average annual temperature occurred preceding the length of seasons, and the average annual temperature had a certain influence on the length change of seasons.

Figure 7 The Mann-Kendall test of the mean length of seasons in China: (a) spring, (b) summer, (c) autumn, (d) winter.Solid line with hollow circle is the forward statistic rank series, dashed line with circle is the backward statistic rank series.The straight line indicates Mann-Kendall test of significance level of 0.05.
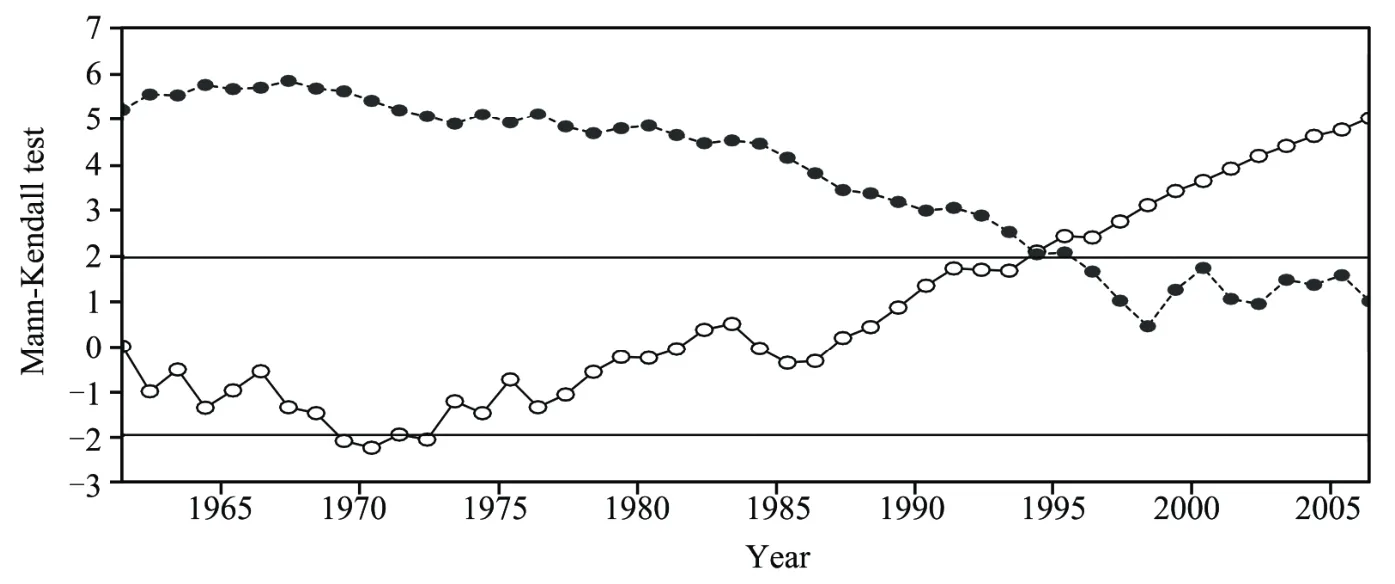
Figure 8 The Mann-Kendall test of the annual average temperature in China
This work was supported by the National Natural Science Foundation of China (Grant No. 40875053).
Bradley RS, Diaz HF, Jones PD, Kelly PM, 1987. The Climate of China and Global Climate. In: Ye DZ, Fu CB, Chao JP, Yoshino M (eds). Secular Fluctuation of Temperature over Northern Land Areas and Mainland China since the Mid-19th Century. China Ocean Press, Beijing. 76-87.
Chen LX, Zhu WQ, Wang W, 1998. Studies on climate change in China in recent 45 years. Acta Meteorologica Sinica, 56(3): 257-271.
Ding YH, 1994. An Overview of the Climate Change in China during Recent 100 Years and Response Strategy. Proceeding of International Workshop on Climate Change and Environment in China and their Challenge. China Meteorological Press, Beijing.
Ding YH, Dai XS, 1994. Temperature variation in China during the last 100 years. Meteorological Monthly, 20(12): 19-26.
Goossens C, Berger A, 1987. Abrupt Climatic Change: Evidence and Implication. In: Berger WH, Labeyrie LD (eds). How to Recognize an Abrupt Climatic Change? D. Reidel Publishing Company, Dordrecht. 31-46.
Hou YL, Chen BD, 2009. Climate characteristics of spatial-temporal variations of maximum and minimum surface air temperatures in East China and its surroundings during the past 46 years. Plateau Meteorology, 28(6):1478-1484.
Houghton JT, 1996. Climate Change 1995: The Science of Climate Change.Intergovernmental Panel on Climate Change (IPCC). Cambridge University Press, Cambridge. 141-143.
Lin ZG, 1987. Climate of China. China Meteorological Press, Beijing.32-33.
Ma PL, Wang RS, Wang BL, Yang XL, 2002. The characteristics of maximum and minimum temperature change and distribution in northwest China. Plateau Meteorology, 21(5): 509-513.
Ma ZF, Peng J, Gao WL, Tian H, 2006. Climate variation of southwest China in recent 40 years. Plateau Meteorology, 25(4): 633-642.
Qu YL, Gao XQ, Chen W, 2008. Comparison of surface air temperature and precipitation in eastern and western China during 1951-2003. Plateau Meteorology, 27(3): 524-529.
Ren GY, Xu MZ, Chu ZY, 2005. Changes of surface air temperature in China during 1951-2004. Climatic and Environmental Research, 10(4):717-727.
Sha WY, Shao XM, Huang M, 2002. The climatic warming and its infection to the borderline of natural region over China form 1980s. Science China(Series D), 32(4): 317-326.
Shi N, Chen JQ, Tu QP, 1995. 4-phase climate change features in the last 100 years over China. Acta Meteorologica Sinica, 53(4): 431-439.
Song LC, 1994. Characteristics of temperature in spatial and temporal variation in China during recent 40 years. Quarterly Journal of Applied Meteorology, 5(1): 119-124.
Wang HY, Gong Q, Sun FH, Yang SY, 2005. Temperature anomaly features in northeast China and east of North China and primarily analysis of its mechanism. Plateau Meteorology, 24(6): 1024-1033.
Xu JL, Ke XX, Zhou WD, 2005. The Climate Change and Its Impact in Urban Areas of Yangtze River Delta in Recent 50 Years. China Meteorological Press, Beijing. 8-16.
Xue DQ, Tan ZM, Gong DL, Wang XT, 2007. Primary analyses of upper-air temperature changes in China in past 40 years. Plateau Meteorology,26(1): 141-149.
Zhai PM, Ren FM, 1997. On changes of China’s maximum and minimum temperature in the recent 40 years. Acta Meteorologica Sinica, 55(4):418-429.
Zhang BK, 1934. The duration of four seasons in China. Acta Geographica Sinica, 1(1): 29-74.
Zhang JC, 1991. Climate Pandect of China. China Meteorological Press,Beijing. 256-305, 477.
Zou HC, Lu SH, Hu YQ, 2004. Variations trend of yearly mean air temperature and precipitation in China in the last 50 years. Plateau Meteorology,23(2): 238-244.
10.3724/SP.J.1226.2011.00517
*Correspondence to: ZhenYan Yu, Zhejiang Climate Center. No. 73, West Genshan Road, Hangzhou 310017, Zhejiang, China.Email: yuzhenyan@126.com
17 May 2011 Accepted: 9 August 2011
 Sciences in Cold and Arid Regions2011年6期
- Sciences in Cold and Arid Regions的其它文章
- Stress relaxation of warm frozen soil under drained or undrained conditions
- Different characteristics of the structure of atmospheric boundary layer between dry and rainy periods overthe northern Tibetan Plateau
- Analysis on characteristics of aerosol absorption and scattering over Zhangye, China
- Climatic changes have led to significant expansion of endorheic lakes in Xizang (Tibet) since 1995
- Characteristics of dynamic strain and strength of frozen silt under long-term dynamic loading
- Simulation and analysis of river runoff in typical cold regions
