Blood gas analysis as a surrogate for microhemodynamic monitoring in sepsis
Jingyi Wang, Li Weng, Jun Xu, Bin Du
1 Emergency Department, State Key Laboratory of Complex Severe and Rare Diseases, Peking Union Medical College Hospital, Chinese Academy of Medical Science and Peking Union Medical College, Beijing 100730, China
2 Medical Intensive Care Unit, State Key Laboratory of Complex Severe and Rare Diseases, Peking Union Medical College Hospital, Peking Union Medical College and Chinese Academy of Medical Sciences, Beijing 100730, China
KEYWORDS: Sepsis; Microcirculation; Blood gas analysis; Emergency service
INTRODUCTION
Sepsis is defined as life-threatening tissue hypoperfusion and organ dysfunction caused by a dysregulated host response to infection.[1]Sepsis and septic shock are major health problems in the emergency department (ED), and early recognition and interventions are essential for improving patient outcomes.Hemodynamics, comprising macrocirculation and microcirculation, is the foundation of septic resuscitation.Although ED physicians routinely depend on macrocirculation, microcirculation has recently been proposed to play a key role in the pathogenic mechanisms of sepsis-induced organ dysfunction.[2,3]Previous studies suggested that the occurrence of microcirculatory abnormalities in early sepsis, despite well-preserved macrocirculation, might result in multi-organ failure and poor outcomes.[2,3]Microcirculation perfusion can be measured by parameters including perfused vessel density (PVD), the proportion of perfused vessels (PPV),microcirculatory flow index (MFI), and heterogeneity index.PVD, PPV, and MFI comprehensively describe the functional perfusion of microvessels, while the heterogeneity index quantifies the heterogeneity of perfusion.[4]However, the availability of these advanced microcirculatory measures in clinical settings is limited because the techniques are difficult to use and lack uniformly defined endpoints.[5]Viable practical clinical surrogates are therefore needed, particularly for rapid assessment and decision-making in the ED.Blood gas analysis and its derived indicators, linked to systemic oxygen (O2) metabolism, may reflect the relationship between tissue O2delivery (DO2) and consumption(VO2), and may thus provide alternative tools for microcirculatory assessment and for hemodynamics optimization during septic resuscitation.
Based on the pathophysiological mechanisms and the current findings, this review provides an overview of the use of blood gas analysis to assess microcirculatory status, detect early tissue hypoxia, and optimize hemodynamic treatment in sepsis.
METHODS
We performed a search using PubMed, Web of Science, and Google scholar.The studies and reviews that were most relevant to septic microcirculatory dysfunctions and blood gas parameters were identified and included.Based on the pathophysiology of oxygen metabolism, the included articles provided a general overview of employing blood gas analysis and its derived set of indicators for microhemodynamic monitoring in septic care.
RESULTS
Circulatory pathophysiology of sepsis
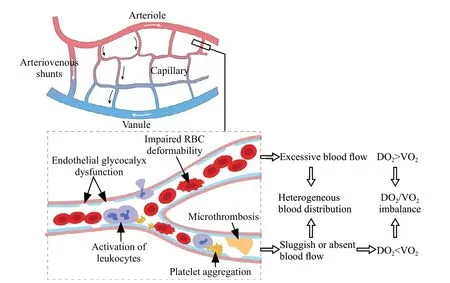
The principal role of the circulation is to deliver O2and nutrients to peripheral tissues and remove metabolites.Circulatory dysfunction is common in sepsis, and its current management mainly aims to improve macrohemodynamic indicators,such as the mean arterial pressure, central venous pressure, and cardiac index.[1,6]However, abnormal microcirculation might persist despite improved or restored macrohemodynamic indicators,[7-9]highlighting a loss of coherence between the macrocirculation and microcirculation.[10]The microcirculation comprises a network of O2exchange between peripheral tissues and blood circulation, and it is the main site for tissue oxygenation.When sepsis occurs, the microcirculatory network is disrupted by factors such as endothelial glycocalyx dysfunction, activation of microthrombosis and leukocytes, increased microvascular rigidity, and pathologic formation of arteriovenous shunts,[11,12]leading to impaired blood flow and deteriorated heterogeneity of tissue perfusion (Figure 1).Consistently sluggish or absent blood flow will compromise DO2in related tissues or disrupt the balance between DO2and VO2.
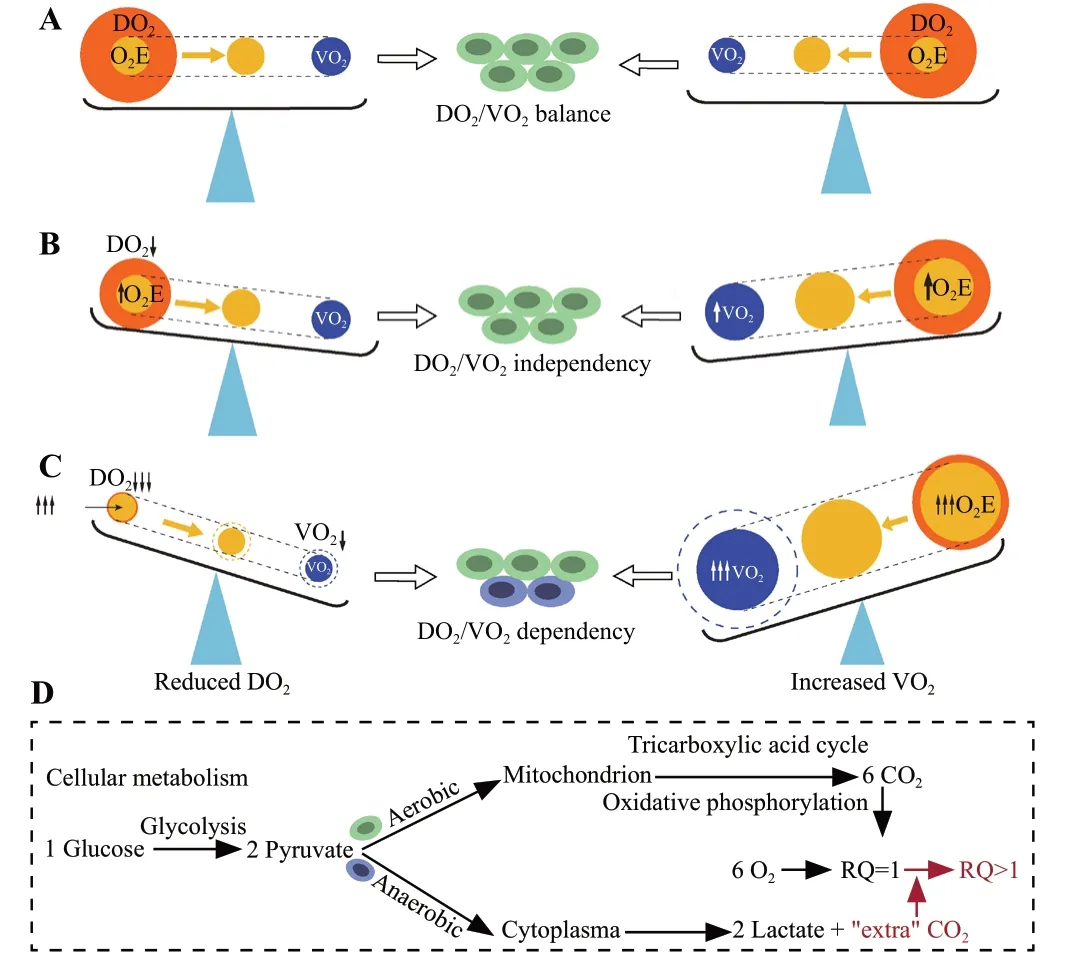
The DO2/VO2balance is the cornerstone of hemodynamic stability.DO2represents the arterial supply of O2to tissues (DO2=Q × CaO2, where Q is blood flow and CaO2is arterial O2content), while VO2represents O2removed from arterial blood for use by the tissues (VO2=Q × [CaO2-CvO2], where CvO2is venous O2content [Supplementary Figure S1]).Both DO2and VO2are affected by multiple factors, resulting in a dynamic balance (Figure 2 and Supplementary Table S1).Under normal circumstances, aerobic cell metabolism only requires a small fraction of DO2(Figure 2A).Under conditions of an inadequate DO2/VO2(decreased DO2,and/or increased VO2), VO2initially remains satisfied as O2extraction increases adaptively, known as DO2/VO2independency.At this stage, aerobic metabolism is preserved, but CvO2decreases (Figure 2B).However, if the inadequacy persists, the compensatory O2extraction process approaches its maximum capacity, and DO2fails to meet the demand of tissue oxygenation, leading to DO2/VO2dependency and O2debt.[13]At this point,aerobic metabolism switches to anaerobic metabolism(Figure 2C), resulting in further reduction of CvO2,elevated lactate levels, and abnormal carbon dioxide(CO2)-related parameters (Figure 2D).

Figure 1.Microcirculatory alterations in sepsis.RBC: red blood cell;DO2: O2 delivery; VO2: O2 consumption.

Figure 2.The pathophysiological determinants of the DO2/VO2.A: DO2/VO2 balance; B: DO2/VO2 independency; C: DO2/VO2 dependency; D: cellular metabolism.DO2: O2 delivery; VO2: O2 consumption; O2E: O2 extraction; RQ: respiratory quotient.
As the post-metabolism part of the circulation, venous blood includes the O2left after cellular metabolism, thus providing valuable information on tissue oxygenation.“Venous blood” in this review refers exclusively to mixed or central venous blood.Mixed venous blood is the blood that travels through all the systemic capillary beds and returns to the right ventricle and is acknowledged to reflect global O2metabolism by combining venous blood from the superior vena cava (SVC) and inferior vena cava.However, measurement of mixed venous parameters requires a pulmonary artery catheter, which is invasive and not feasible in all patients.[14]Central venous blood includes blood that returns via the SVC and thus only represents the O2metabolism of the upper body;[15]however, it is easier to obtain via a central venous catheter (CVC) and may thus be used as a substitute for mixed venous blood.Notably, despite controversy regarding the ability to substitute mixed and central venous blood (e.g., venous O2saturation [SvO2]);[16-19]when the CVC tip is close to the right atrium, central SvO2(ScvO2) was an excellent estimate of mixed SvO2(SmvO2), with a difference between the two parameters of about 1%.[19]Central venous blood is thus an acceptable substitute for mixed venous blood when the placement of the CVC is appropriate.
Parameters of DO2/VO2 independency
Despite a shortage of DO2relative to VO2during DO2/VO2independency, tissue oxygenation is nevertheless satisfactory due to improved O2extraction.Early signs of hypoxia include a decrease in venous blood O2content and an increase in O2extraction capability.
Venous O2 saturation (SvO2)
SvO2reflects the O2content in venous blood after cellular metabolism.SvO2varies among organs, from up to 90% in the kidney to 40% in the myocardium,depending on the O2demands of the tissues.[15]Under normal conditions, SmvO2is about 75%, while ScvO2is usually 2%–3% lower, because the lower body consumes less O2than the upper body.[15]In contrast, ScvO2will exceed SmvO2during shock as blood is redistributed from the hepatosplanchnic region to support coronary or cerebral circulation.[20]Despite the lack of consensus regarding the best cutoff value for SvO2in resuscitation, SmvO2≥65%or ScvO2≥70% is still advocated in clinical practice.[21,22]
Several studies have investigated the relationship between SvO2and microcirculatory perfusion.In septic patients, an increase in SmvO2following norepinephrine treatment was paralleled by improvements in PVD and MFI.[23]A recent meta-analysis showed that initiation of blood cell transfusion by lower SmvO2rather than lower hemoglobin level maximized the benefit to microcirculatory blood flow in septic patients,[24]suggesting that SmvO2may be a reliable index of microcirculatory perfusion.However, SvO2reflects cellular oxygenation indirectly, by measuring the remaining O2content in venous blood.It thus provides little information on the complex O2metabolism within peripheral tissues.Several studies showed that higher ScvO2was also linked to increased mortality.[25,26]High SvO2is probably caused by impaired O2utilization or pathological shunting in sepsis.[25,27,28]Aggressive resuscitation with fluids, vasopressors, and oxygen therapies may also result in a prompt rise in DO2and a high SvO2.[29,30]Hence, SvO2should be interpreted with caution, especially for high values.
O2 extraction rate (O2ER)
An increased O2ER, calculated as [CaO2-CvO2]/CaO2), is typically a marker of reduced DO2during earlystage shock, with a normal value of 25%–30%.[31]O2ER increases in hypoxic settings to match the metabolic demand, with an upper limit of 40%–50%.[32]
O2ER is almost equal to 1-SvO2when arterial O2saturation (SaO2) is 100%.However, because of the nonnegligible effect of SaO2, SvO2is not considered a good estimator of O2ER in hypoxic individuals.Measuring O2ER thus compensates for SvO2deficits.Negative correlations between increased systemic O2ER and deteriorating microcirculatory parameters including PPV, PVD, and MFI were observed in an animal model of septic shock.[33]In contrast, another animal experiment produced the opposite conclusion, showing no correlation between systemic O2ER and these microcirculatory indicators, despite parallel variations in mesenteric O2ER and jejunal-villi PPV and mesenteric lactate.[33,34]This discrepancy was likely caused by differences in microcirculation perfusion between the two studies.[34]Further research is required to determine the reliability of using O2ER to identify microcirculatory abnormalities.
Parameters of DO2/VO2 dependency
Anaerobic metabolism manifests at the point of DO2/VO2dependency, when DO2is severely compromised but O2ER has reached its upper limit.Anaerobic metabolism products, including lactate and abnormal respiratory quotient (RQ), serve as indicators of persistent hypoxia.
Lactate
Lactate is the end-product of anaerobic metabolism.The generation and clearance of lactate are equal under normal circumstances, maintaining a serum lactate level of around 2 mmol/L.[35]Excess lactate generated by increased anaerobic glycolysis is the primary cause of hyperlactatemia in hypoxic environments, while sepsisinduced aerobic glycolysis is also a significant source of lactate, independent of tissue hypoxia.[36]The underlying mechanisms include epinephrine-dependent activation of Na+-K+-adenosine triphosphatase and inflammatory cytokine-dependent stimulation of cellular glucose uptake, both of which stimulate lactate production in aerobic glycolysis.[37,38]Hyperlactatemia in sepsis is therefore assumed to arise from various sources, not solely due to hypoxia/hypoperfusion.
Despite its complicated production processes, lactate is widely applied in clinical research and practice.Ospina-Tascon et al[39]discovered that decreased lactate following fluid delivery was consistent with improvements in PVD and PPV, with no corresponding changes in cardiac index or mean arterial pressure.A similar correlation between lactate and microcirculation perfusion was reported in septic patients without hypotension.[40]However, clinicians should remain aware that several distinct factors contribute to hyperlactatemia, and lactate only accurately reflects changes in the microcirculation for hyperlactatemia mainly caused by hypoperfusion.[41]
Respiratory quotient (RQ)
RQ is the volume of CO2(VCO2) released divided by the volume of O2(VO2) consumed during metabolism(normal range 0.7–1.0, depending on the types of substrates oxidized).[42]Under hypoxic conditions, RQ is >1.0 because of the anaerobic CO2production.The underlying processes include increased buffering between bicarbonate and H+as a result of lactate accumulation and accelerated highenergy phosphate hydrolysis, and extra CO2produced by decarboxylation of intermediate substrates such as α-ketoglutarate during incomplete oxidation.[43]
RQ measurement currently requires indirect calorimetry, which is costly and vulnerable to patient and environmental conditions, and equipment, thus limiting its practical utility in critical patients.[44,45]According to the Fick equation, VCO2equals the product of blood flow and the difference between venous and arterial CO2content (Cv-aCO2).Likewise, VO2is the product of blood flow and the difference between arterial and venous O2content (Ca-vO2).RQ can thus be determined using the Cv-aCO2/Ca-vO2ratio.Moreover, given the quasi-linear curve between CO2content and CO2tension(PCO2) within a physiological range (Supplementary Figure S2),[46]the easily accessible Pv-aCO2/Ca-vO2ratio is considered a surrogate for the Cv-aCO2/Ca-vO2ratio.
The Cv-aCO2/Ca-vO2(or Pv-aCO2/Ca-vO2) ratio has attracted increasing attention recently.Several studies indicated that an elevated ratio (>1.4) is associated with inadequate lactate clearance, progressive organ dysfunction, and a higher risk of mortality.[47-50]However,the Cv-aCO2/Ca-vO2(or Pv-aCO2/Ca-vO2) ratio was not in excellent agreement with changes at the micro level.An early trial found only a weak correlation between an increased Cv-aCO2/Ca-vO2ratio and a decreased PPV,[51]while another study found no association between the Pv-aCO2/Ca-vO2ratio and peripheral perfusion.[52]However, they pointed out that, even in patients with a higher peripheral perfusion index, those with poor lactate clearance after resuscitation had an obviously elevated Pv-aCO2/Ca-vO2ratio.[52]These results suggested that anaerobic metabolism persisted even as perfusion improved, possibly related to impaired O2utilization.Taken together, the Cv-aCO2/Ca-vO2(or Pv-aCO2/CavO2) ratio is an indicator of tissue O2metabolism, instead of merely microcirculatory perfusion.An increased ratio may be useful for discriminating the inconsistency between tissue perfusion and O2utilization.
Parameters of tissue hypoxia mechanisms
Hypoxia develops when DO2is inadequate for VO2.DO2characterizes the mechanisms of hypoxia as hypoxic (deficient O2supply), anemic (low hemoglobin level), and circulatory (reduced blood flow).Compared with hypoxic and anemic hypoxia, which can be directly identified by variables like SaO2, PaO2, and hemoglobin,the assessment of circulatory hypoxia is more challenging.Intriguingly, Pv-aCO2has been suggested as a potential marker for changes in microcirculation.
Pv-aCO2represents the difference between venous and arterial CO2tensions, and has been confirmed as a valid indicator of cardiac output.[53-55]In physiological settings, sufficient blood flow carries CO2to the alveoli where it is exhaled from the body.In contrast, pathologically reduced blood flow results in the accumulation of tissue CO2, widening the CO2gap between arterial and venous blood, in accordance with the Fick equation: Pv-aCO2=(k×VCO2tissue)/blood flowtissue, wherekis a constant determining the relationship between CO2tension and content(Supplementary Figure S2), and VCO2tissueis the amount of CO2generated by the tissue.
Becausekincreases with the decreased blood flow,the inverse relationship between Pv-aCO2and blood flow is curvilinear; when blood flow is reduced to the lowest range, Pv-aCO2will increase remarkably.[56]However, the curvilinear relationship between PvaCO2and blood flow is easily disturbed in pathological processes, becausekis affected by various factors.[48]The theory of CO2stagnation during decreased blood flow compensates for the Fick equation.[56,57]When both afferent and efferent blood flows in the capillary network are arrested, the increased anaerobic production of CO2from hypoxic tissues leads to increased PvaCO2.In addition, a different theory stated that when blood flow was lowered, PaCO2also fell to adjust to the increased ventilation-perfusion ratio, further raising the Pv-aCO2.[58]These theories may account for the negative correlation between blood flow and Pv-aCO2.
The ability of Pv-aCO2to monitor microcirculatory dysregulation has been studied extensively.A Pv-aCO2>6 mmHg was associated to microcirculatory hypoperfusion in septic patients, manifested by reduced PPV, lower functional capillary density, and higher heterogeneity of microvascular blood flow.[51]Despite a ScvO2≥70%, a Pv-aCO2≥8 mmHg in post-cardiac surgery patients was linked to hepatosplanchnic hypoperfusion, as evidenced by a significantly lower plasma clearance rate of indocyanine green.[59]In addition, in patients who achieved global hemodynamic goals, Pv-aCO2still fluctuated with microcirculatory perfusion while there was no association between Pv-aCO2and cardiac output, demonstrating that Pv-aCO2may be a reliable indicator reflecting microcirculatory flow alterations.[51]
DISCUSSION
This review considers the application of blood gas parameters in microcirculatory monitoring based on the dynamic evolution of tissue hypoxia: (1) reduced SvO2and increased O2ER indicate hypoxia; (2) hyperlactatemia and an elevated Cv-aCO2/Ca-vO2(or Pv-aCO2/Ca-vO2)ratio are signs of deteriorating hypoxia and the emergence of anaerobic metabolism; and (3) parameters including hemoglobin, Pv-aCO2, SaO2, and PaO2may help to distinguish between various hypoxia-causing processes.
Blood gas parameters have certain limitations.First,the parameters essentially reflect global O2metabolism and cannot accurately follow the complex changes within the microvascular environment.Analysis of blood gas parameters must thus be combined with organ-perfusion performance.Second, the parameters are affected by multiple factors; a satisfactory value is never the ultimate target during septic treatment, and only a comprehensive assessment can reveal the tissue metabolism.Despite these limitations, blood gas analysis provides valuable information on tissue O2metabolism, especially when advanced technologies for microcirculatory measurements are not available.
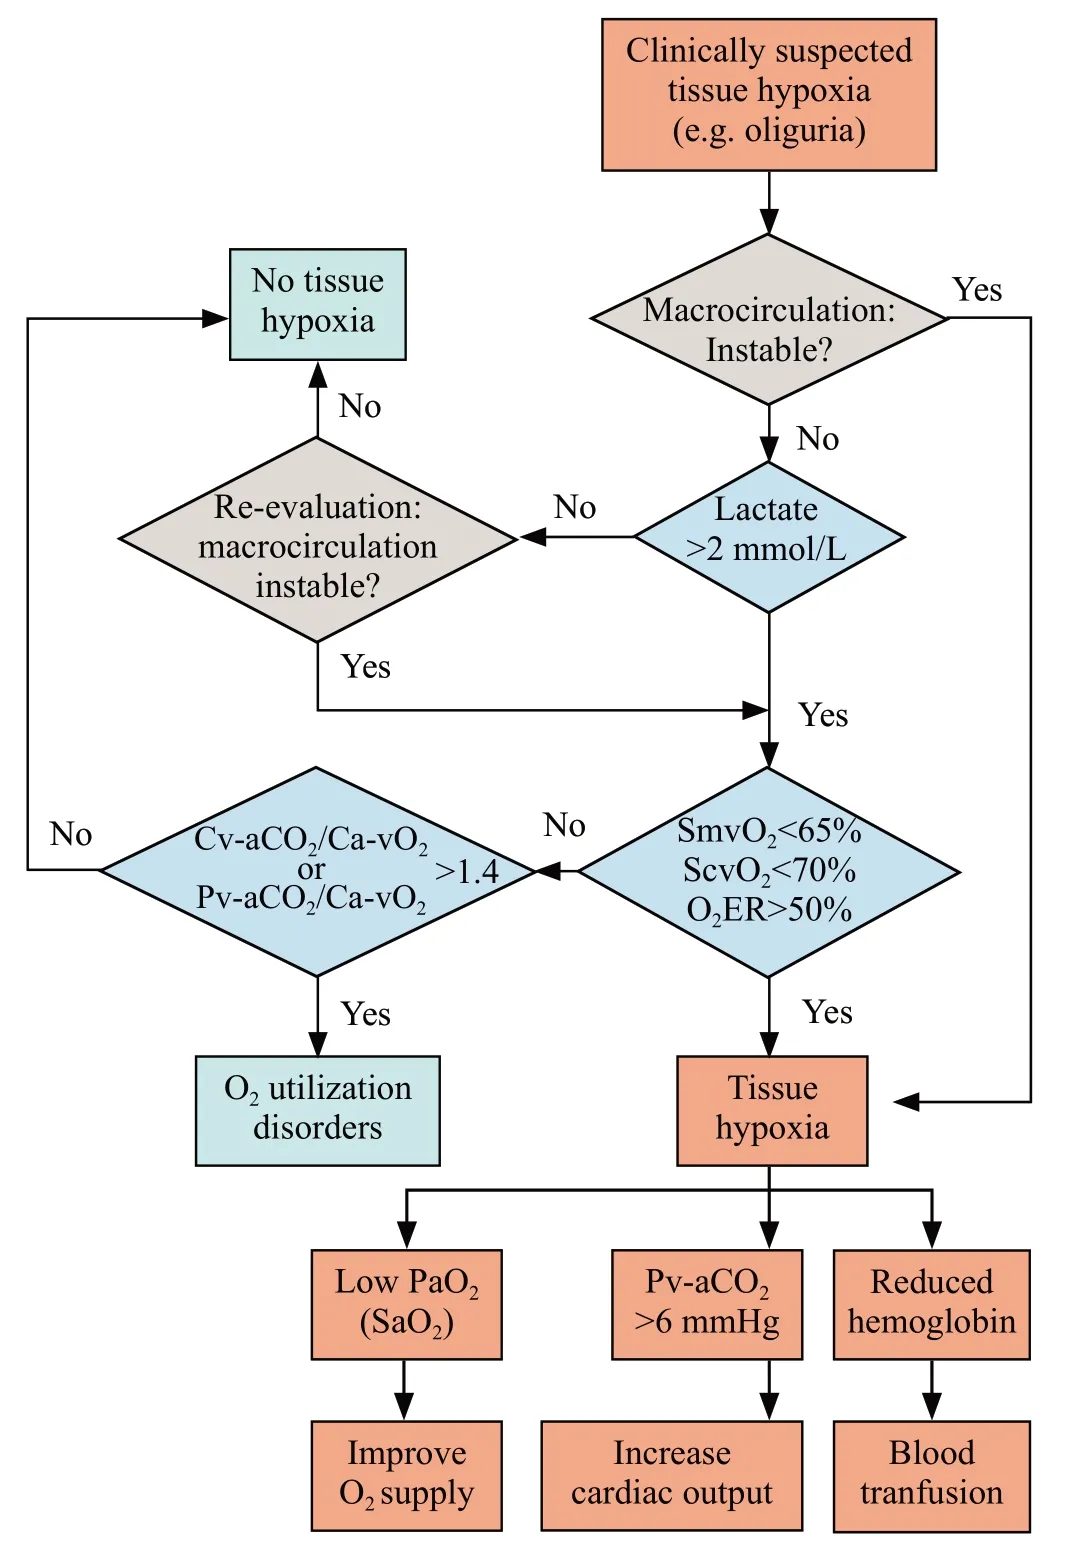
Taken together with medical practice, the recommended interpretation of blood gas analysis is presented in Figure 3.Lactate should be included in the initial clinical evaluation, given that it is acquired from arterial blood, which involves a relatively less-invasive procedure that is readily available in the ED.Notably,physicians need to be aware that interpretations should be combined with clinical judgments, and the ultimate goal of resuscitation is to improve clinical performance,rather than correcting the specific values.
CONCLUSIONS

Figure 3.Integrated interpretation of blood gas analysis in hemodynamic monitoring.O2ER: O2 extraction rate; SvO2: venous O2 saturation; Pv-aCO2: venous to arterial CO2 tension; Ca-vCO2: arterial to venous CO2 content; Ca-vO2: arterial to venous O2 content; SaO2:arterial O2 saturation; ScvO2: central venous O2 saturation; SmvO2:mixed venous O2 saturation.
This review contributes to our understanding of the use of blood gas analysis as a surrogate for visualizing microcirculation and tissue O2metabolism.Despite its drawbacks, evidence suggests that blood gas analysis,combined with clinical performance, provides a feasible and reliable alternative for microcirculatory management.We believe that further insights into the DO2/VO2ratio will help ED physicians utilize blood gas analysis effectively, leading to improved judgments and better decision-making in the treatment of sepsis.
Funding:This work was supported by the grants from Innovation Fund for Medical Sciences (CIFMS) from Chinese Academy of Medical Sciences (No.2021-I2M-1-062); National Key R&D Program of China from Ministry of Science and Technology of the People’s Republic of China (No.2022YFC2304601,2021YFC2500801); National High Level Hospital Clinical Research Funding (2022-PUMCH-D-005, 2022-PUMCH-D-111,2022-PUMCH-B-126); National key clinical specialty construction projects from National Health Commission.
Ethical approval:Not needed.
Conflicts of interest:All authors declare that they do not have any potential conflict of interest in relation to this manuscript.
Author contribution:JYW and JX substantially contributed to the conception and design of the review; JYW was in charge of conducting the literature search, interpreting the results, and producing the initial draft; LW, JX and BD provided critical revisions to the manuscript.The final version of the manuscript was approved by all authors.
All the supplementary files in this paper are available at http://wjem.com.cn.
 World journal of emergency medicine2023年6期
- World journal of emergency medicine的其它文章
- Tension urinothorax as a reversible cause of cardiac arrest: a case report
- A case of pulmonary mucormycosis presented with cardiac arrest
- Pyopneumothorax caused by Parvimonas micra and Prevotella oralis: a case report
- Hemorrhagic pancreatitis from fenofibrate and metformin toxicity: a case report
- The effect of prophylactic antibiotics in acute upper gastrointestinal bleeding patients in the emergency department
- The effects of hyperbaric oxygen therapy on paroxysmal sympathetic hyperactivity after cardiopulmonary resuscitation: a case series
