As New Energy Develops Fast Investment in Distribution Network and the Trend of Carbon Price Become New Hot Spots
As New Energy Develops Fast Investment in Distribution Network and the Trend of Carbon Price Become New Hot Spots
As new energy industry is developing very fast, investment directions also present some changes. Investment in distribution network and the trend of carbon price will become new hot spots. According to the opinion from Li Peng, Deputy Director of State Power Investment Strategic Planning Department, the rapid development of electric vehicles and distributed photovoltaic will require significant investment in distribution networks. The concept was put forth by Li Peng during roundtable discussion in 2023 World Energy Investment released by The International Energy Agency on 20th, September. He explained that rapid growth in investment in new energy in recent years promoted the installation of wind power and PV power. In this context, the architecture and operating mechanism of the power grid needs to be adjusted correspondingly. Electric Vehicle Charging Demands and Access to Distributed PV require flexible and robust distributed networks. Therefore, investments in this field will grow rapidly.
According to the data from China Association of Automobile Manufacturers, in July of 2023, domestic penetration rate of NEV achieved 32.7%; according to the data from National Bureau of Statistics, in the first half of this year, growth in distributed PV installation was 40.96 Gwh, occupying half of the growth in PV installation. Li Peng made additional explanation: some amazing trends occur in the industry, such as the YOY 50% fall in the price of PV components and energy storage battery since the beginning of the year. From the perspective of absolute cost of new energy power generation, China has been equipped with economic base to drive comprehensive energy transformation. The challenge is how to deliver economical and green power energy to consumers and users. “Power generation cost is decreasing but consumers do not feel the decrease”.
In the first half of the year, silicon market cooled down from the RMB 240000/ton to RMB 60000/ton, presenting a decrease of 70%, and leading to a fall in price of the entire industry chain. Despite the climb in price of silicon material, the price of components still fall due to the fact that supplies exceeding demands in industry chain. The bargain on component price is very fierce, and bid price fell from RMB 2/watt at the beginning of the year to current RMB 1.13/watt. In the meantime, lithium price keeps falling. The price fell to low level in this April and maintained at RMB 300000/ton. However, a new round of price decline resulted from the listing of lithium carbonate futures in July. As of September, 20th, lithium spot price fell to RMB 186000/ton, presenting a YOY decrease of 60%. Bid price of energy storage battery system also greatly fell this year due to the fall of lithium price. Based on the statistics of Zhongguancun Energy Storage Industry Technology Alliance, using 2-hour lithium iron phosphate battery energy storage system as an example, the average bid price in August was RMB 1.085/wh, presenting a YOY decrease of 30% and a slight MOM decrease of 2%. The lowest bid price in August was only RMB 0.92/wh, breaking the juncture of RMB 1/wh.
Additionally, Wang Shen, special senior researcher from Beijing Institute of Green Finance and Sustainable Development, provided opinions on the meeting: in the future, the relation between energy price and carbon price is very important. This will influence the investment ratio between clean energy and conventional energy. For example, when carbon price is high, the investments in clean energy will grow.
According to the prediction from IEA, globally, investment in energy will achieve USD 2.8 trillion in 2023, including USD 1.7 trillion of investment in clean energy, presenting a YOY of 24%, including renewable energy electricity, nuclear energy, energy storage and low emission fuel and so on; the remaining USD 1.1 trillion is invested in conventional energy, presenting a YOY increase of 15%. Also based on the prediction, the investment in solar energy this year will surpass that in oil production for the first time. Globally, by region, there will be imbalance in the investment in clean energy. Since 2021, nearly 90% of the growth in the investment in clean energy come from China and EU and developed economies like America. The growth even surpassed total investment in the other regions.
Unit: metric ton

Name of province or cityProduction inAug. 2023Total outputJan.-Aug. 2023% Change2022-2023 Tianjin Hebei Shanxi1153593876-2.78 Inner-Mongolia715205115187.84 Liaoning89187611750.08 Jilin1200782798-11.59 Shanghai Jiangsu2751120532510.79 Zhejiang5138942912612.71 Anhui9900981012412.13 Fujian761055675910.69 Jiangxi17143412595956.23 Shandong12308987062820.18 Henan669134611662.98 Hubei6393050696031.25 Hunan165101185443.19 Guangdong2523320080087.19 Guangxi9620375660118.05 Sichuan16188-13.49 Yunnan601294526342.63 Tibet45335202.69 Shaanxi7424539-15.63 Gansu9354671236932.35 Xinjiang137169152815.17 Total output China1116568840769513.33
Unit: metric ton
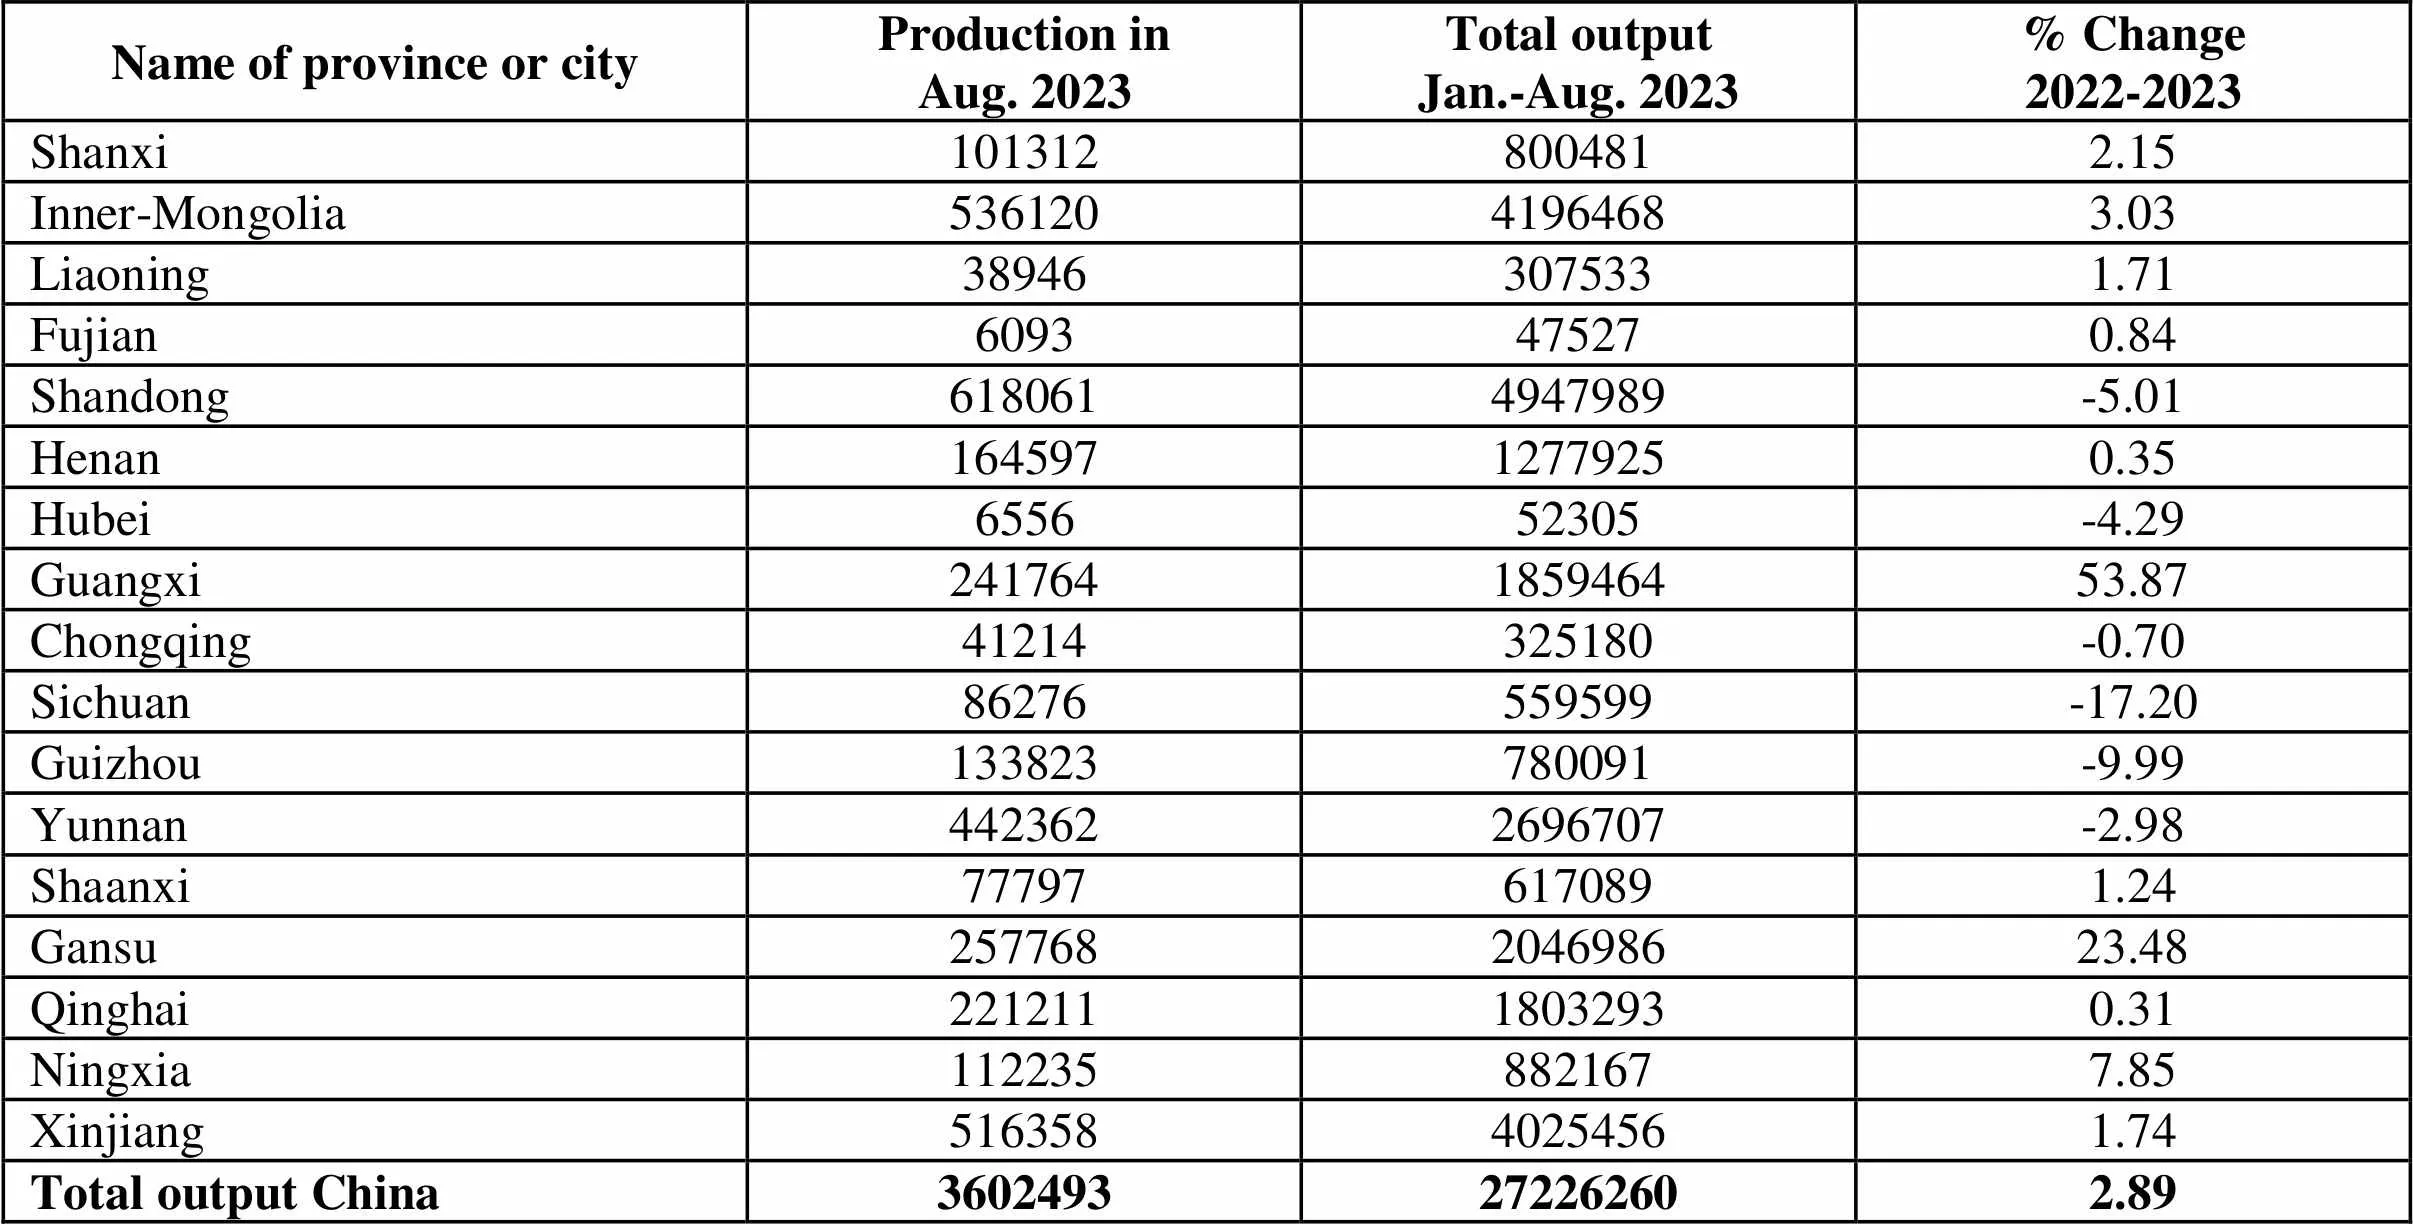
Name of province or cityProduction inAug. 2023Total outputJan.-Aug. 2023% Change2022-2023 Shanxi1013128004812.15 Inner-Mongolia53612041964683.03 Liaoning389463075331.71 Fujian6093475270.84 Shandong6180614947989-5.01 Henan16459712779250.35 Hubei655652305-4.29 Guangxi241764185946453.87 Chongqing41214325180-0.70 Sichuan86276559599-17.20 Guizhou133823780091-9.99 Yunnan4423622696707-2.98 Shaanxi777976170891.24 Gansu257768204698623.48 Qinghai22121118032930.31 Ningxia1122358821677.85 Xinjiang51635840254561.74 Total output China3602493272262602.89
Unit: metric ton

Name of metalProduction inAug. 2023Total outputJan.-Aug. 2023% Change2022-2023 Copper1116568840769513.33 Aluminum3602493272262602.89 Lead619476506863313.65 Zinc54500445376517.07 Nickel Tin Antimony Mercury Magnesium Titanium Total China6293457485603326.77
Unit: metric ton
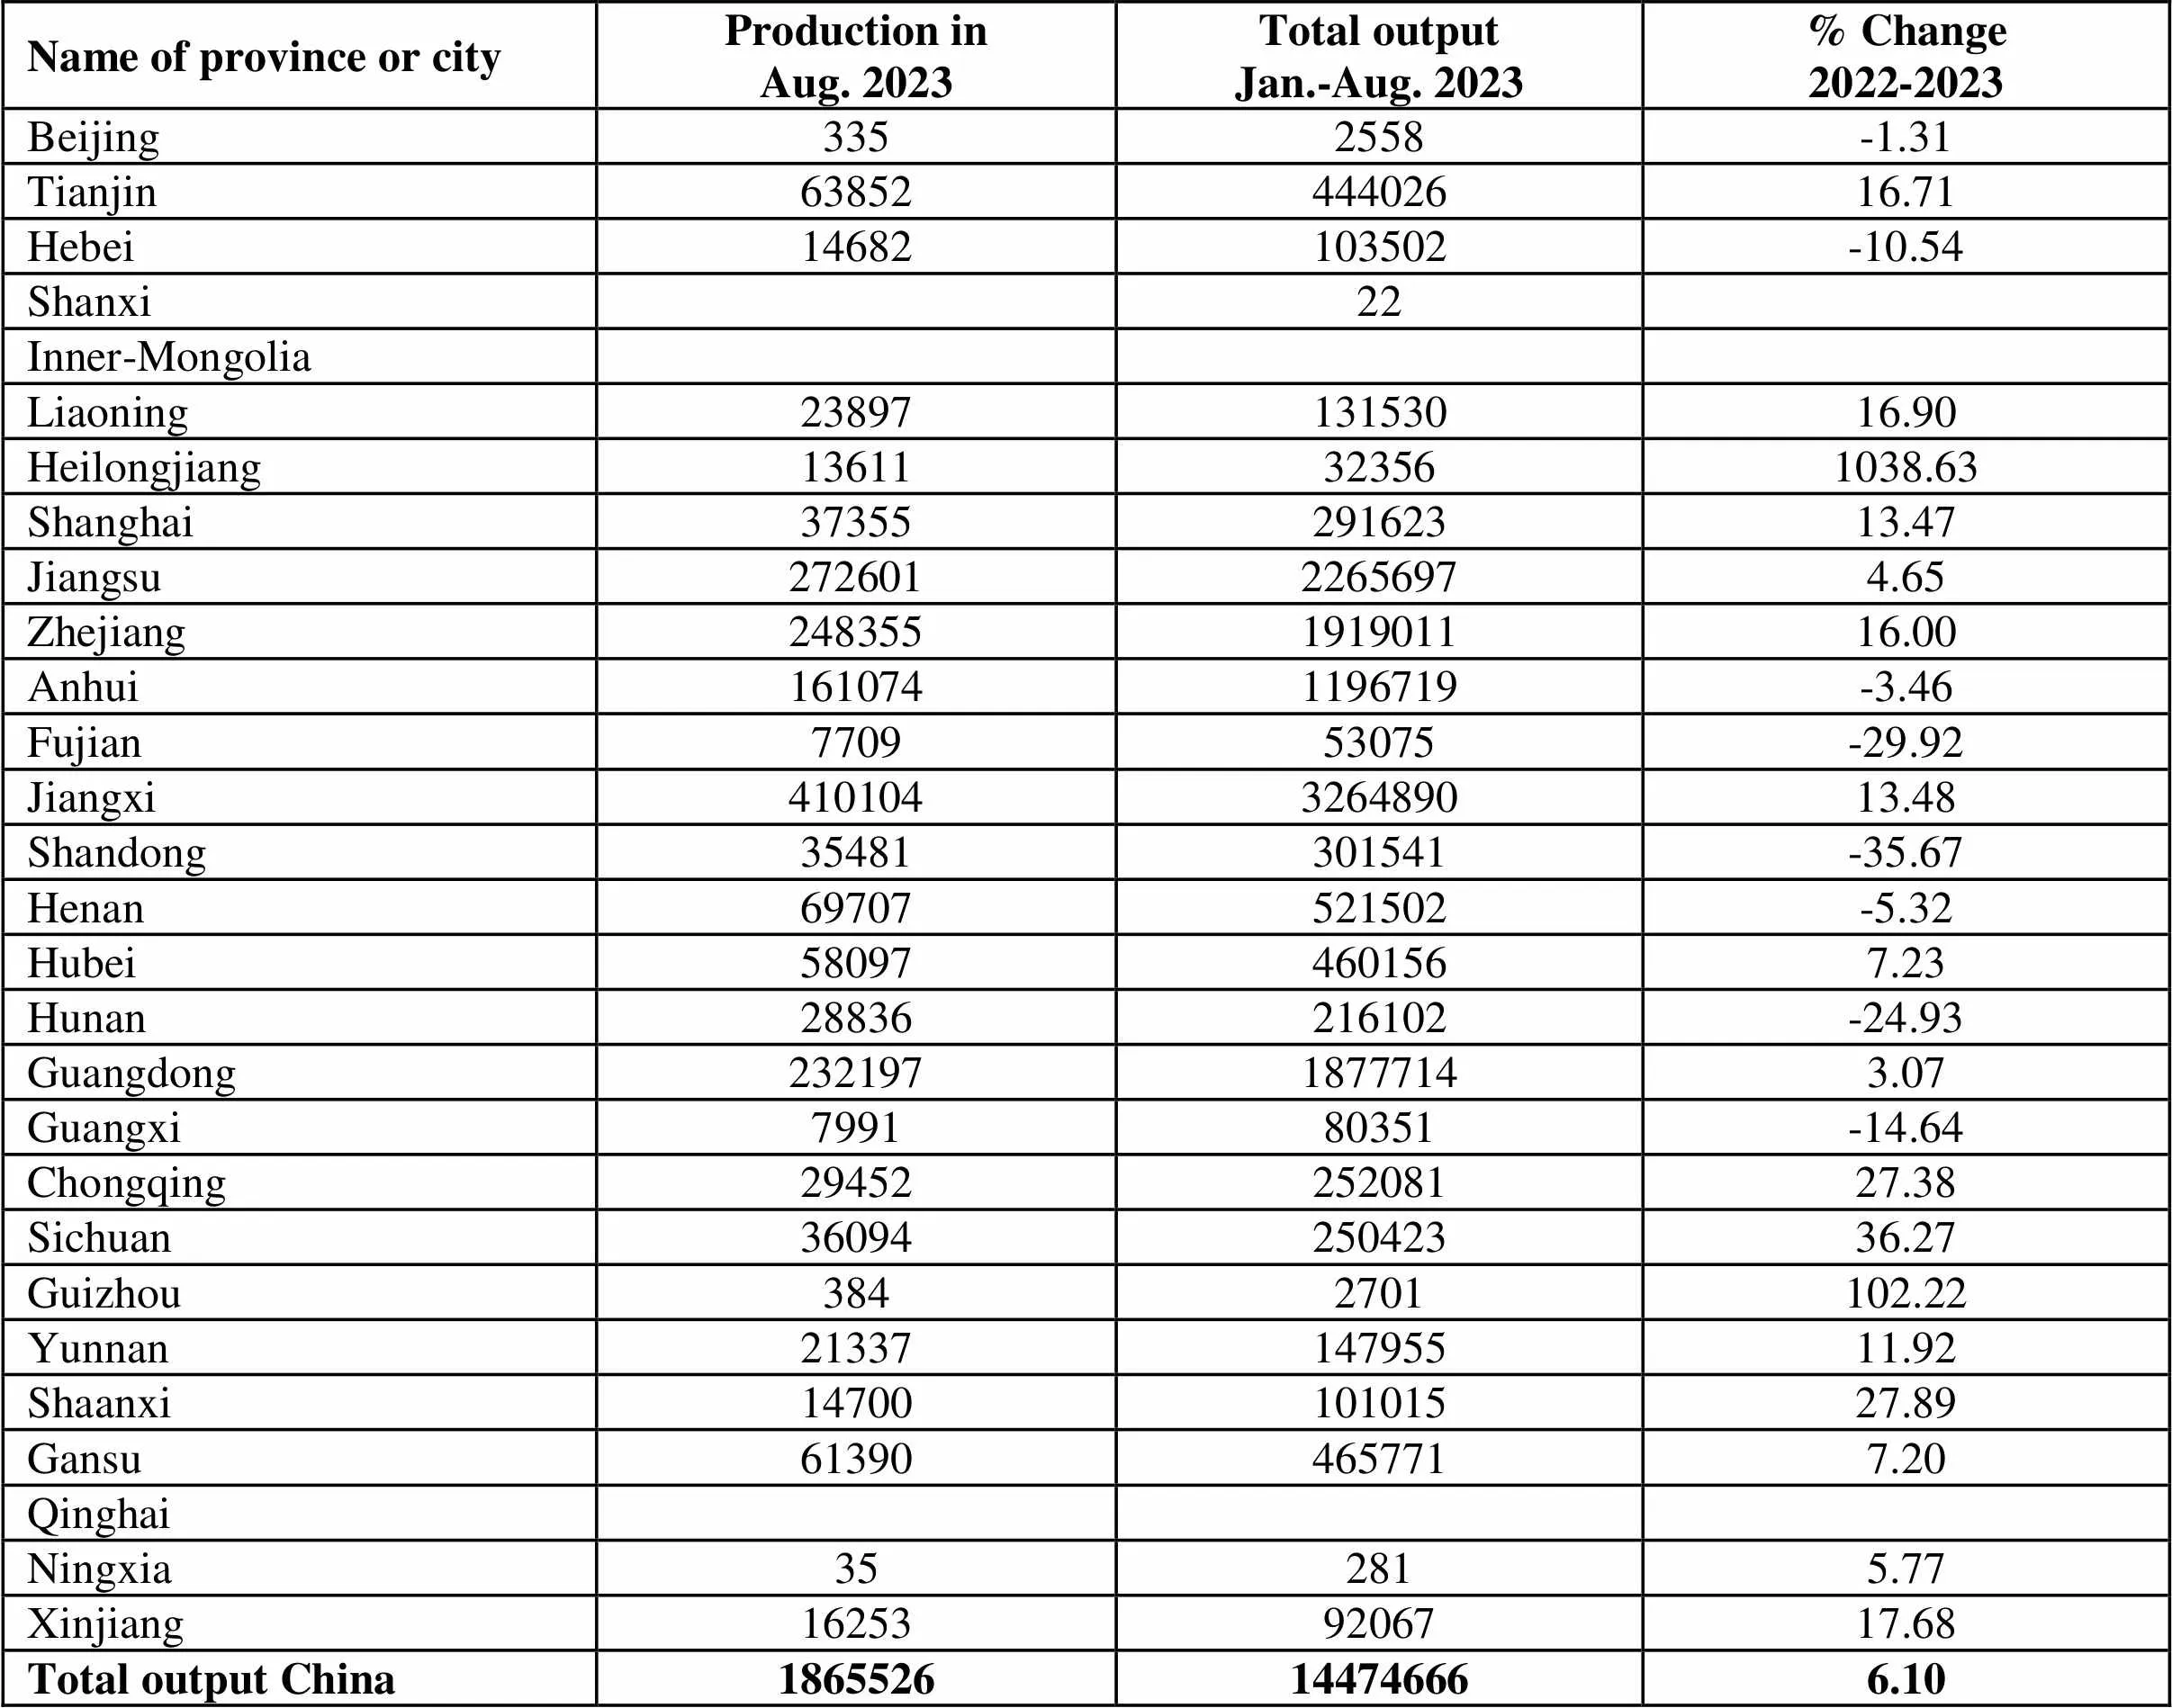
Name of province or cityProduction inAug. 2023Total outputJan.-Aug. 2023% Change2022-2023 Beijing3352558-1.31 Tianjin6385244402616.71 Hebei14682103502-10.54 Shanxi 22 Inner-Mongolia Liaoning2389713153016.90 Heilongjiang13611323561038.63 Shanghai3735529162313.47 Jiangsu27260122656974.65 Zhejiang248355191901116.00 Anhui1610741196719-3.46 Fujian770953075-29.92 Jiangxi410104326489013.48 Shandong35481301541-35.67 Henan69707521502-5.32 Hubei580974601567.23 Hunan28836216102-24.93 Guangdong23219718777143.07 Guangxi799180351-14.64 Chongqing2945225208127.38 Sichuan3609425042336.27 Guizhou3842701102.22 Yunnan2133714795511.92 Shaanxi1470010101527.89 Gansu613904657717.20 Qinghai Ningxia352815.77 Xinjiang162539206717.68 Total output China1865526144746666.10
Unit: metric ton
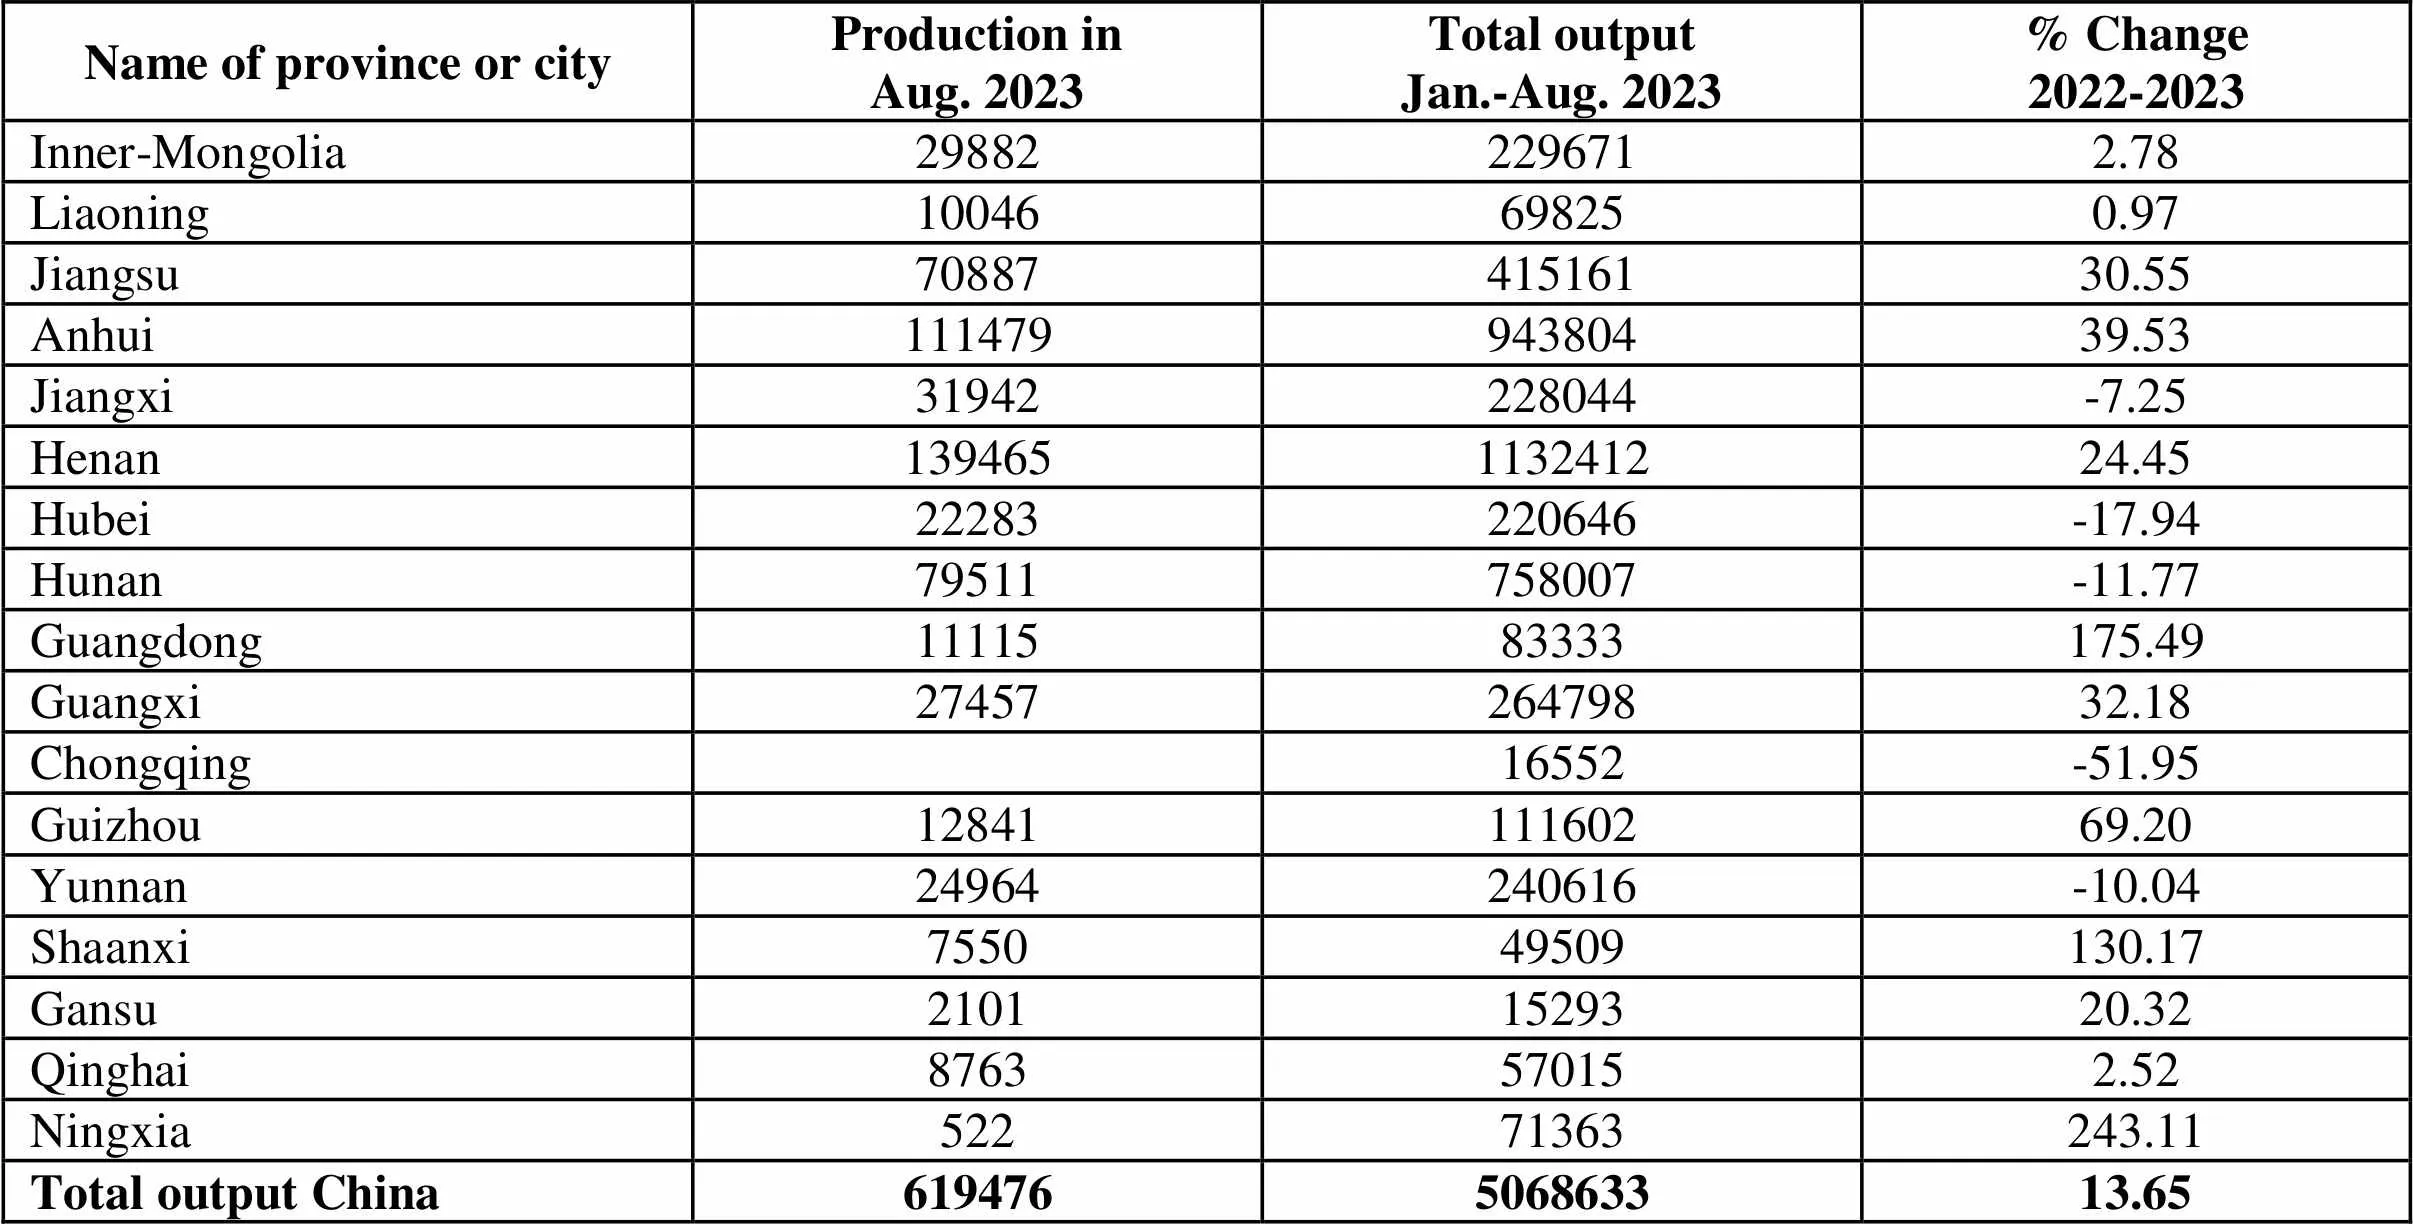
Name of province or cityProduction inAug. 2023Total outputJan.-Aug. 2023% Change2022-2023 Inner-Mongolia 298822296712.78 Liaoning10046698250.97 Jiangsu7088741516130.55 Anhui11147994380439.53 Jiangxi31942228044-7.25 Henan139465113241224.45 Hubei22283220646-17.94 Hunan79511758007-11.77 Guangdong1111583333175.49 Guangxi2745726479832.18 Chongqing 16552-51.95 Guizhou1284111160269.20 Yunnan24964240616-10.04 Shaanxi755049509130.17 Gansu21011529320.32 Qinghai8763570152.52 Ningxia52271363243.11 Total output China619476506863313.65
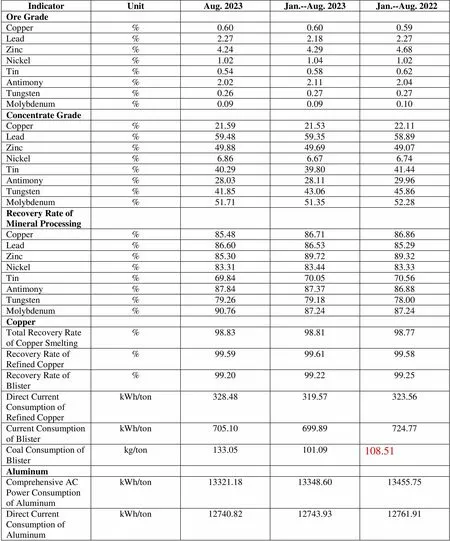
IndicatorUnitAug. 2023Jan.--Aug. 2023 Jan.--Aug. 2022 Ore Grade Copper%0.600.600.59 Lead%2.272.182.27 Zinc%4.244.294.68 Nickel%1.021.041.02 Tin%0.540.580.62 Antimony%2.022.112.04 Tungsten%0.260.270.27 Molybdenum%0.090.090.10 Concentrate Grade Copper%21.5921.5322.11 Lead%59.4859.3558.89 Zinc%49.8849.6949.07 Nickel%6.866.676.74 Tin%40.2939.8041.44 Antimony%28.0328.1129.96 Tungsten%41.8543.0645.86 Molybdenum%51.7151.3552.28 Recovery Rate of Mineral Processing Copper%85.4886.7186.86 Lead%86.6086.5385.29 Zinc%85.3089.7289.32 Nickel%83.3183.4483.33 Tin%69.8470.0570.56 Antimony%87.8487.3786.88 Tungsten%79.2679.1878.00 Molybdenum%90.7687.2487.24 Copper Total Recovery Rate of Copper Smelting%98.8398.8198.77 Recovery Rate of Refined Copper%99.5999.6199.58 Recovery Rate of Blister%99.2099.2299.25 Direct Current Consumption of Refined CopperkWh/ton328.48319.57323.56 Current Consumption of BlisterkWh/ton705.10699.89724.77 Coal Consumption of Blisterkg/ton133.05101.09108.51 Aluminum Comprehensive AC Power Consumption of AluminumkWh/ton13321.1813348.6013455.75 Direct Current Consumption of AluminumkWh/ton12740.8212743.9312761.91
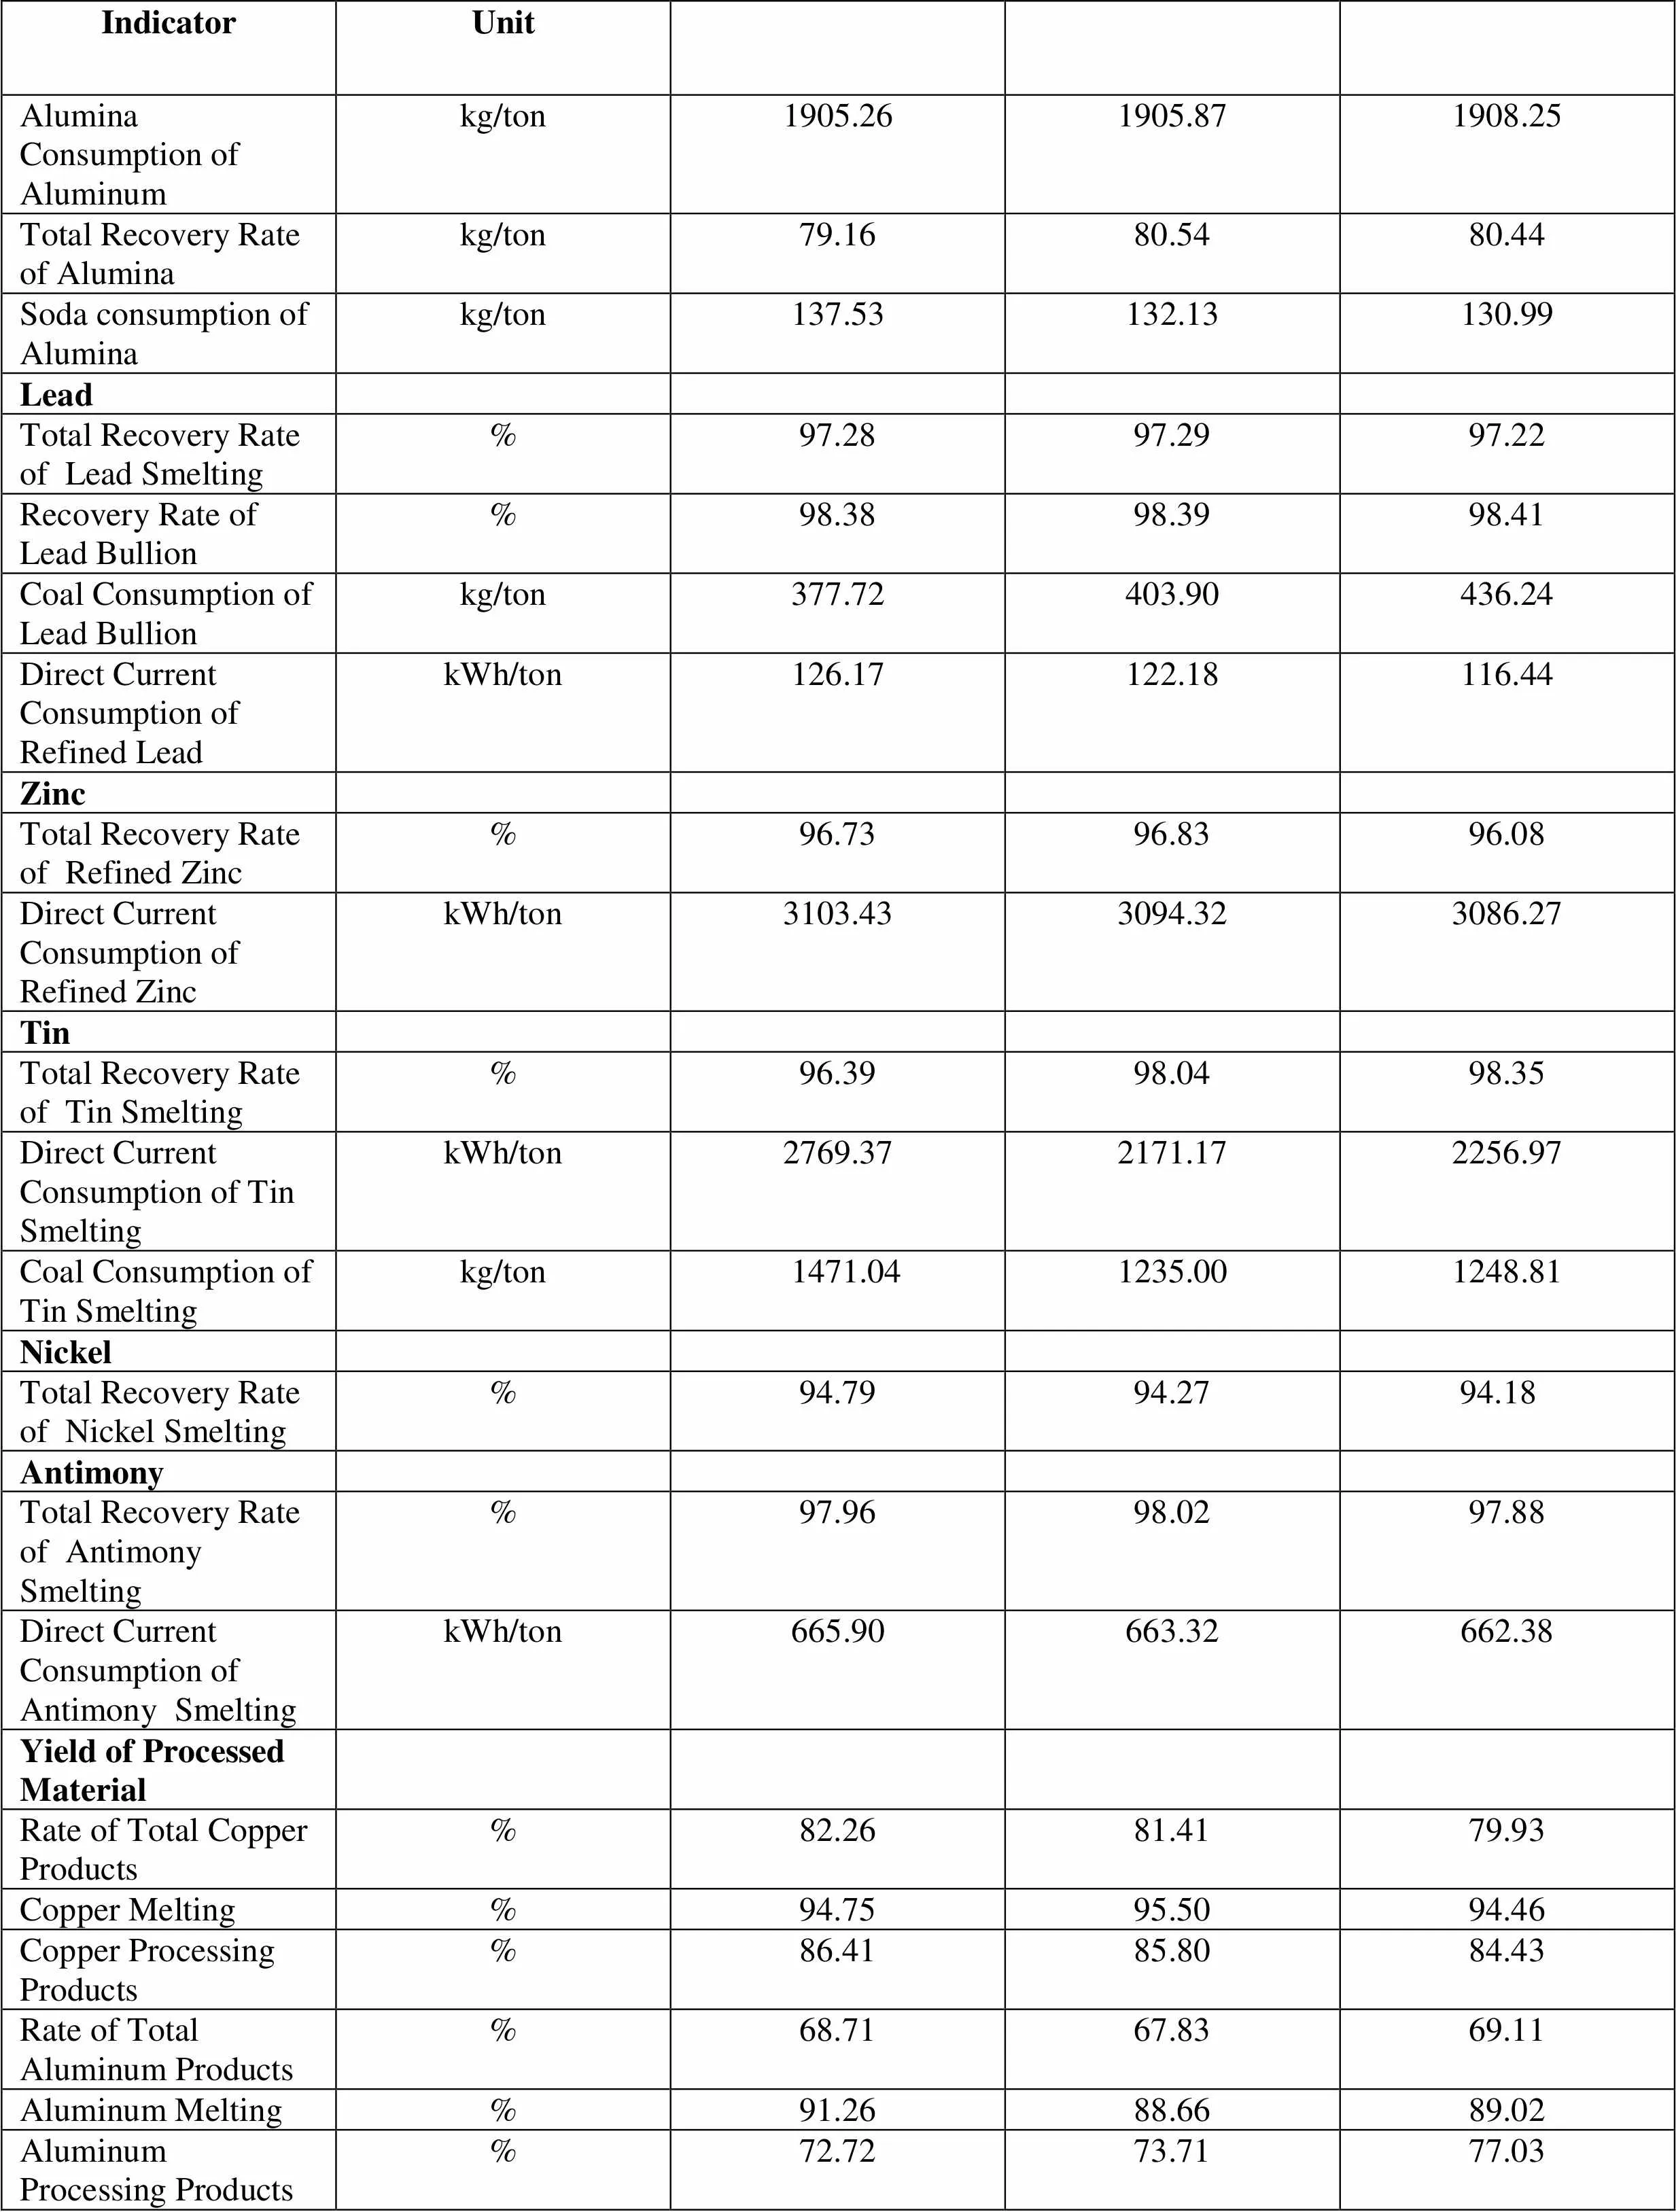
IndicatorUnit Alumina Consumption of Aluminumkg/ton1905.261905.871908.25 Total Recovery Rate of Aluminakg/ton79.1680.5480.44 Soda consumption of Aluminakg/ton137.53132.13130.99 Lead Total Recovery Rate of Lead Smelting%97.2897.2997.22 Recovery Rate of Lead Bullion%98.3898.3998.41 Coal Consumption of Lead Bullionkg/ton377.72403.90436.24 Direct Current Consumption of Refined LeadkWh/ton126.17122.18116.44 Zinc Total Recovery Rate of Refined Zinc%96.7396.8396.08 Direct Current Consumption of Refined ZinckWh/ton3103.433094.323086.27 Tin Total Recovery Rate of Tin Smelting%96.3998.0498.35 Direct Current Consumption of Tin SmeltingkWh/ton2769.372171.172256.97 Coal Consumption of Tin Smeltingkg/ton1471.041235.001248.81 Nickel Total Recovery Rate of Nickel Smelting%94.7994.2794.18 Antimony Total Recovery Rate of Antimony Smelting%97.9698.0297.88 Direct Current Consumption of Antimony SmeltingkWh/ton665.90663.32662.38 Yield of Processed Material Rate of Total Copper Products%82.2681.4179.93 Copper Melting %94.7595.5094.46 Copper Processing Products%86.4185.8084.43 Rate of Total Aluminum Products%68.7167.8369.11 Aluminum Melting%91.2688.6689.02 Aluminum Processing Products%72.7273.7177.03
Unit: metric ton

Name of province Production inAug. 2023Total outputJan.-Aug. 2023% Change2022-2023 Shanxi166860412773330-9.33 Inner-Mongolia 55345-80.67 Shandong2509488195965787.54 Henan7882395725265-17.50 Guangxi1226510925381211.57 Chongqing364855285847937.68 Sichuan2131249628.37 Guizhou4056413200130-1.61 Yunnan11034110251967.33 Total output China7080025545374550.55
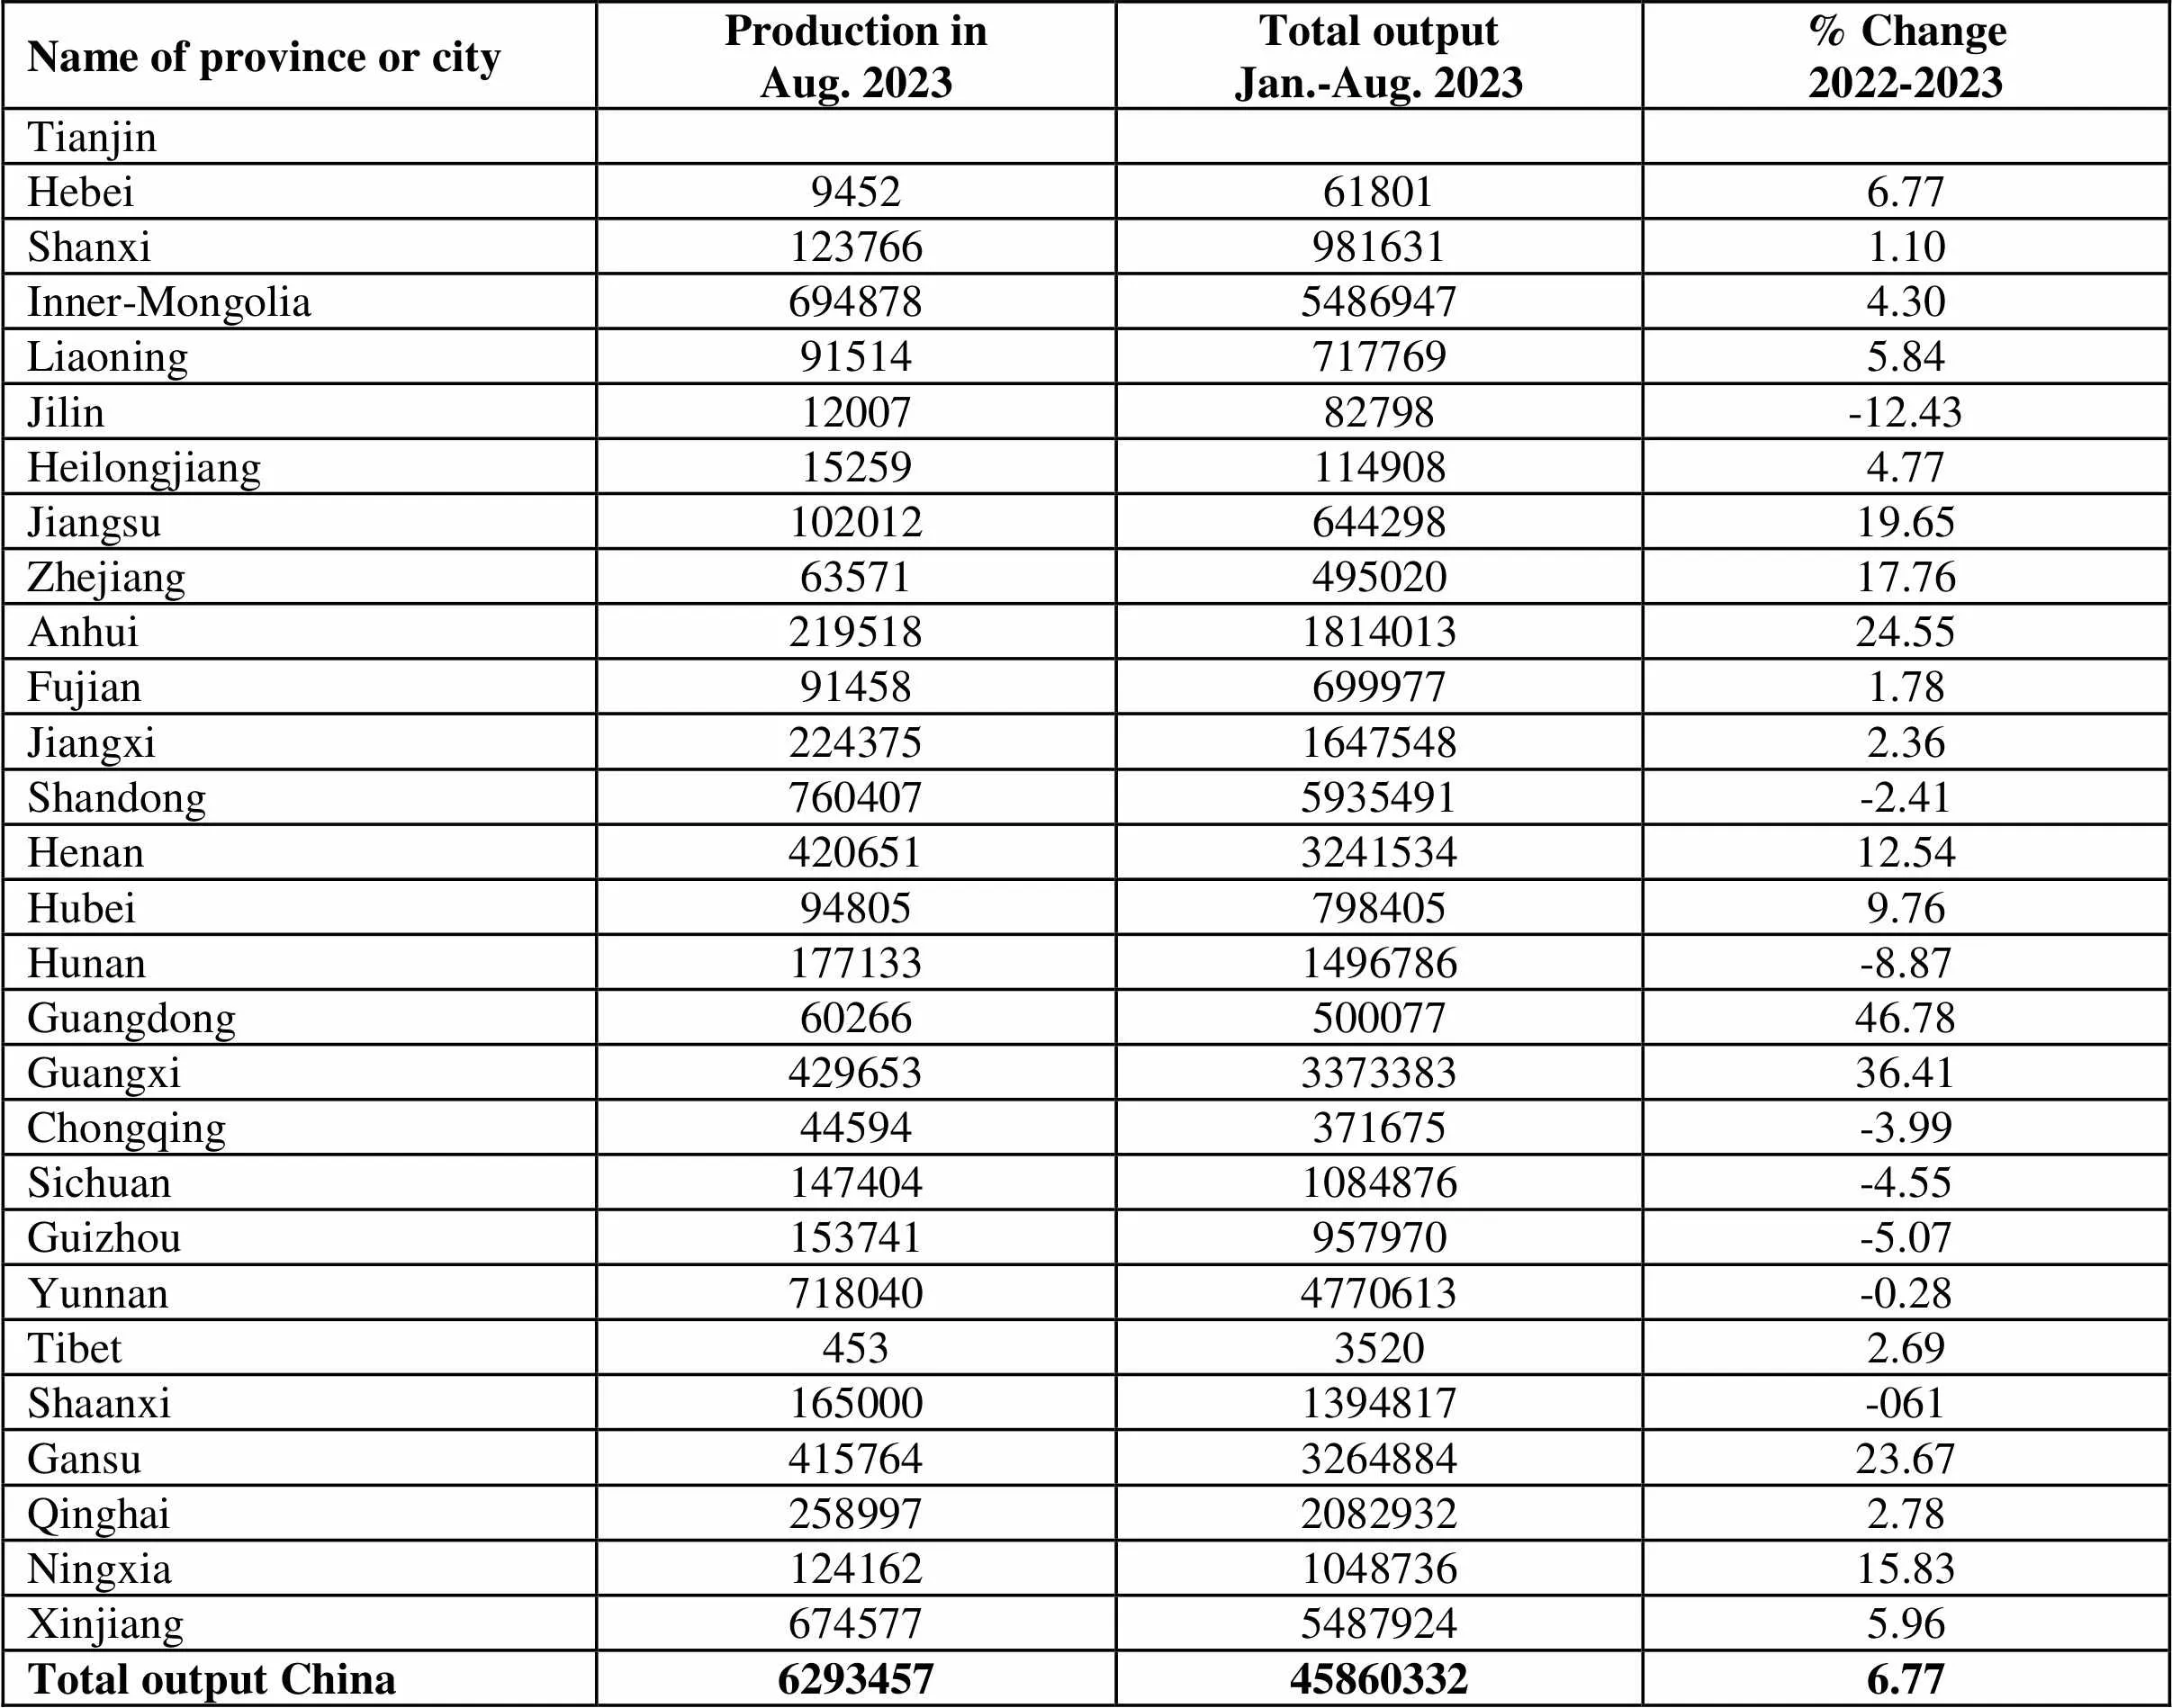
Name of province or cityProduction inAug. 2023Total outputJan.-Aug. 2023% Change2022-2023 Tianjin Hebei9452618016.77 Shanxi1237669816311.10 Inner-Mongolia69487854869474.30 Liaoning915147177695.84 Jilin1200782798-12.43 Heilongjiang 152591149084.77 Jiangsu10201264429819.65 Zhejiang6357149502017.76 Anhui219518181401324.55 Fujian914586999771.78 Jiangxi22437516475482.36 Shandong7604075935491-2.41 Henan420651324153412.54 Hubei948057984059.76 Hunan1771331496786-8.87 Guangdong6026650007746.78 Guangxi429653337338336.41 Chongqing44594371675-3.99 Sichuan1474041084876-4.55 Guizhou153741957970-5.07 Yunnan7180404770613-0.28 Tibet45335202.69 Shaanxi1650001394817-061 Gansu415764326488423.67 Qinghai25899720829322.78 Ningxia124162104873615.83 Xinjiang67457754879245.96 Total output China6293457458603326.77
Unit: metric ton
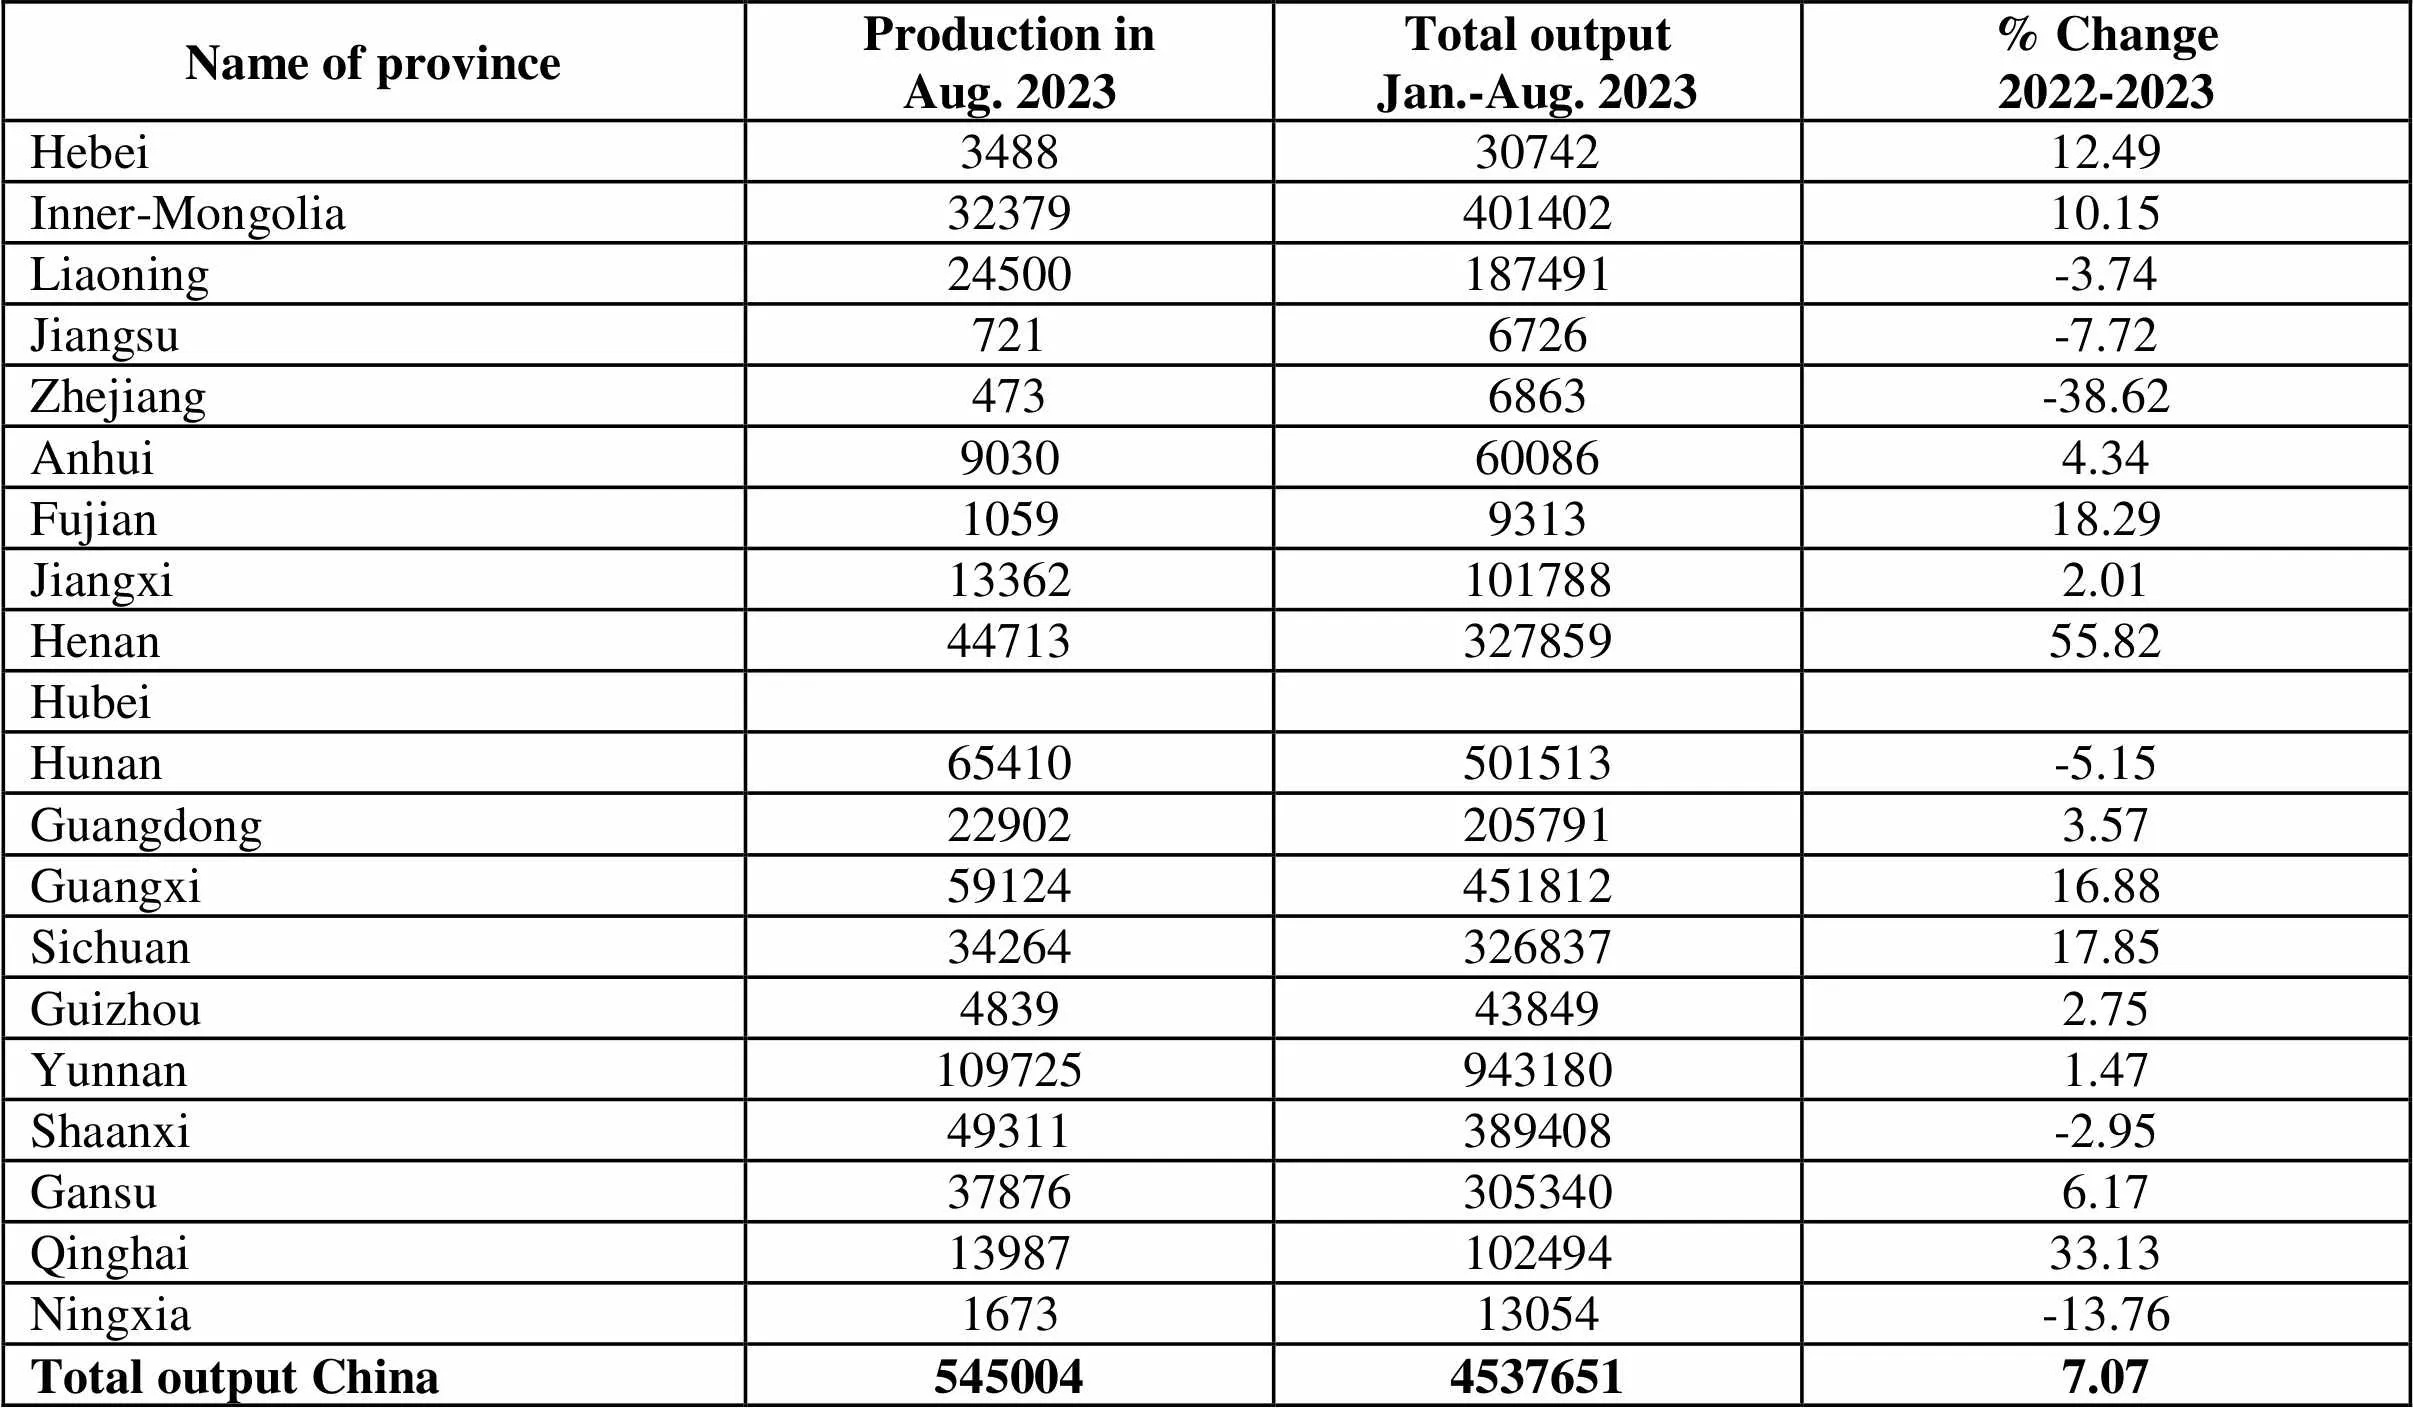
Name of provinceProduction inAug. 2023Total outputJan.-Aug. 2023% Change2022-2023 Hebei34883074212.49 Inner-Mongolia3237940140210.15 Liaoning24500187491-3.74 Jiangsu7216726-7.72 Zhejiang4736863-38.62 Anhui9030600864.34 Fujian1059931318.29 Jiangxi133621017882.01 Henan4471332785955.82 Hubei Hunan65410501513-5.15 Guangdong229022057913.57 Guangxi5912445181216.88 Sichuan3426432683717.85 Guizhou4839438492.75 Yunnan1097259431801.47 Shaanxi49311389408-2.95 Gansu378763053406.17 Qinghai1398710249433.13 Ningxia167313054-13.76 Total output China54500445376517.07
 China Nonferrous Metals Monthly2023年10期
- China Nonferrous Metals Monthly的其它文章
- The Fall of Price Stimulating Demands PV Installation Increasing by Over 150% in China in the First Eight Months
- Export Volume of PV Products Hitting a New Record An Estimation of 20% Increase For the Whole Year
- Sichuan Plans to Construct a World-Class Lithium Battery Industry Base Planning An Output Value of Over RMB 800 Billion by 2027
- Hubei Haigesi Lithium Battery New Material Project Kicking Off the Construction
- Guangzhou Haowei New Energy Making A Total Investment of RMB 10 Billion in Signing Solid-state Battery Project
- The Development and Divergence of Technical Roadmap of Three Major Application Fields of New Energy Batteries
