Thermal stress damage mechanism in single-crystal germanium caused by 1080 nm laser irradiation
Yin-Chuan Sha(沙銀川), Ze-Wen Li(李澤文)?, Zhi-Chao Jia(賈志超),Bing Han(韓冰), and Xiao-Wu Ni(倪曉武)
1School of Science,Nanjing University of Science and Technology,Nanjing 210094,China
2School of Materials Engineering,Jinling Institute of Technology,Nanjing 211169,China
3School of Electronic Engineering and Optical Engineering,Nanjing University of Science and Technology,Nanjing 210094,China
Keywords: thermal stress,single-crystal germanium,fracture,damage mechanism
1.Introduction
The study of laser interaction processes with semiconductor materials and the corresponding damage mechanisms has been a popular research area and is receiving increasing attention.As an important substrate and infrared window material,single-crystal germanium has important applications in photodetectors, infrared systems, solar cells and other fields.[1-3]With the development of laser processing technology,the use of lasers for punching, slotting and scribing germanium has also become a reality.[4-8]Compared with millisecond lasers,short-pulse lasers such as femtosecond and picosecond lasers have superior processing quality.However,the laser energy is easily shielded due to the plasma produced by the high power density, thus reducing the efficiency of the process.The use of millisecond lasers will solve these issues.However,singlecrystal germanium is subject to thermal stress damage during millisecond laser ablation due to its inherent brittleness,which reduces the yield rate of the process and the reliability of the subsequent product made of germanium.Therefore, study of the thermal stress damage process and mechanism of laser ablation of single-crystal germanium is of great importance for laser processing of germanium materials and products.
Laser thermal stress damage to semiconductor silicon,such as slip and fracture, has been reported extensively and studied in various ways.Choiet al.used an optical deflection method to probe the ablation process of single-crystal silicon under continuous laser ablation at 1070 nm in real time and showed that the optical deflection method can effectively detect the onset of slip.[9]In addition,they used numerical simulations to obtain the moment of slip onset by comparing thermal stress and yield strength and verified their numerical results experimentally.[10]Liet al.investigated anisotropic thermal stresses in single-crystal silicon using experimental and numerical simulations.Their results showed that thermal slip occurs because the thermal stresses exceed the critical yield stress.[11]Experimental and numerical simulations of thermal stresses in millisecond laser-induced silicon by Xiet al.found that both melt damage and cracks(thermal stress damage)appeared on the sample surface when the laser power density reached 259 J·cm-2.[12]Jiaet al.conducted an experimental and numerical simulation study of laser ablation of singlecrystal silicon by using a high-speed charge-coupled device(CCD)to receive an amplified sample surface morphology in real time, demonstrating that thermal stress damage occurred both during and after the laser action,and that the second stage of thermal stress damage caused by the resolidification of the molten liquid was more severe.[13,14]
The aforementioned studies mainly focused on the thermal stress damage to single-crystal silicon by a laser, while little research has been reported on the thermal stress damage to single-crystal germanium.In this paper, a high-speed CCD will be used to record the process of laser ablation of single-crystal germanium at a wavelength of 1080 nm in real time.The damage morphology of the ablated sample will be observed with an optical microscope.A three-dimensional numerical model based on Fourier’s heat conduction equation,Hooke’s law and the Alexander-Hasson(AH)equation will be developed to calculate the temperature, stress and dislocation fields during and after the laser action.The dislocation distribution on the sample surface after laser ablation at different power densities is quantitatively investigated and the dislocation density at specific locations is analyzed over time.
2.Experimental setup
The experimental setup for recording the stress damage due to 1080 nm laser ablation of single-crystal germanium in real time is shown in Fig.1.The experimental setup can be divided into an ablation light path section and a detection light path section.The ablation light path uses a continuous fiber laser with a wavelength of 1080 nm, which is focused on the sample surface by a convex lens with a focal length of 100 mm and a spot diameter of 2 mm, with a fixed ablation time of 10 ms.The laser beam has a Gaussian power distribution with M2 less than 1.30.The power density of the probe laser is negligible compared with that of the ablation laser.On the other side of the ablation path a high-speed CCD is used to receive the probe beam and an infrared filter is placed in front of the CCD to avoid interference from the irradiating laser.The highspeed CCD has a recording time of 1 s and records 500 frames per second.A DG535 time delay trigger is used to connect the ablation and detection light paths.In order to remove the oxygen from the sample surface and to minimize the effect of the black smoke from the oxidation of the sample on the realtime recording process,the laser irradiation is accompanied by a side blast of low-velocity nitrogen gas at~10 m·s-1in the tangential direction of the sample.
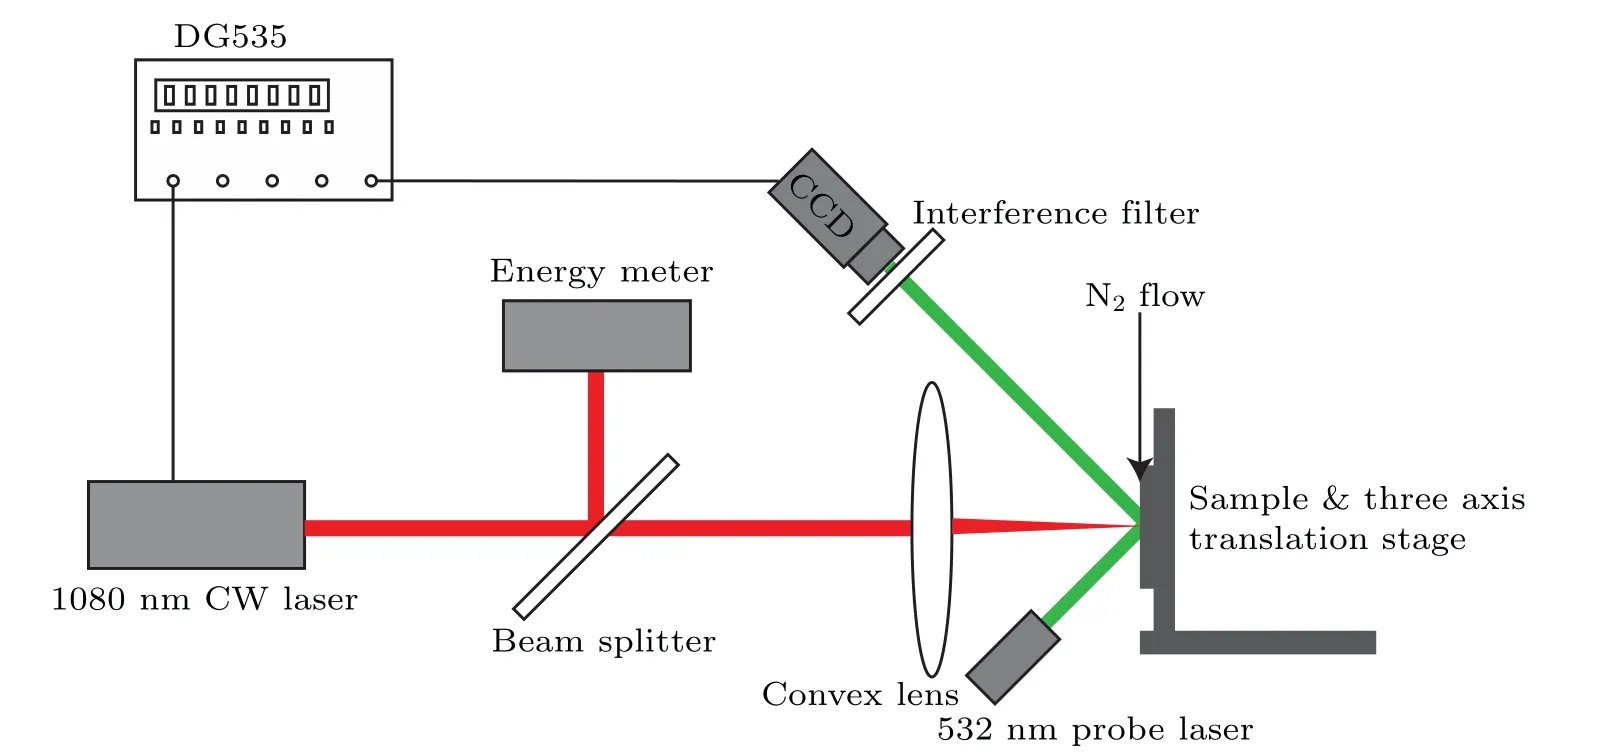
Fig.1.Diagram of the experimental setup.
The sample used in this experiment was a square singlecrystal germanium sheet with a side length of 10 mm and a thickness of 175 μm, without any doping.Five separate experiments were performed for each different laser energy density.The ablated samples were examined with an optical microscope to observe the damage morphology of the ablated samples.
3.Experimental results
Overall,the experimental results can be divided into three types based on the different damage morphologies.A typical comparison of the damage morphology of the sample surface after laser ablation at different energy densities is shown in Fig.2.

Fig.2.Typical damage profile of a sample surface after laser ablation.
In type 1 damage morphology the laser energy density was 0-12 J·cm-2, at which point no visible signs of damage occurred on the surface of the sample after laser ablation(Fig.2(a)).In type 2 damage morphology the laser energy density was 21-201 J·cm-2.In this case, the surface of the sample melted and a black molten pool area appeared on the surface of the sample after cooling at the end of laser ablation(Fig.2(b)).The high-speed CCD real-time recording process did not record the formation of cracks,fragments flying out or other phenomena.Type 3 damage morphology was seen for laser energy densities≥212 J·cm-2.In this case,high-speed CCD recording of the damage process shows that the laser ablation causes melting of the sample surface,and a few dozen to several hundred milliseconds after the end of ablation cracks suddenly appear in the sample surface,accompanied by fragments flying out and other phenomena.The damage to the sample surface after ablation is shown in Fig.2(c), with the black center being the melting pool area after cooling.Several irregular notches can be seen at the edge of the melting pool(red ovals in Fig.2(c)),which are the traces left by the flying fragments,also accompanied by the formation of cracks.
Figure 3 is a high-speed CCD real-time recording of a set of damage morphologies with time, corresponding to a laser energy density of 212 J·cm-2,that is,type 3 damage morphology.The laser starts to emit light at 0 ms, Fig.3(a) corresponds to 0 ms, when the laser has not yet started to ablate the sample and only the detecting laser spot can be seen on the sample surface.Figure 3(b) corresponds to 12 ms, when the ablation laser has just finished its action.It is important to note that although the laser ablation time is 10 ms,the 10 ms image is overexposed due to the flames and flashes generated during the ablation process,so we have taken the 12 ms image as the surface profile of the sample at the end of the lasing.A black circular area can be seen inside the probe spot,which is the area of the melting pool left by laser ablation of the sample surface.At this point, cracks have not yet appeared and the faint black area at the edge of the melting pool represents some of the black smoke produced by the ablation process.Figure 3(c)corresponds to a time of 182 ms.The ablation area has not changed except for the black smoke floating above the surface of the sample.In Fig.3(d), taken at 184 ms, a black cracked area suddenly appears at the edge of the melting pool on the surface of the sample,whereas there was no such black cracked area in the previous frame.This indicates that the crack appeared very quickly and that their formation process took less than 2 ms.Figure 3(e)corresponds to 186 ms,when,in addition to the black cracked area that appeared before, a small black dot appears on the edge of the detection spot.Finally, Fig.3(f) represents the situation at 1000 ms when the surface of the sample has stabilized and there is no significant change in the melting pool or the crack,apart from some black smoke.
The damage process described above shows that the melting pool appears during ablation of single-crystal germanium by a 1080 nm fiber laser, while the cracks appear during the cooling of the sample,a phenomenon similar to the stress damage caused by laser ablation of single-crystal silicon.[13]
In order to further study the law of crack formation, the moments of crack emergence corresponding to different energy densities were analyzed and the results are shown in Fig.4.It can be seen from the figure that the moments when cracks appear vary greatly for the same energy density;there is no obvious pattern for the time of crack appearance for different energy densities(this conclusion is subject to further study for different ablation times and different sample sizes).This result shows that the moments at which cracks appear have a certain randomness,which is not related to the energy density of the laser but only to the nature of the material,such as defects and other factors.The defects themselves are random,which also leads to a randomness in the moment of crack appearance.It should be noted, however, that the randomness of the moment of crack occurrence does not mean that the appearance of cracks is completely random; from the results of the whole experiment,it is only when the laser energy density reaches or exceeds the damage threshold that cracks start to appear.Furthermore, as can be seen from Figs.2 and 3, the formation of cracks is accompanied by a process of fragments flying out.The flying out of the fragments should be part of a violent stress and energy release process,which is when the cracks first start to form, and then the cracks expand in the direction of the concentration of stress, so the location of the flying out of the fragments can be considered as the point of crack initiation.
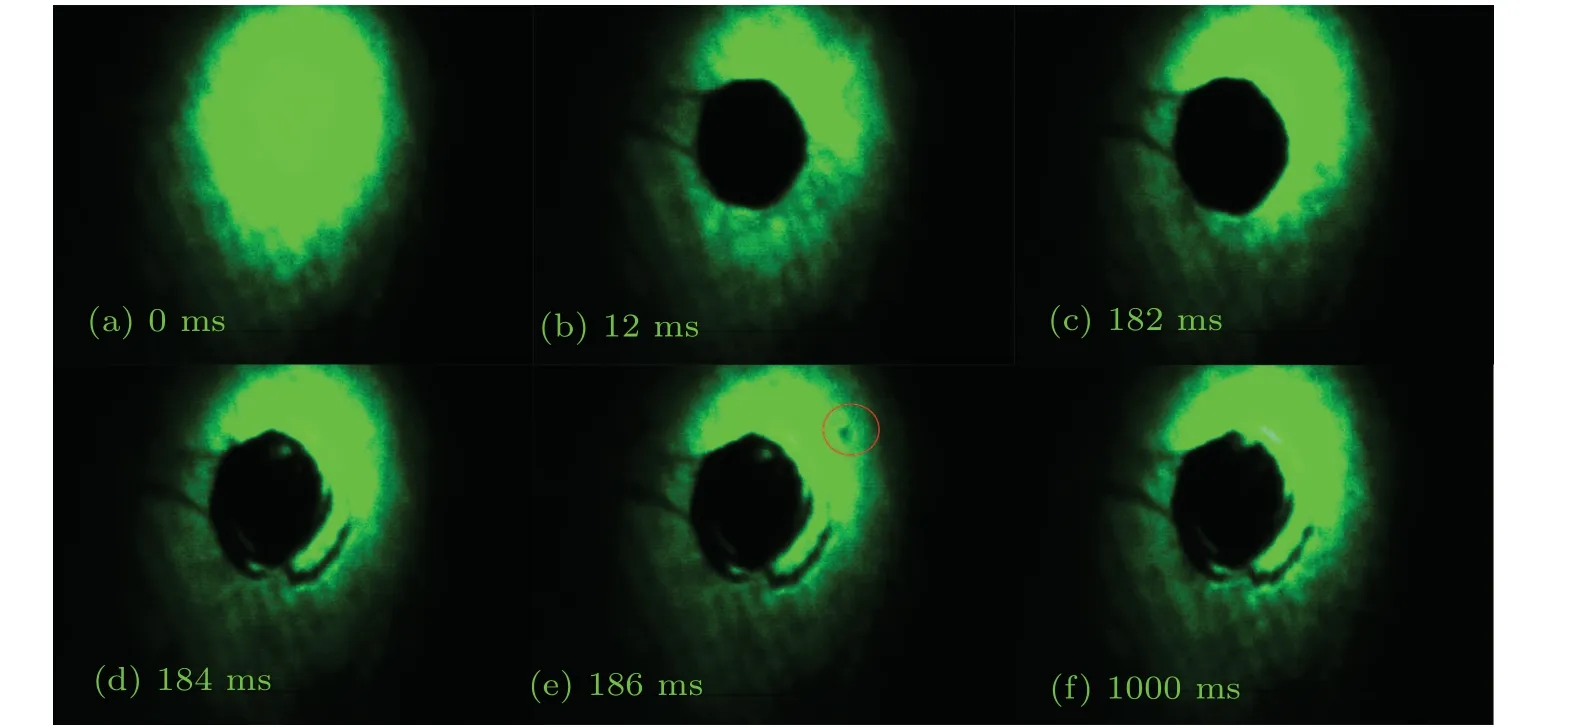
Fig.3.Real-time damage process on samples subjected to laser ablation at 212 J·cm-2.The laser ablation time was 10 ms.
4.Numerical simulation
In order to further investigate the physical process and damage mechanism of laser ablation of single-crystal germanium, a numerical simulation model as shown in Fig.5 was developed.The Gaussian incident laser irradiates vertically onto the (001)surface of the sample.The sample is a square single-crystal germanium sheet with a side length of 10 mm and a thickness of 175μm.TheX,YandZaxes correspond to the crystal directions[100],[010]and[001],respectively.
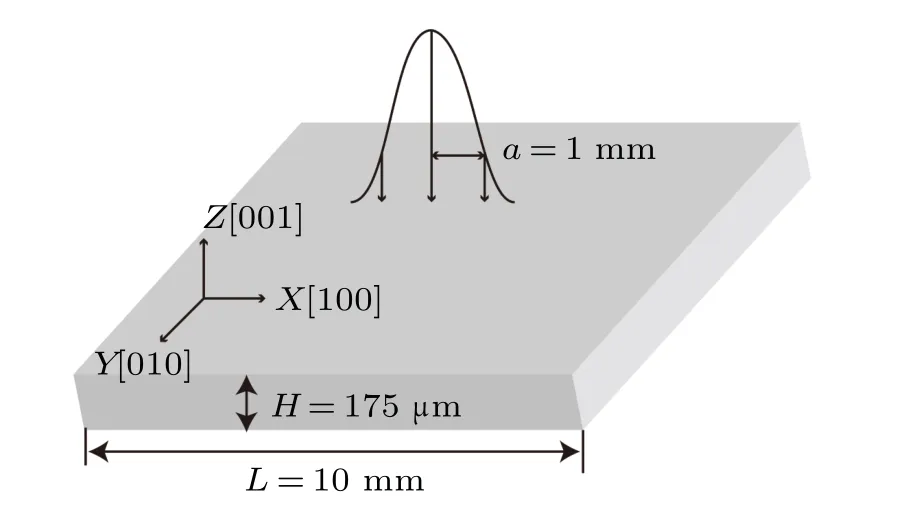
Fig.5.Numerical simulation diagram of 1080 nm laser ablation of single-crystal germanium.
The temperature fieldT(x,y,z,t) of the sample subjected to laser ablation can be derived by solving the three-dimensional Fourier heat conduction equation as follows:[15,16]
whereρ,candkdenote the density,specific heat capacity and thermal conductivity of the material, respectively, andQrepresents the laser heat source.
The absorption depth of single-crystal germanium for a 1080 nm laser at room temperature is very shallow and negligible compared with the spot diameter.Therefore,to simplify the calculations, this model simplifies the heat sourceQto a surface heat source,denoted as
whereI0is the power density of the incident laser at the spot center,Rrepresents the reflectivity of the single-crystal germanium,andf(x,y)andg(t)denote the spatial and temporal distributions of the laser,respectively.For a Gaussian laser,I0andf(x,y)can be written as
wherePdenotes the laser power at the sample surface andais the spot radius at the sample surface.
When the temperature of the sample rises to the melting or boiling point,the material undergoes two phase change processes.In order to simulate the phase change processes, this model will use the equivalent specific heat capacity method to correct for the specific heat capacityc.The equivalent specific heat capacitycecan be expressed as[15]
whereHmandHvrepresent the latent heat of melting and latent heat of vaporization of the material, respectively, andδmandδvare pulse smoothing functions that can be expressed as[15]
whereTmandTvare the melting and boiling points of the material,respectively and ΔTm,vis the pulse width,set at 10 K.
When a sample is thermally expanded, thermal stresses and thermal strains are developed within the material due to internal and external constraints.For single-crystal germanium, the stress{τ}T=[σx σy σz τyz τxz τxy] and strain{ε}T=[εxx εyy εzz γyz γxz γxy] relationship can be expressed by the generalized Hooke’s law[17-19]
whereαTis the coefficient of thermal expansion,is the plastic strain tensor component, ΔTrepresents the temperature rise andE,ν,Gare Young’s modulus,Poisson’s ratio and the shear modulus, respectively.When the material temperature rises above the melting point, Young’s modulus is set to a value of 100 (~1011at room temperature) to describe the stress relief process caused by the phase change.[19]
In addition to elastic deformation, plastic deformation also occurs during temperature rise of a material.[20-26]Microscopically, plastic deformation occurs when microdefects within the material proliferate, a phenomenon that is irreversible, and we can study this process by modelling the change in dislocation density.Therefore, the AH equation is introduced in this model to calculate the dislocation field during the temperature rise process.The dislocation multiplication process can be expressed as[20-25]
whereNrepresents the dislocation density of the material and its initial value is set to 100 m-2,irepresents the current slip system,jrepresents the other slip systems,KandK?represent the material constants,Arepresents the hardening factor.νrepresents the slip velocity of the dislocation and is the effective stress,respectively expressed as
whereQ0is the excitation energy of the dislocation,kBis the Boltzmann constant,ν0andmare material constants,τeffis the effective stress,τis the shear stress,bis the Burgers vector,andβandβ?are material constants which characterize the strength of the interaction.
Single-crystal germanium is an anisotropic crystal with 12 slip systems.However,due to its symmetry and in order to simplify calculations,only the S1(111)[ˉ101]and S3(111)[01ˉ1]slip systems are considered in this model.The specific values of the relevant parameters and a more detailed modelling procedure can be found in Ref.[26].
5.Numerical simulation results and discussion
When the laser energy density is low, physical phenomena such as slipping and melting on the surface of semiconductor materials have been reported in a large body of literature from both experimental and numerical simulations.These results are broadly similar and the mechanisms are the same,and these will not be repeated in this paper.Here we first look at the overall trend in the dislocation field.Figure 6 shows a plot (from numerical simulations) of the laser energy density versus the maximum dislocation density in the sample at the end of the laser.As shown in this figure, the maximum dislocation density increases with increasing laser energy density.The experimental results show that when the laser energy density is≥212 J·cm-2,cracks will appear on the surface of the sample after the laser action.The increase in dislocation density will lead to more defects in the sample,which will reduce the fracture strength of the material and facilitate the formation of crack initiation points,thus providing the necessary conditions for fracture to occur.Although there is no order of magnitude difference in dislocation density between the simulated results at 212 J·cm-2and 201 J·cm-2, this increasing trend suggests that crack formation requires the accumulation of a certain amount of laser energy before it can occur.This process is similar to the generation of laser damage thresholds,so we propose dislocation fracture thresholds(Dth)to describe this cumulative process.Figure 6 corresponds to a dislocation fracture threshold of 2.4×10¹⁴m-2, which indicates that the maximum dislocation density in the sample needs to increase to 2.4×10¹⁴m-2in order for the sample to fracture under the parameters in this paper.It should be noted that the dislocation fracture threshold is dependent on the laser parameters and material parameters as well as temperature.Furthermore,there is no relationship between the moment of fracture and this threshold.These findings are in agreement with the experimental results.
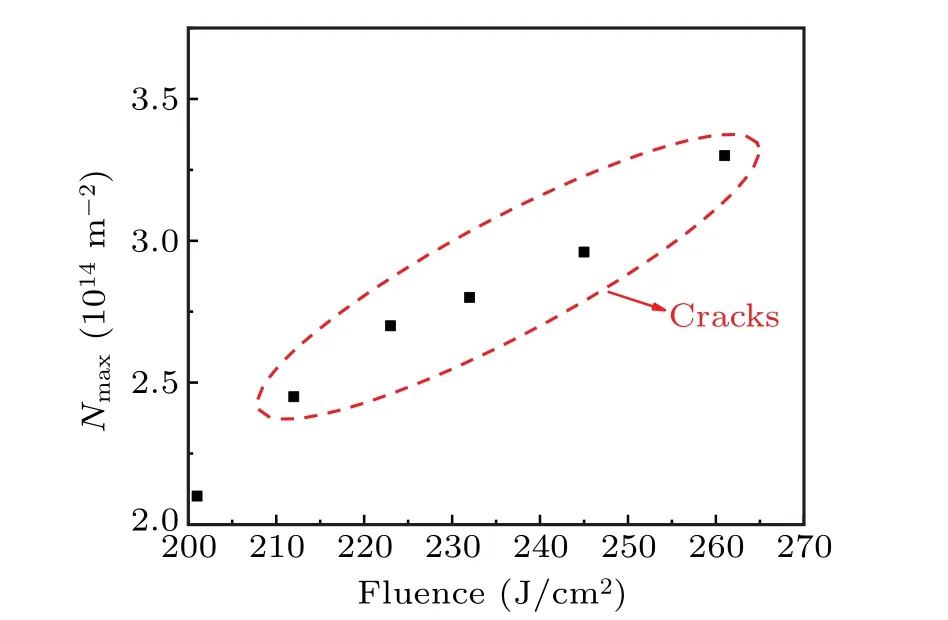
Fig.6.Variation of the maximum dislocation density in the sample with laser energy density at the end of the laser action.
The fracture process of the material at the end of the laser action is analyzed below,using a laser power density of 245 J·cm-2as an example.
Based on the results of previous studies it is clear that the slip of single-crystal germanium is dominated by the S1 slip system.[24]The dislocation distribution of the S1 slip system on the sample surface at the end of the 245 J·cm-2laser action is shown in Fig.7.It is clear from this figure that there are two symmetric regions about the center of the spot in the[ˉ120]direction and the[1ˉ20]direction,which have a much higher dislocation density than the other regions.Considering the symmetry,there are a total of eight such regions on the(001)plane.During cooling, the rapid proliferation of dislocation density in these regions leads to a rapid decrease in fracture strength and also provides fracture initiation points.Ignoring the effect of defects in the sample itself,fracture is most likely to occur first at one of these locations where the dislocation density is at its maximum,at which time the stress is released.The crack then extends outwards, and given that the fracture strength is lowest in the annular direction,the crack is most likely to extend along the annulus.Furthermore,although there are eight possible initiation points,the stresses at the other possible initiation points will not reach the fracture strength as the stresses are released after fracture,so that far fewer than eight initiation points are generally observed.This fracture process explains the fracture morphology of the samples in Figs.2 and 3 very well.

Fig.7.Dislocation density distribution of the S1 slip system on the(001) face at the end of the laser action, with an action laser energy density of 245 J·cm-2.
Figure 8 gives the relationship between stress and dislocation density as a function of time at the maximum dislocation density in the sample.As can be seen from the figure,the whole process can be divided into three stages.In the first stage, the laser irradiation stage, the stress increases rapidly at this point and so does the dislocation density,but the absolute value of dislocation density is of the order of 102 m-2.The dislocation proliferation at this point does not have much effect on the fracture strength of the sample,so fracture is unlikely to occur.In the second stage,around the end of the laser irradiation,the center of the laser spot is still transferring heat to the point,so the stress at the point is still increasing,and so is the dislocation density.As in the first stage,the dislocation density is not sufficient to cause fracture.Finally,in the third stage, the overall heat transfer outwards from the spot begins to decrease and the dislocation density begins to increase at an exponential rate.When the dislocation density increases to a certain level, a cracking point is formed, completing the entire fracture process as shown in Fig.3.From Fig.8, the fracture process should occur after 130 ms, while the probability of fracture decreases with time due to the decreasing stress values.Thus,the most likely time for fracture to occur is in the range of approximately 130-200 ms.Considering the influence of realistic sample defects and other physical processes, these conclusions can be considered to be in general agreement with the experimental results.
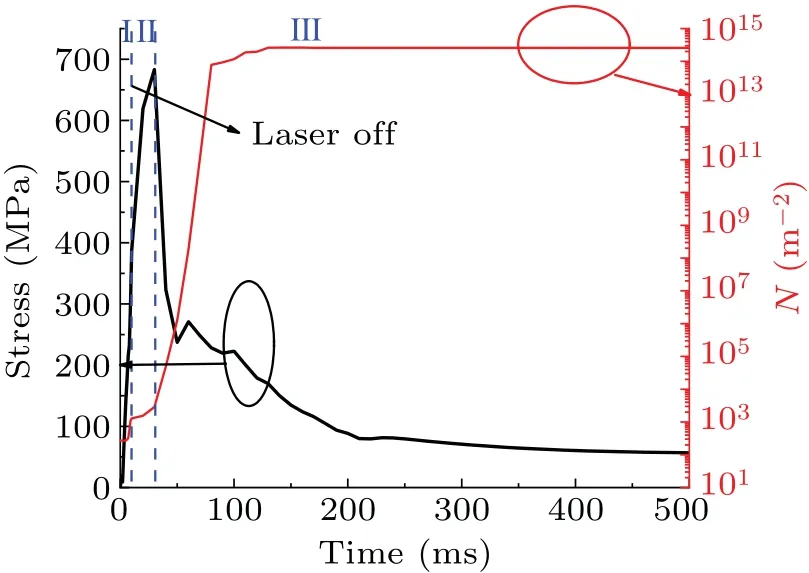
Fig.8.Stress and dislocation density plotted against time, with points taken at the maximum dislocation density.
6.Conclusion
This paper investigates the effect of progressively increasing laser energy density at 1080 nm on the stress damage process in single-crystal germanium samples subjected to laser irradiation.The experimental results show that fracture does not occur until the laser energy density is greater than 212 J·cm-2;the fracture process captured by the high-speed CCD indicates that fracture occurs during the cooling process;the moment of fracture is not specifically related to the energy density.Numerical simulations show that: the sample dislocation fracture threshold is 2.4×10¹⁴m-2; the fracture process is influenced by both dislocation density and stress; there are eight possible fracture initiation points, but stress will be released after fracture occurs at one of the initiation points and the rest will have an impact on the crack path.The research in this paper will provide some theoretical references for laser processing of semiconductor materials and will deepen the understanding of the process of thermal stress damage generated in semiconductor materials under laser irradiation.
- Chinese Physics B的其它文章
- Single-qubit quantum classifier based on gradient-free optimization algorithm
- Mode dynamics of Bose-Einstein condensates in a single-well potential
- A quantum algorithm for Toeplitz matrix-vector multiplication
- Non-Gaussian approach: Withstanding loss and noise of multi-scattering underwater channel for continuous-variable quantum teleportation
- Trajectory equation of a lump before and after collision with other waves for generalized Hirota-Satsuma-Ito equation
- Detection of healthy and pathological heartbeat dynamics in ECG signals using multivariate recurrence networks with multiple scale factors

