Targeted bile acids metabolomics in cholesterol gallbladder polyps and gallstones: From analytical method development towards application to clinical samples
Jiojio Wei ,To Chen ,Ymin Liu ,Shui Sun ,Zhiqing Yun ,Yixin Zhng ,Aizhen Xiong ,Linnn Li ,*,Zhengto Wng ,**,Li Yng ,***
a The MOE Key Laboratory of Standardization of Chinese Medicines,The SATCM Key Laboratory of New Resources and Quality Evaluation of Chinese Medicines,The Shanghai Key Laboratory for Compound Chinese Medicines,Institute of Chinese Materia Medica,Shanghai University of Traditional Chinese Medicine,Shanghai 201203,China
b Department of Biliary and Pancreatic Surgery,Renji Hospital,School of Medicine,Shanghai Jiao Tong University,Shanghai,200127,China
Keywords:Bile acid metabolism Gallbladder polyps Gallstones Metabolomics UPLC-MS/MS
ABSTRACT Bile acids (BAs) are synthesized by the liver from cholesterol through several complementary pathways and aberrant cholesterol metabolism plays pivotal roles in the pathogeneses of cholesterol gallbladder polyps(CGP)and cholesterol gallstones(CGS).To date,there is neither systematic study on BAs profile of CGP or CGS,nor the relationship between them.To explore the metabolomics profile of plasma BAs in healthy volunteers,CGP and CGS patients,an ultra-performance liquid chromatography-tandem mass spectrometry(UPLC-MS/MS)method was developed and validated for simultaneous determination of 42 free and conjugated BAs in human plasma.The developed method was sensitive and reproducible to be applied for the quantification of BAs in the investigation of plasma samples.The results show that,compared to healthy volunteers,CGP and CGS were both characterized by the significant decrease in plasma BAs pool size,furthermore CGP and CGS shared aberrant BAs metabolic characteristics.Chenodeoxycholic acid,glycochenodeoxycholic acid,λ-muricholic acid,deoxycholic acid,and 7-ketolithocholic acid were shared potential markers of these two cholesterol gallbladder diseases.Subsequent analysis showed that clinical characteristics including cysteine,ornithine and body mass index might be closely related to metabolisms of certain BA modules.This work provides metabolomic information for the study of gallbladder diseases and analytical methodologies for clinical target analysis and efficacy evaluation related to BAs in medical institutions.
1.Introduction
Gallbladder polyps (GP) and gallstones (GS) are both widely accepted high-risk factors for gallbladder cancer [1-5].GP,also named polypoid lesions of the gallbladder,can be categorized as neoplastic and non-neoplastic polyps based on histopathological evaluation.Neoplastic polyps cover all cancerous lesions and precursors of cancer,while non-neoplastic polyps consist of an aggregation of tumor-like lesions without malignant potential,including cholesterol polyps,inflammatory polyps,and adenomyomas,of which cholesterol polyps are the most usual.The mainstream treatment is surgical excision,and a broad consensus has been reached that cut-off of the optimum size for resection was 10 mm[2,6].Unlike the immobilization of polys,GS grow and move inside the gallbladder or biliary tract.Based on the composition,GS can be classified into cholesterol stones,bilirubin stones,and mixed stones.The most commonly used options are based on surgery but remain predominantly invasive [7].In the clinic,both the golden standards for diagnosing GP and GS are abdominal ultrasonography based on symptoms [8,9].Identification of potential biomarkers might be helpful for diagnosis and developing preventive strategies,and it also can provide a deeper understanding of disease etiologies.
Bile acids (BAs) are a group of acidic steroids with specific physicochemical properties that are synthesized from cholesterol in the liver through hydroxylation and side chain oxidation and stored in the gallbladder,and are the final metabolites of cholesterol [10,11].They play an important role in maintaining body homeostasis and physiological functions and are key signaling molecules for host and gut microbial metabolism.BAs have also been shown to be endogenous ligands for cell surface receptors,G protein coupled bile acid receptor 5,nuclear hormone receptor and natural agonists for the farnesol X receptor.Disturbances in the synthesis and metabolism of BAs in organisms can lead to the development of many diseases and immune dysfunctions,such as obesity,diabetes,non-alcoholic fatty liver and other metabolic diseases [12,13].
Studies show that the majorities of GP(60.5%)and GS(80%)fall into the category of cholesterol type [14-16].Although the pathogeneses of cholesterol gallbladder polyps (CGP) and cholesterol gallstones (CGS) are still not fully elucidated,aberrant cholesterol metabolism is a general characteristic [17,18],which is believed to contribute to the formation of CGP and CGS.In vivo,BAs are the end products of cholesterol metabolism.Otherwise,BAs is an essential factor in the pathogenesis of CGP and CGS,and changes in the levels of BAs in human plasma are closely related to the development of the diseases.Dated back to 1970,the BAs pool size was reported to diminish in patients with GS [19],and the cholic acid (CA) production rate was significantly lower.Levels of CA and chenodeoxycholic acid(CDCA)were later found significantly depressed in the CGS group[20].Result from a global perspective also indicated that the shortage of BAs is a major reason why gallbladder bile is supersaturated with CGS[21].Thus,we hypothesized that BAs profile of patients with CGP and CGS might alter compared with healthy people,and share some common features.
Over the past decades,enzymatic assay,enzyme linked-immunoassay,nuclear magnetic resonance(NMR),chromatography,and other related techniques have been developed and applied to the detection of BAs.The diverse structures of BAs,the existence of isomers and the complex matrix of biological samples pose great challenges for the detection of endogenous BAs.With the rapid development of chromatographic techniques,ultra-performance liquid chromatography-tandem mass spectrometry (UPLC-MS/MS) has become a mainstream method for the separation and detection of BAs,which is characterized by high sensitivity,good specificity,and low detection limits,and is gradually used in clinical practice for the detection of metabolites [22,23].In this study,we have developed and validated a method for the simultaneous quantitative determination of 42 BAs with the use of UPLC-MS/MS.The original aim of this study has remained largely the same since its inception,to analyze the BAs profiles of patients with CGP and CGS,and find possible common biomarkers to provide a theoretical basis for clinical diagnosis and early prevention of CGP and CGS.
2.Materials and methods
2.1.Materials and chemicals
HPLC grade methanol,formic acid and acetonitrile were purchased from Thermo Fisher Scientific (Waltham,MA,USA),Deionized water was purified by Milli-Q water purification system(Bedford,IA,USA).Phosphate buffered saline(PBS)was purchased from Meilunbio (Dalian,China).Activated charcoal was obtained from Sinopharm Chemical Reagent Co.,Ltd.(Shanghai,China).The authentic compounds of 24 unconjugated,7 glycine(G)conjugated,and 11 taurine(T)conjugated were obtained from either Steraloids Inc.(Newport,RI,USA),Sigma-Aldrich (Saint Louis,MO,USA),TRC(Shanghai,China),Shanghai Kai Bao pharmaceutical Co.,Ltd.(Shanghai,China),TCI (Shanghai,China) or J&K Scientific (Beijing,China).Four deuterium BAs as stable isotope internal standards(ISs) were purchased from Steraloids Inc.The details of authentic compounds are provided in Table S1.
2.2.Standard solutions,calibration and quality controls
The stock solutions of the 42 BAs and ISs had a concentration of 1 mg/mL in methanol.A mixed standard solution containing 100 ng/mL of the 4 ISs was prepared in 50% methanol-water and was used as the IS solution,stored at -20°C in glass vial until utilized.For preparation of the calibration curves,each working standard solution was mixed an equal volume of the IS solution.Spiking different concentrations of the working solution in blank plasma resulted in three quality controls (QCs) with the following concentration for each QC: low quality control (LQC),10 ng/mL;middle quality control (MQC),200 ng/mL;high quality control(HQC),2000 ng/mL.The blank plasma sample was prepared by adding 1 mL of PBS and 500 mg of activated charcoal to 1 mL of plasma,vortexed for 1 min to fully adsorb the target compounds,and then centrifuged at 4°C,10,000gfor 10 min,and the supernatant was collected in an eppendorf(EP) tube.
2.3.Sample collection and pretreatment
Plasma sample (n=60) were collected from Renji Hospital,including 20 CGP,20 CGS and 20 healthy volunteers.Healthy participants during the same period by both physical examination and B-ultrasonography were chosen as the control group.To reduce the influence of other factors,three groups were divided according to age,gender and body mass index(BMI).Each group consisted of 13 women and 7 men.Also,participants were at the age of 51.1(±11.4;CGP patients),50.7 (±5.2;CGS patients) and 47.5 (±12.6;control).Detailed characteristics of clinical patients are shown in Table S2.All participants signed informed consents before entering the study.And the study protocol conforms to the ethical guidelines of the 1975 Declaration of Helsinki(6th revision,2008)as reflected in a prior approval by the Ethics Committee of Renji Hospital(Approval number: [2016]045).
The pre-prandial whole blood was collected and stored at 4°C for at least 2 h.After centrifugation at 4°C,850gfor 15 min,the supernatant was collected in an EP tube,immediately frozen and stored at -80°C.All plasma samples were thawed on ice before subsequent preparation and analysis.
Before instrumental analysis,300 μL of methanol was added to each plasma sample(100 μL)to remove proteins.The samples were then vortexed for 1 min and centrifuged at 4°C,12,000gfor 15 min.Subsequently,300 μL of supernatant was transferred to a 1.5 mL clean EP tube and evaporated to dryness with N2.Dried samples were dissolved by adding 100 μL IS solution (100 ng/mL),then vortexed for 1 min and centrifugated at 4°C,12,000 g for 10 min,and the supernatant(80 μL)was transferred to liquid phase vials for UPLC-MS/MS analysis.
2.4.Instrumentation conditions
The sample was analyzed by Shimadzu Nexera X2 UHPLC LC-30A system (Shimadzu Corporation,Kyoto,Japan) and AB SCIEX 6500 Q-Trap system (SCIEX,Framingham,MA,USA) with the equipment of an electrospray ionization (ESI) source.Chromatographic separations were performed with a CORTECS UPLC?C18column(2.1 mm×100 mm,1.6 μm)(Waters Corporation,Milford,MA,USA).The column temperature was maintained at 45°C.Mobile phases were purified water containing 0.01% formic acid(A) and acetonitrile (B) with a flow rate of 0.3 mL/min,and the gradient was set as follows:0.01-12 min,23%-38% B;12-26 min,38%-75% B;26-26.1 min,75%-100% B;26.1-28 min,100% B;28-28.1 min,100%-23% B;28.1-32 min,23% B.The injection volume was 2 μL.The mass spectrometer was operated in negative ion mode.In order to enhance the sensitivity of conjugated BAs,pseudo-multiple reaction monitor mode was used(precursor and product ions are identical).The ESI voltage was set at-4.5 kV,and the temperature of the ion source was 600°C.Other MS parameters were set at: curtain gas,35 psi;collision gas,medium;nebulizer current,-3.0 μA;ion source gas 1,45 psi;ion source gas 2,50 psi;declustering potential,-120 V;electronic power,-10 V;collision energy,-10 eV;cell exit potential,-12 V.
2.5.Validation of the method
The newly developed method was applied for validation of individual BA in terms of linearity,limit of quantification(LOQ),limit of detection (LOD),precision,accuracy,stability,carry over effect(COE),matrix effect (ME) and recovery rate (RR).The linear regression analysis carried out with nine-point calibration curves for all BAs was plotted ranging between 0.006 and 4000 ng/mL(each concentration point contained 100 ng/mL of IS).The calibration curves were generated by plotting the peak area ratio between the analyte and the IS vs the concentration of the analyte with least squares linear regression analysis with a weighting factor of 1/x2,using the MultiQuant V3.0.1 software(SCIEX,Framingham,MA,USA) for the calculation.The LOQ was determined as the lowest concentration in the calibration curve with acceptable precision (relative standard deviation,RSD <15%) and accuracy(within±20%)at which the signal-to-noise ratio was at least 10:1.The LOD was measured at a signal-to-noise ratio of at least 3:1.
The precision and accuracy were evaluated as the RSD% of three concentration levels(LQC,MQC and HQC),and six repeated measurements of each point of QC samples were analyzed on the same day to determine the intra-day precision and accuracy,while the inter-day precision and accuracy was repeated three times over 48 h.Analyte stability in plasma was assessed by comparing replicates (n=6) at MQC concentration after 24 h or 48 h of storage at 4°C in the dark with the freshly prepared replicates at the same concentration.COE was calculated by the ratio of the peak area of HQC to the peak area of blank methanol(n=6).IS was added to LQC,MQC,and HQC samples containing blank matrice,and then the peak area was compared with those of the control solution and IS which are without blank matrice.After calculating the matrix factor of each compound and IS respectively,the ME was obtained by dividing the matrix factor of analyte by the matrix factor of IS.And RR was calculated by dividing the corrected mean peak area ratio (analyte/IS) of each analyte spiked before extraction by that of each analyte spiked after extraction at three QC concentrations (LQC,MQC,HQC;n=6).
2.6.Statistical analysis
Peak extraction and analysis were carried out using the quantitative module of Analyst V1.6.2,and MultiQuant V3.0.1 software was used for the calculation of each analyte concentration.The ropls package in R (version 3.6.1) was used to construct the mathematical model,which run on a Windows 7 system.Orthogonal partial least squares discriminant analysis(OPLS-DA)was used to maximize the separation between groups.The studentttest and Venn Diagrams (version 2.1.0,http://bioinfogp.cnb.csic.es/tools/venny/index.html) were used to reveal biomarkers.The ‘preceiver operating characteristic’ (ROC) package [24] was used to present ROC curves,area under the curve(AUC)and 95% confidence intervals (CI).
3.Results and discussion
3.1.Method validation
The representative chromatograms of 42 BAs and 4 ISs are shown in Fig.1.A total ion chromatogram of 42 BAs and 4 deuterium-labeled BAs was displayed in Fig.S1.The calibration curves were obtained from a series of diluted standard solutions of the 42 BAs.Coefficients of determination for all target analytes presented good regression value and ranged from 0.9935 to 0.9990.Sensitivity of the method was evaluated by calculating the LOD and LOQ.The LOD was between 0.002 and 1.500 ng/mL.The LOQ ranged between 0.006 and 5.000 ng/mL.These results are exhibited in Table S3.The precision and accuracy of the developed method were determined by analyzing the QCs at three different concentration levels,the intraday and inter-day precision (RSD%) and accuracy (relative error) of target analytes are shown Table S4.The intra-day and inter-day precision were determined to be 1.25%-9.74% and 2.70%-9.97% respectively,while the accuracy values between 86.62% to 113.28% and 86.44%-114.92%.The stability ranged from 91.1% to 112.4% and acceptable stability was observed.A summary of stability analysis is presented in Table S4.The COE,ME and RR were evaluated to determine the reproducibility of the method.The COE was tested by methanol injection after the high concentration standard,and a range of 0.0018%-0.8060% was found for all compounds.The ME was investigated by comparing the peak area of matrix-matched standard solution and the pure solution containing equivalent amounts of each analyte,respectively,to the peak areas of the IS(n=6).Before IS correction,the result showed that ME existed at MQC and LQC,and the inhibition ratios were about 30% and 25%,respectively.After correction by IS,ME was successfully eliminated and ranged between 85.18% and 114.81%.The RR values of all analytes ranged between 86.20% and 113.86%.The COE,ME and RR are shown in Table S5.
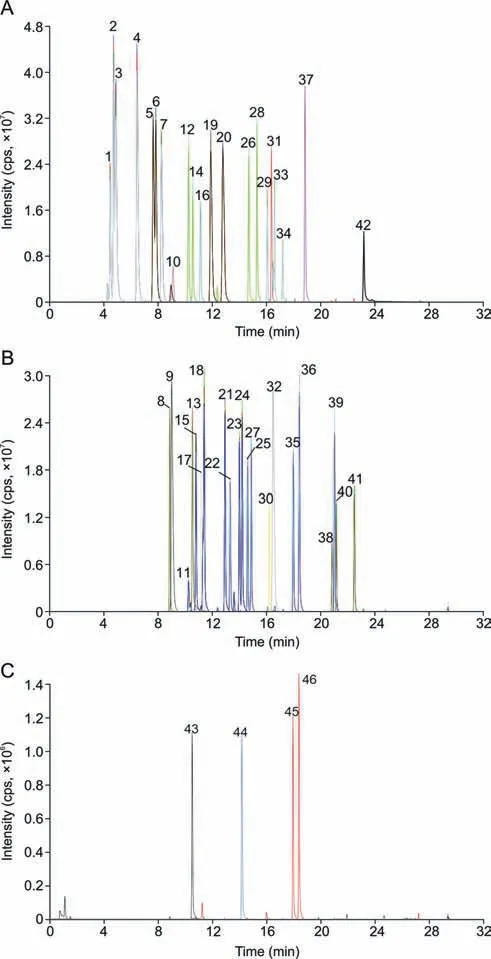
Fig.1. Extracted ion chromatograms obtained by ultra-performance liquid chromatography-Q-Trap mass spectrometry(UPLC-Q-Trap MS)for of 42 bile acids(BAs)and 4 deuterium-labeled BAs.(A,B) Extracted ion chromatograms of 42 BAs.(C) Extracted ion chromatograms of 4 deuterium-labeled BAs.Peaks 1-42 are tauro-ω-muricholic acid,tauro-α-muricholic acid,tauro-β-muricholic acid,tauro-λ-muricholic acid,tauroursodeoxycholic acid,taurohyodeoxycholic acid,taurocholic acid,glyco-λ-muricholic acid,tauro-7-ketolithocholic acid,dehydrocholic acid,ω-muricholic acid,glycoursodeoxycholic acid,glycocholic acid,glycohyodeoxycholic acid,α-muricholic acid,7-ketodeoxycholic acid,12-ketochenodeoxycholic acid,β-muricholic acid,taurochenodeoxycholic acid,taurodeoxycholic acid,λ-muricholic acid,murocholic acid,allocholic acid,cholic acid,ursodeoxycholic acid,glycochenodeoxycholic acid,hyodeoxycholic acid,glycodeoxycholic acid,7-ketolithocholic acid,6,7-diketolithocholic acid,nordeoxycholic acid,taurolithocholic acid,12-ketolithocholic acid,apocholic acid,chenodeoxycholic acid,deoxycholic acid,glycolithocholic acid,alloisolithocholic acid,isodeoxycholic acid,isolithocholic acid,lithocholic acid,and dehydrolithocholic acid,respectively.Peaks 43-46 are glycocholic-d4 acid,cholic-d4 acid,chenodeoxycholic-d4 acid and deoxycholic-d4 acid,respectively.
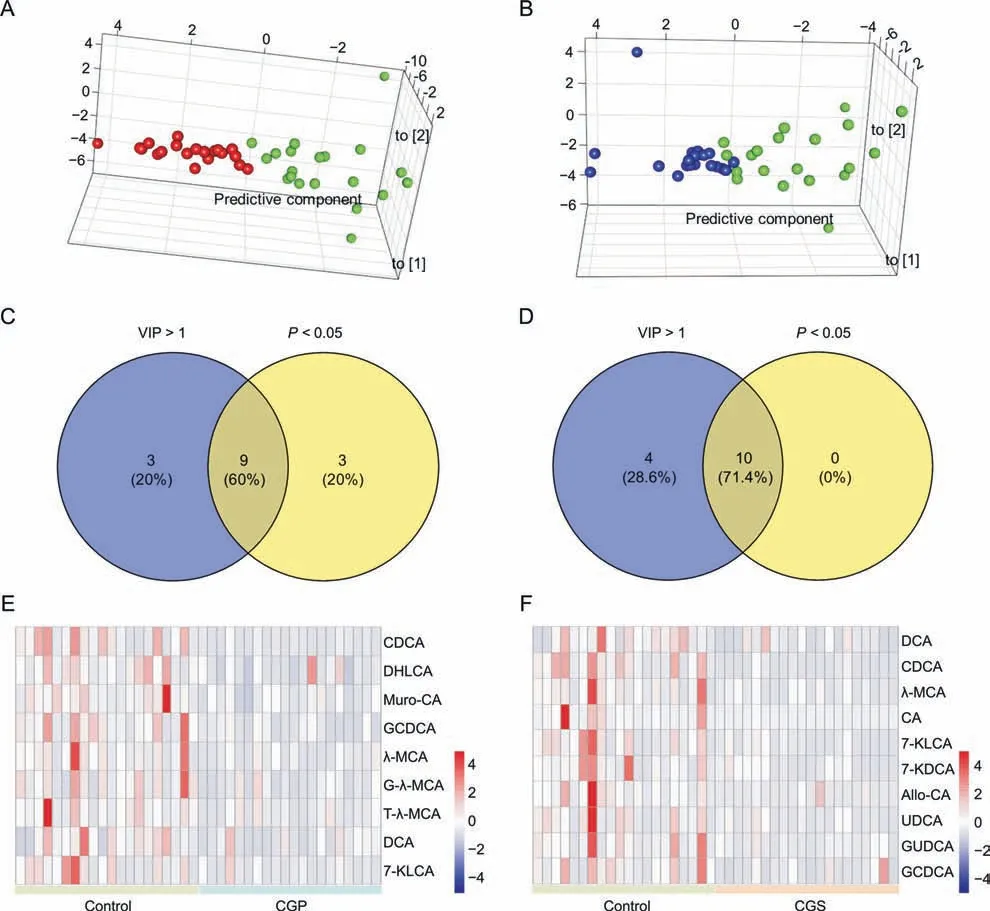
Fig.2. Orthogonal partial least squares discriminant analysis (OPLS-DA) score plots and disturbed bile acids (BAs).(A) Score plots of healthy control (green) vs cholesterol gallbladder polyps (CGP,red);(B) Score plots of healthy control (green) vs cholesterol gallstones (CGS,blue).(C) Venn diagrams for overlap of control vs CGP;(D) Venn diagrams for overlap of control vs CGS.(E) Heat map of differential BAs: control vs CGP;(F) Heat map of differential BAs: control vs CGS.7-KDCA: 7-ketodeoxycholic acid;7-KLCA: 7-ketolithocholic acid;Allo-CA: allocholic acid;CA: cholic acid;CDCA: chenodeoxycholic acid;DCA: deoxycholic acid;DHLCA: dehydrolithocholic acid;GCDCA: glycochenodeoxycholic acid;GUDCA:glycoursodeoxycholic acid;G-λ-MCA:glyco-λ-muricholic acid;Muro-CA:murocholic acid;T-λ-MCA:tauro-λ-muricholic acid;UDCA:ursodeoxycholic acid;λ-MCA:λmuricholic acid;VIP: variable importance.
3.2.CGP,CGS-associated alterations in BAs plasma indices
The quantitative result of 32 detectable BAs is shown in Table S6.Glycochenodeoxycholic acid(GCDCA)is one of the most abundant BAs in human plasma,and this was in line with literature [25,26].Most BAs decreased obviously in the two disease groups compared with healthy control group.OPLS-DA showed a clear difference for healthy control vs CGP or CGS group (Figs.2A and B).BAs with variable importance(VIP)greater than 1.0 andPvalue from studentttest smaller than 0.05 were considered as the biomarker candidates.9 and 10 differential BAs were screened out for CGP and CGS,respectively (Figs.2C and D).As shown in Figs.2E and F,the deficiency of discovered BAs in disease groups was intuitively expressed by heat maps.And 5 differential BAs including CDCA,GCDCA,λ-muricholic acid(λ-MCA),deoxycholic acid(DCA),and 7-ketolithocholic acid (7-KLCA) were shared by CGP and CGS.
Next,the logistic regression models were constructed to check the diagnostic performances of differential BAs.Models were fit based on respective differential BAs and 5 common BAs.The ROC curves using prediction probability as a diagnostic indicator were constructed.Models established by 5 identical differential BAs showed acceptable predictive abilities with AUCs of 0.898 and 0.895 for CGP and CGS,respectively(red solid lines in Figs.3A and B).To discriminate CGP and CGS from healthy control,these 5 common differential BA had an AUC of 0.883 with sensitivity of 85.0% and specificity of 85.0% (95% CI: 0.785-0.980),and the accuracy of 5-fold cross validation was 82.41%±0.62% (n=3).Total amounts of BA classified by different methods were summarized.Except that of T-conjugated ones,levels of G-conjugated,free and total BAs significantly decreased for CGP and CGS (Fig.3C).Total primary and secondary BAs both significantly decreased,and Gconjugated primary BAs were found decreased only in CGP group while G-conjugated secondary BAs only inhibited in CGS group(Fig.3D).
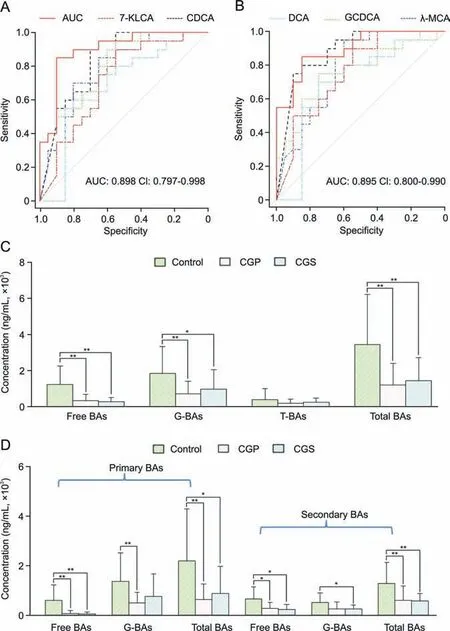
Fig.3. Predictive and statistical analysis based on quantitative result of plasma bile acids (BAs).(A) Receiver-operating characteristic (ROC) curves of combination index of five common differential BAs and each single BA for predictions of cholesterol gallbladder polyps(CGP)from healthy control group.(B)ROC curves of combination index of five common differential BAs and each single BA for predictions of cholesterol gallstones(CGS)from healthy control group.(C)Comparison of free and conjugated BAs.(D)Comparison of primary and secondary BAs.*P <0.05,**P <0.01.7-KLCA: 7-ketolithocholic acid;CDCA: chenodeoxycholic acid;DCA: deoxycholic acid;G: glycine;GCDCA: glycochenodeoxycholic acid;λ-MCA,λ-muricholic acid;AUC: area under the curve;CI: 95% confidence intervals.
Primary BAs (CA and CDCA) were synthesized in the liver from cholesterol and conjugated with T or G,and then stored in the gallbladder.Following a meal,BAs are excreted into the intestine by contraction of the gallbladder,and act as emulsifiers for fat digestion and absorption.Primary BAs were metabolized by enteric bacteria to produce secondary BAs via deconjugation,dehydroxylation,dehydrogenation,and epimerization.About 95% are reabsorbed in the terminal ileum and returned to the liver,and then transported into bile to complete their enterohepatic circulation.Loss of BAs in feces will be compensated by hepatic de novo synthesis to maintain the BA pool size.In this study,statistical results revealed that patients with CGP and CGS showed reduced plasma BAs pool size.Both primary and secondary BAs were in states of deficiency,thus,CGP and CGS might share a common pathological feature defect of BAs synthesis.The major biological function of BAs is the emulsification of fat into micelles,and the shortage of BAs might explain,in some way,why dyspeptic symptoms are commonly seen in patients with CGP and CGS.Total amounts of BA classified by different classification methods in CGP and CGS groups showed very similar variations compared with controls.For individual BA,CDCA has been proven effective in the dissolution of radiolucent GS.GCDCA,the most abundant BA in human plasma,was recognized as a common biomarker of CGP and CGS.λ-MCA,also named hyocholic acid (HCA) or λ-muricholic acid,was low in human plasma and showed a beneficial effect on the prevention and dissolution of biliary cholesterol crystals in a mouse model[27].Derived from dehydroxylation of CA by anaerobic bacteria in colon,DCA once was regarded as an important factor that contributes to CGS formation [28],but doubt was cast on it later [29].Although 7-KLCA might not be derived from CDCA directly,its administration also exerted therapeutic effect on dissolving GS.A combination use of five common BAs markers provided a good diagnostic efficiency for cholesterol gallbladder diseases (CGD).
3.3.Weighted gene co-expression network analysis (WGCNA)
The use of computer-aided software in the diagnosis of early diseases can shorten the period of disease diagnosis and assist in the diagnosis and identification of diseases,which is of great significance for the formulation of disease treatment programs [30-32].In addition,bioinformatics analysis provides methodological support for biomarker identification and in-depth functional analysis[33-35].WGCNA is an unsupervised computational method based on “guilt-by-association”,and serially changed metabolites recognized as modules can be extracted and made associations with clinical traits[36].Samples with missing clinical data were excluded and this analysis used 11 CGP and 10 GS samples.Levels of 11 amino acids(AAs),body weight and BMI were clinically available.Relationships between BA modules and clinical traits are shown in Fig.4.
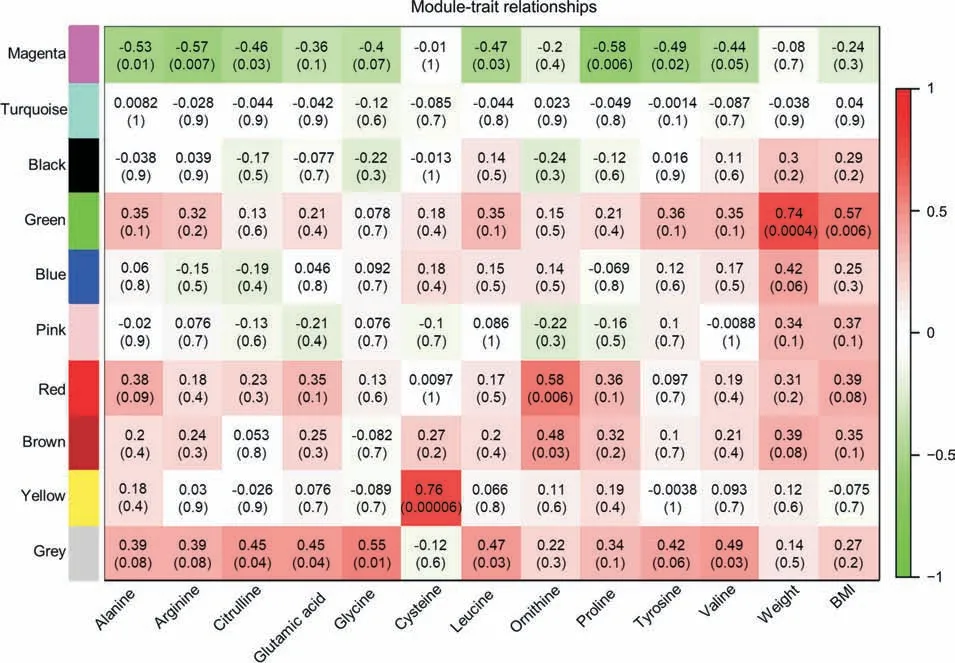
Fig.4. Module-trait association of weighted gene co-expression network analysis.Each row corresponds to a module,column to a trait;each cell of color-coded table contains the corresponding correlation and the P value.Black: cholic acid,glycolithocholic acid;Blue: deoxycholic acid,hyodeoxycholic acid,isolithocholic acid,lithocholic acid,tauro-7-ketolithocholic acid;Brown: glycocholic acid,glycochenodeoxycholic acid,taurocholic acid;Green: glycodeoxycholic acid,taurodeoxycholic acid,tauro-α-muricholic acid;Grey:allocholic acid,murocholic acid,λ-muricholic acid;Magenta: alloisolithocholic acid,glycohyodeoxycholic acid;Pink: dehydrocholic acid,nordeoxycholic acid;Red: glyco-λ-muricholic acid,tauro-ω-muricholic acid,tauro-λ-muricholic acid;Turquoise: 7-ketodeoxycholic acid,7-ketolithocholic acid,chenodeoxycholic acid,dehydrolithocholic acid,glycoursodeoxycholic acid,ursodeoxycholic acid;Yellow: taurochenodeoxycholic acid,taurohyodeoxycholic acid,taurolithocholic acid.
Modules in magenta and grey colors showed medium negative and positive correlations with most AAs,respectively.The magenta module consisted of glycohyodeoxycholic acid and alloisolithocholic acid while the grey module comprised murocholic acid,λ-MCA and allocholic acid.Cysteine exhibited no relationship with these two modules but a strong positive correlation with the yellow module which included taurochenodeoxycholic acid (TCDCA),taurohyodeoxycholic acid (THDCA),and taurolithocholic acid (TLCA)(P<0.001).Ornithine significantly correlated with the red module and the brown module.The red module consisted of tauro-λ-muricholic acid (T-λ-MCA),tauro-ω-muricholic acid (T-ω-MCA),and glyco-λ-muricholic acid(G-λ-MCA),and the brown module contains taurocholic acid(TCA),glycocholic acid(GCA),and GCDCA.The body weight and BMI exhibited strong significant correlations of the green module which included tauro-α-muricholic acid (T-α-MCA),taurodeoxycholic acid and glycodeoxycholic acid.
BAs not only act as facilitators of lipid absorption but also take part in many other metabolic pathways.In mice,BAs (mainly T-conjugated) can inhibit the cysteine dioxygenase type-1-mediated catabolic pathway via the farnesoid X receptor-dependent mechanism[37].Attenuating the repressive effect of BAs,for example,level decrease might result in depletion of free cysteine pool.A strong positive correlation was observed between the yellow module(TCDCA,THDCA,and TLCA)and the cysteine level in our work.G and T are the AAs usually conjugated with BAs in human,but some reports claimed that abnormal conjugation with ornithine of BAs was also found inpatients with CGS,and thiswasalso speculated to initiate the disease [38].T-λ-MCA,T-ω-MCA,G-λ-MCA,TCA,GCA and GCDCA were found positively correlated with free ornithine in this study.Hence,competitive effects during the conjugation process of BAs with AAs might explain these intimate relationships in the pathogenesis of CGD.BMI might mediate the association between lifestyle factors and CGP or CGS,and a close relationship between body weight and BMI with conjugated forms of DCA and T-α-MCAwas observed in this work.
4.Conclusions
In this study,we developed and validated a UPLC-MS method for the quantitative determination of 42 BAs in plasma.The linearity,sensitivity,precision,accuracy,stability,COE,ME and RR of the method all met the criteria for metabolomics study.This method was used for the analysis of changes in human plasma BAs metabolism under the pathological condition of CGP and CGS.These alterations included a decrease in the plasma concentrations of major BAs species,including total BAs,primary and secondary BAs.Subsequently,multivariate statistical analysis approach of OPLS-DA was conducted on 42 variables in 40 samples.Based on VIP>1,Pvalue<0.05,it was revealed that nine and ten differential BAs were screened out for CGP and CGS,respectively.And heat maps showed five differential BAs including CDCA,GCDCA,λMCA,DCA,and 7KLCA were shared by CGP and CGS.The WGCNA analysis for the association between biochemical indicators like plasma BAs and AAs was further carried out.The results showed potential BAs biomarkers (TCDCA,THDCA,TLCA,T-λ-MCA,T-ω-MCA,G-λ-MCA,TCA,GCA and GCDCA)were positively associated with cysteine and ornithine.Furthermore,age,sex,and BMI were concluded to be associated with fasting plasma BAs concentration,and these factors matched well among groups in this study.To sum up,for the first time,we confirmed that CGP and CGS,which have something in common in pathogenic mechanisms,also shared some metabolic characteristics.Both CGP and CGS are characterized by shrinkage of plasma BAs.Plasma markers discovered could efficiently differentiate disease from healthy controls.The findings of the current study have clinical implications,and markers found might be translated to clinical practice.
CRediT author statement
Jiaojiao Wei:Writing -Original draft preparation;Tao Chen:Investigation,Resources,Data curation;Yamin Liu:Methodology,Writing -Reviewing and Editing;Shuai Sun:Formal analysis;Zhiqing Yuan:Investigation,Resources;Yixin Zhang:Investigation;Aizhen Xiong:Methodology;Linnan Li:Writing-Reviewing and Editing;Zhengtao Wang:Supervision,Writing -Reviewing and Editing;Li Yang:Conceptualization,Funding acquisition.
Declaration of competing interest
The authors declare that there are no conflicts of interest.
Acknowledgments
This work is financially supported by the National Natural Science Foundation of China (Grant Nos.: 81920108033,and 82274223).
Appendix A.Supplementary data
Supplementary data to this article can be found online at https://doi.org/10.1016/j.jpha.2023.06.003.
 Journal of Pharmaceutical Analysis2023年9期
- Journal of Pharmaceutical Analysis的其它文章
- Comment on: “Development of a CLDN18.2-targeting immuno-PET probe for non-invasive imaging in gastrointestinal tumors”
- JOURNAL OF PHARMACEUTICAL ANALYSIS BEST PAPERS 2022
- Characterization of natural peptides in Pheretima by integrating proteogenomics and label-free peptidomics
- Eight Zhes Decoction ameliorates the lipid dysfunction of nonalcoholic fatty liver disease using integrated lipidomics,network pharmacology and pharmacokinetics
- Rapid metabolic fingerprinting with the aid of chemometric models to identify authenticity of natural medicines: Turmeric, Ocimum,and Withania somnifera study
- Gut microbiota-based pharmacokinetic-pharmacodynamic study and molecular mechanism of specnuezhenide in the treatment of colorectal cancer targeting carboxylesterase
