Promise of spatially resolved omics for tumor research
Ynhe Zhou ,Xinyi Jing ,Xingyi Wng ,Jinpeng Hung ,Tong Li ,Hongto Jin ,Jiuming He ,c,*
a State Key Laboratory of Bioactive Substance and Function of Natural Medicines, Institute of Materia Medica, Chinese Academy of Medical Sciences and Peking Union Medical College, Beijing,100050, China
b New Drug Safety Evaluation Center, Institute of Materia Medica, Chinese Academy of Medical Sciences & Peking Union Medical College, Beijing,100050,China
c NMPA Key Laboratory for Safety Research and Evaluation of Innovative Drug, Beijing,10050, China
Keywords:
Tumor
Spatially resolved transcriptomics
Spatially resolved metabolomics
A B S T R A C T
Tumors are spatially heterogeneous tissues that comprise numerous cell types with intricate structures.By interacting with the microenvironment,tumor cells undergo dynamic changes in gene expression and metabolism, resulting in spatiotemporal variations in their capacity for proliferation and metastasis. In recent years,the rapid development of histological techniques has enabled efficient and high-throughput biomolecule analysis. By preserving location information while obtaining a large number of gene and molecular data, spatially resolved metabolomics (SRM) and spatially resolved transcriptomics (SRT)approaches can offer new ideas and reliable tools for the in-depth study of tumors.This review provides a comprehensive introduction and summary of the fundamental principles and research methods used for SRM and SRT techniques, as well as a review of their applications in cancer-related fields.
1. Introduction
Tumors are composed of numerous cell types and are spatially heterogeneous complex tissues. At the cellular level, tumor tissue contains cancer cells and tumor microenvironment (TME) that comprises stromal cells, fibroblasts, endothelial cells, and immune cells[1,2].Tumor tissue is genetically diverse,with cells in different microenvironmental ecological niches acquiring different phenotypes;even for the same cancer type,tumors exhibit differences in gene expression, proliferation, and metastatic potential [3-5]. Tumor development is a complicated process involving genetic, transcriptional,protein,and metabolic regulation[6].Understanding the molecular variation among cells within a tumor at different levels is therefore anticipated to solve significant issues in cancer biology.In recent years,the field of histology has been largely driven by technological advancements that enable the efficient, high-throughput analysis of biomolecules. This demonstrates great potential for the comprehensive molecular mapping of tumors to identify biomarkers.Nevertheless,metabolomic approaches based on liquid chromatography-mass spectrometry (LC-MS) technology or bulk sequencing-based transcriptomic methods lack information on the spatial distribution of molecules in tissues owing to processing methods, such as homogenization, extraction, and enrichment[7-9].This impedes the establishment of correlations between gene expression or metabolic changes in tumors and specific tissues,organs,or spatially localized abnormalities.In a spatial context,there are still many questions. For example, how does the complex crosstalk between tumor cells and TME affect tumor progression?How do antitumor drugs distribute and act in tumors?How does the immune system alter tumor cell clones? Consequently, the development of high-resolution spatially resolved omics methods for in situ detection of biomolecules in tissues, to analyze the spatial heterogeneity of tumors at the metabolic and transcriptional levels,and to gain insight into the molecular mechanisms underlying their onset, progression, and metastasis, has become one of the most pressing challenges in cancer research.
Mass spectrometry imaging (MSI) is a powerful in situ tissue detection method for the label-free mapping of thousands of molecules(e.g.,metabolites,lipids,peptides,proteins,and glycans)in samples [10-12]. MSI has been developed into a superior technology for the spatially resolved metabolomics (SRM) analysis of heterogenous tissue, which is compatible with the complex metabolic profile generated based on the metabolic flexibility of cancer cells in vivo, and it has become a potent instrument for metabolomics research using tumor tissues[13].Further,recent advances in spatially resolved transcriptomics(SRT)technology enable highthroughput gene expression analysis while providing tissue structures.Moreover,when combined with single-cell techniques,it can provide precise spatial coordinates related to cellular and molecular distribution, yielding characteristic information such as cell types, intercellular interactions, and multiplex gene expression patterns[14-16].
2. Spatially resolved omics techniques
2.1. Principles of imaging based spatially resolved omics
Tumor tissues are highly heterogeneous,therefore,identifying a precise portion of the tissue or even a specific cell prior to transcriptomic and metabolomic analysis can effectively reduce the complexity of the analysis while increasing the specificity of subsequent analyses [17]. Since its introduction in 1996, laser capture microdissection (LCM) [18] has been widely used to isolate and study the biological characteristics of specific tissue regions. As a well-established technique, it is performed by segmenting and collecting specific regions of interest (ROIs) from formalin-fixed paraffin-embedded (FFPE) or frozen tissue sections directly under a microscopic visualization interface [19]. Owing to the high compatibility of LCM with other histological techniques, subsequent RNA sequencing (RNA-seq) or LC-MS analysis can yield genomic, transcriptomic, proteomic, or metabolomic information of the excised fraction (Fig.1A). In recent years, innovative strategies, such as virtual microdissection or virtual hematoxylin and eosin(H&E)staining,have also contributed to the advancement of LCM development and applications.
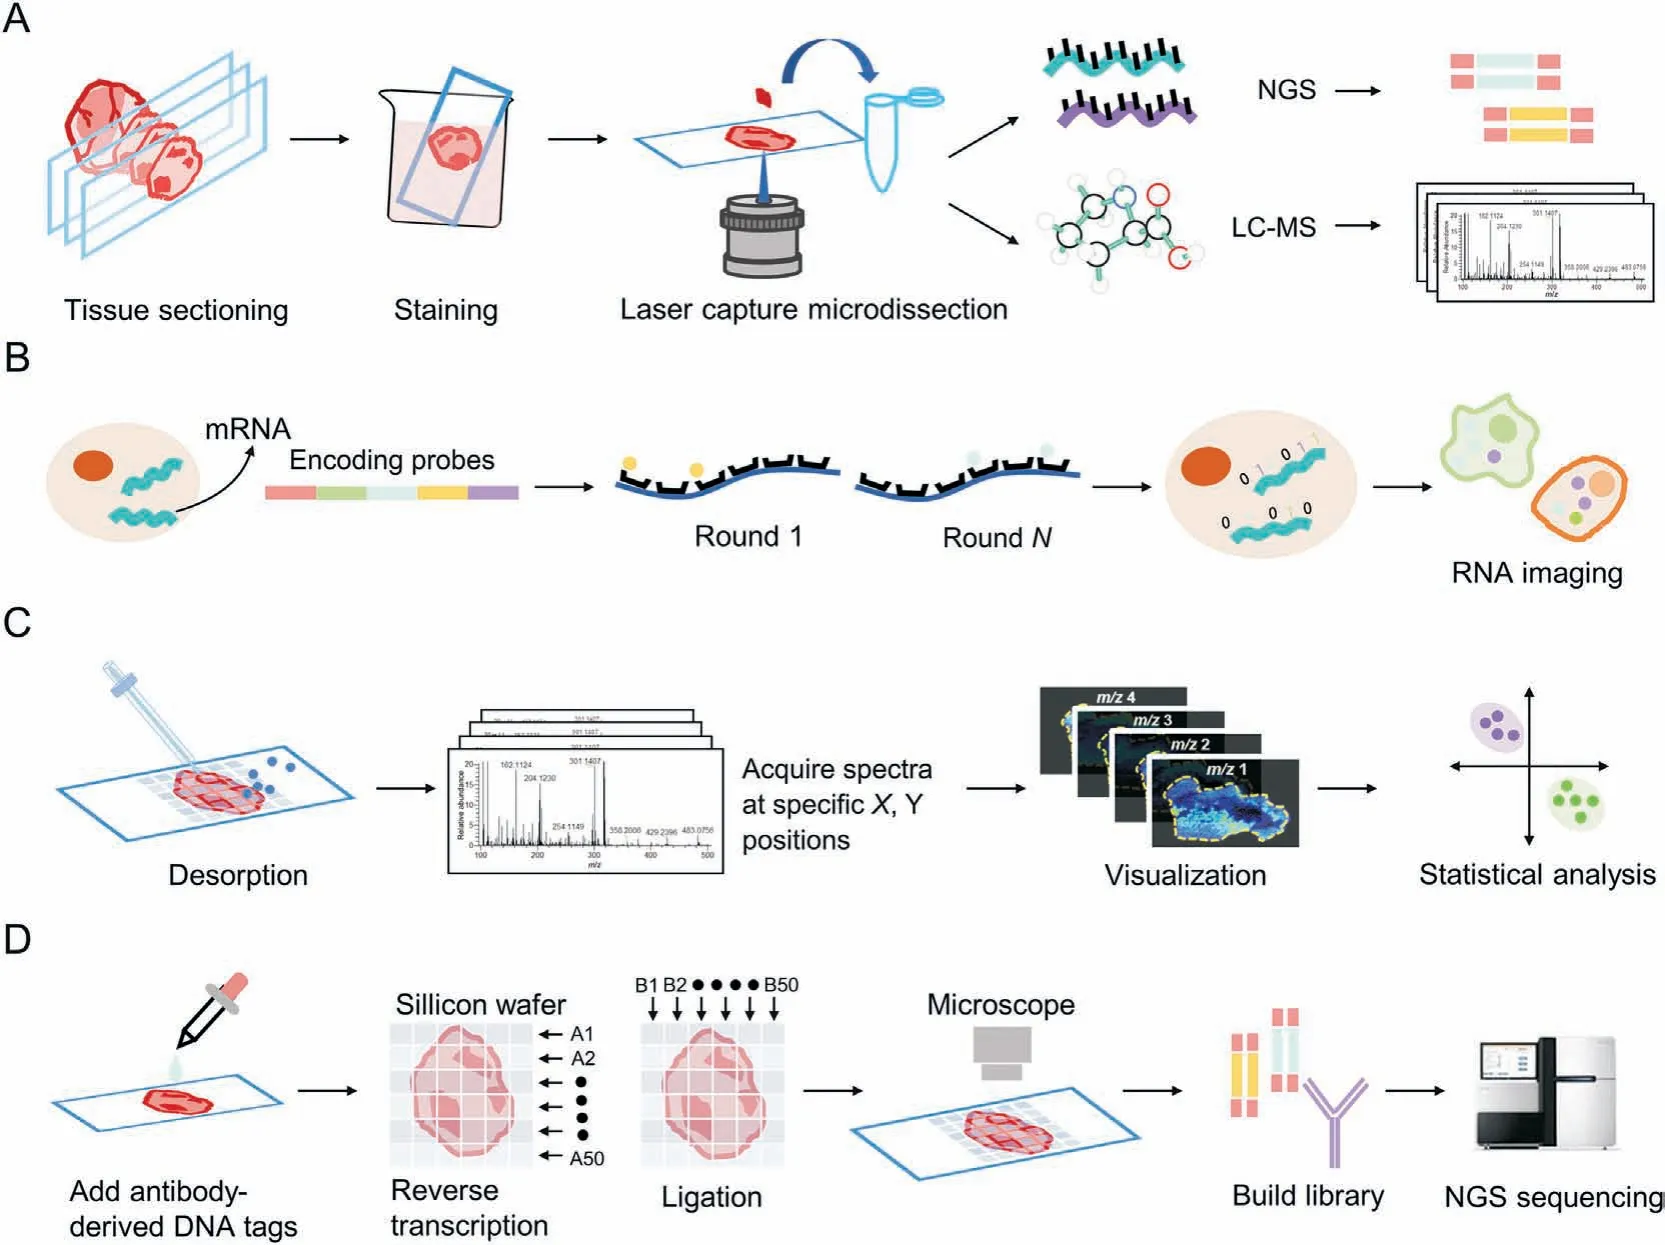
Fig.1. Schematic diagram of the spatial omics approach.(A)Laser capture microdissection(LCM)-based spatial imaging,(B)in situ hybridization(ISH)-based RNA imaging,(C)mass spectrometry imaging(MSI)-based spatial metabolomics,and(D)spatial barcode sequencing.NGS:next-generation sequencing;LC-MS:liquid chromatography-mass spectrometry;mRNA: messenger RNA.
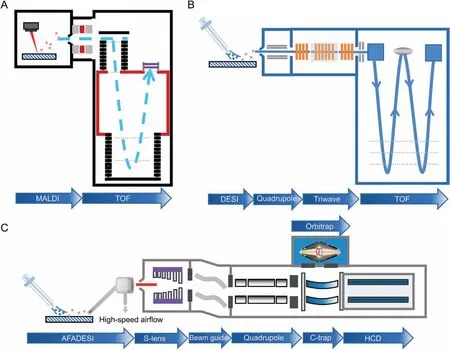
Fig.2. Mass spectrometry imaging(MSI)platform combining ion source(probe)with various mass analyzers.(A)Matrix-assisted laser desorption ionization(MALDI)-time-of-flight(TOF)MSI platform,(B)desorption electrospray ionization(DESI)SYNAPT G2-Si high resolution MSI platform,and(C)airflow-assisted desorption electrospray ionization(AFADESI)Orbitrap MSI platform. HCD: Higher energy collisioninduced dissociation.
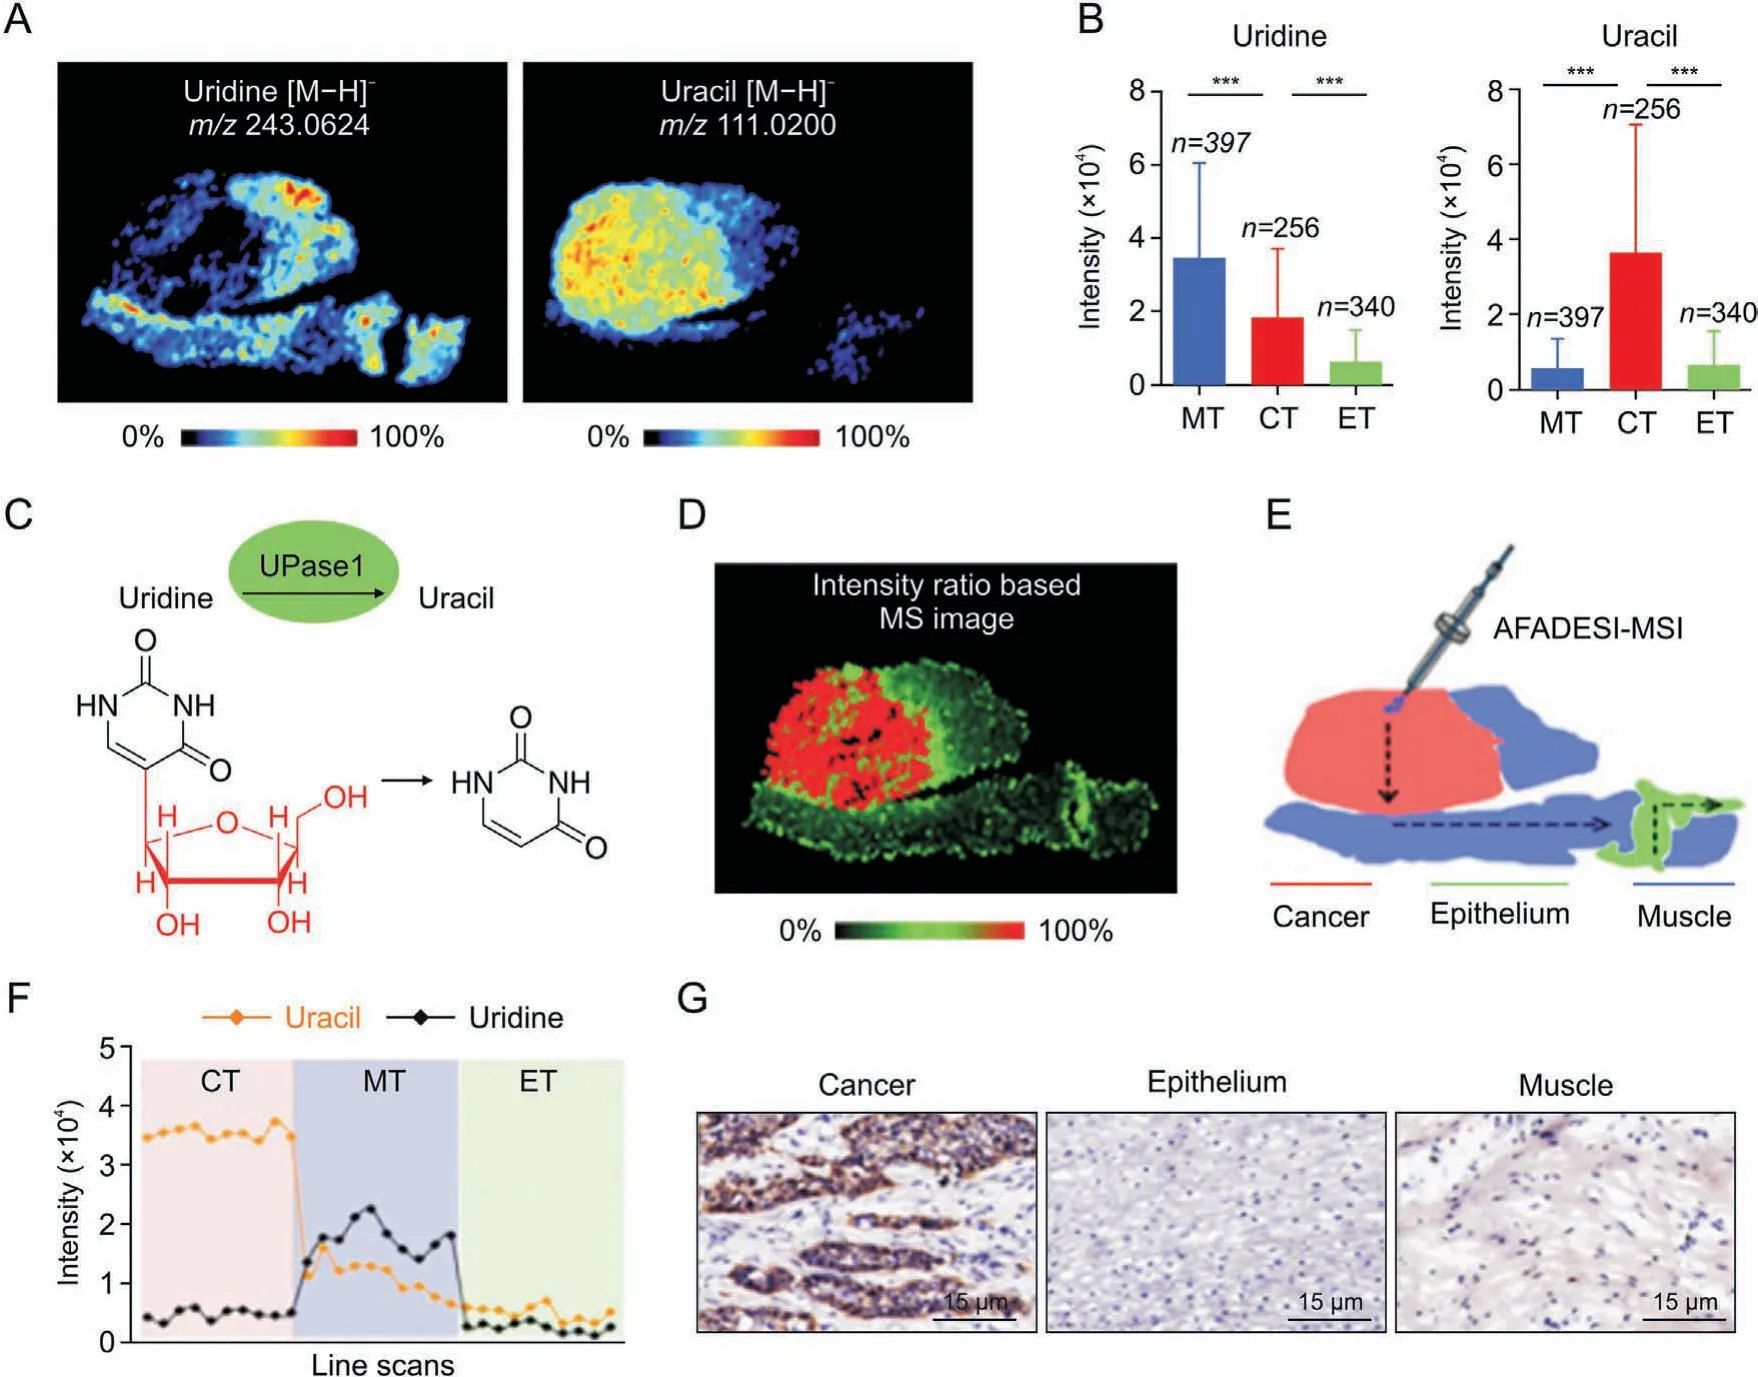
Fig.3. In situ visualization of crucial metabolites and metabolic enzyme in the uridine metabolism pathway.(A)Mass spectrometry(MS)images of uridine and uracil.(B)Uridine and uracil levels in cancer and paired epithelium and muscle tissues from 256 esophageal squamous cell carcinoma(ESCC)patients(means±standard deviation). ***P<0.001.(C)Uridine phosphorylase 1 (UPase1)-mediated metabolic process of converting uridine to uracil. (D) The newly constructed MS image based on the ion-intensity ratio of uracil to uridine.(E)Scanning path of airflow-assisted desorption electrospray ionization(AFADESI)-mass spectrometry imaging(MSI).(F)Plot of the intensity changes of uridine and uracil occurring during the transition from cancer, muscle, to epithelial tissue. (G) Expression of UPase1 in different regions of an ESCC tissue section. m/z: mass to charge ratio; MT:muscular tissue; CT: cancer tissue; ET: epithelial tissue. Reprinted from Ref. [40] with permission.
Microdissection enables the detection of ROIs, but it is a timeconsuming process, lacks sensitivity in small tissue regions [17],and provides limited spatial information; therefore, the further development of tissue in situ detection methods is required to study phenotypic and metabolic changes in the real state of the tissue. In situ hybridization (ISH) [20,21], which can be used to locate genes with labeled probes,comprises the first generation of techniques that can facilitate gene detection in a spatial environment. This is based on the combination of a labeled fragment of a known RNA nucleotide with the corresponding gene fragment in the cell or tissue to be examined, in accordance with the basepairing principle, and observation of the resulting hybrid under a microscope following a color development reaction (Fig. 1B). To generate gene expression matrices, ISH-based methods require image processing; to obtain matrices at the cellular level, images are manually segmented into small regions or systematically segmented using computational methods.Using 4',6-diamidino-2-phenylindole (DAPI)-stained nuclei as a baseline, the watershed algorithm can be used to identify cell boundaries as regions of low RNA density, thus localizing messenger RNA (mRNA) to individual cells [22,23].
The systematic execution of sampling by dividing the surface of a sample into a virtual grid is gradually becoming the dominant technique used in SRM as image technology advances. In SRM research,MSI as an imaging method based on MS technology,has an important position.Its principle is to grid the sample surface,obtain metabolite molecular information and pixel location coordinates simultaneously via point-by-point scanning, and reconstruct the data using software (i.e. obtain ion images containing different information), which is advantageous for the analysis of organs or tissues with microregions [24] (Fig. 1C). In SRT, the principle of spatial barcoding combined with sequencing is similar, as the microperforated slides contain oligonucleotides that are spatially barcoded.mRNA is released from cells after tissue permeabilization(perforation) and is converted into complementary DNA (cDNA)through binding to spatial barcodes, followed by next-generation sequencing (NGS)-based RNA-seq to generate the transcriptome.This can be used to trace gene expression to a specific tissue location through the associated spatial barcodes and by using reference markers on the corresponding histological images, as well as to decode the location information[25,26](Fig.1D).
2.2. MSI based SRM
The advantages of MSI include the absence of labeling and complex sample pre-treatment, as well as high sensitivity and throughput.Further,the detection of multiple metabolites in situ can be achieved while maintaining tissue morphology [24]. Through improved ionization techniques, sample preparation, and matrix optimization, recent research has enhanced MSI detection throughput,metabolites-coverage,sensitivity,and spatial resolution,making it a potent SRM tool for tumor marker screening,differentiating tumor margins, and identifying tumor subtypes. Typical ionization techniques for MSI include matrix-assisted laser desorption ionization (MALDI) [27], desorption electrospray ionization (DESI)[28,29],and secondary ion mass spectrometry(SIMS)[30].Different ionization techniques offer distinct benefits.MALDI allows detection over a wide mass range and is widely used for the analysis of biological macromolecules such as proteins, peptides, and lipids.Furthermore, since the favorable balance between chemical specificity,sensitivity,and spatial resolution,MALDI-MSI becomes one of the most popular technologies. Also, it is suitable for image fusion with other molecular imaging techniques[31-33].DESI-MSI employs various types of spray solvents to improve the selectivity of analytes,and its analysis is straightforward, allowing for an analysis of the surfaces of biopsies or tissue slices without any sample preparation,which illustrates its potential clinical or field applications[34].SIMS imaging can provide ultra-high spatial resolution at pixel sizes less than 100 nm2[35].Benefiting from high spatial resolution and high multiplexity,SIMS combined with machine learning algorithms can map single-cell metabolism, enable identification and clustering of single nuclei,and advance SRM to the subcellular level[36].
MSI has led to a variety of commercially available platforms to facilitate SRM research in a variety of fields.The platforms combine ion sources with different mass analyzers to detect various classes of molecules, thereby enhancing the specificity, spatial resolution,sensitivity, and scanning speed [37]. MALDI-MSI is typically employed for the detection of large molecules like lipids or proteins;consequently, time-of-flight (TOF) detectors are widely used (e.g.,rapifleX MALDI-TOF-MSI, Bruker, Germany) owing to their nearly limitless mass range. Fig. 2A illustrates the process that occurs during reflective MALDI-TOF, in which ions are accelerated in an electric field and then separated in a vacuum analyzer based on their TOF. The addition of a reflective tube increases the flight path and helps to compensate for the disparity in initial velocity of the ions during ablation [38]. MALDI-TOF-MSI provides high spatial resolution(10 μm or better)and fast acquisition speed,but not suitable for the analysis of small molecules[39].Waters has combined the DESIMSI platform with the SYNAPT G2-Si (high-performance mass spectrometer)to add ion mobility separation to the quadrupole-TOF(QToF) mass analyzer (Fig. 2B), thereby enhancing selectivity,specificity, sensitivity, and structural analysis. During imaging, the collision cross section values can be calculated from the measured ion drift times and precise mass numbers to increase the certainty of compound identification.In addition,DESI-MSI does not require the application of matrix and has a simple pretreatment step compared to MALDI.Airflow-assisted desorption electrospray ionization mass spectrometry imaging (AFADESI-MSI) [40,41] takes advantage of high pumping flow rates that significantly enhance the sensitivity of DESI for remote sample analysis.Typically,the commercial platform is coupled with an Orbitrap (ion trap mass analyzer), which is equipped with a high-performance quadrupole that filters transmitted ions based on their mass-to-charge ratio(m/z)and transfers them to the C-trap(bending linear trap)before injecting them into the Orbitrap mass analyzer [42,43] (Fig. 2C). Owing to the ionenriching capability of the C-trap and high mass resolution and mass-measurement stability of the Orbitrap mass analyzer, this platform is powerful and can detect less abundant metabolites and distinguish ion peaks with very close m/z values. This results in higher metabolite coverage for SRM analysis than that provided by a TOF-based platform. Through combinations with robust probes,AFADESI-MSI on a Q-Orbitrap mass analyzer provides high-quality images and high-precision mass spectral information for the analysis of small molecules with low abundance for the SRM analysis of tumor tissue[44,45].
2.3. SRT technology
SRT is a technology that combines high-resolution histological imaging with high-throughput spatially resolved sequencing and is designed to characterize gene expression profiles while preserving the spatial information of tissues.It is capable of revealing the spatial structure of complex transcriptional networks in tissues to provide a comprehensive understanding of molecules [46,47]. Existing SRT methods can be broadly classified into three categories: LCM combined with high-throughput gene sequencing[48],imaging-based in situ transcriptomics,and spatial barcode-based transcriptomics[49].LCM technology can determine the association between single-cell location information and its genomic, transcriptomic, or proteomic information; however, the throughput of the assay is low because thousands of individual cells must be extracted manually to achieve single-cell resolution[50].In situ sequencing(ISS)and imaging-based fluorescence in situ hybridization(FISH)greatly improve capture efficiency.Established ISS methodsbased on barcodepadlock probe and rolling circle amplification have demonstrated RNA detection capabilities for a variety of applications. The recently developed hybridization-based in situ sequencing (HybISS) employs a new combinatorial barcoding approach that improves its ability to resolve gene expression in situ space,supports the accommodation of larger gene panels,andincreases flexibilityand multiplexing[51].Sequential FISH(SeqFISH)[52]permits the barcoding of transcripts within individual cells through multiple rounds of hybridization, while measuring tens of thousands of mRNAs in tissues with high accuracy.Moreover, the development of technologies such as multiplexed error-robust FISH(MERFISH)[53](a barcode variant of single-molecule FISH (smFISH), spatially-resolved transcript amplicon readout mapping (STARmap) [48], and ouroboros single-molecule FISH(osmFISH)[54]has substantiallyenhancedthe multiplexing capability of targeted in situ imaging. However, these methods are technically demanding and require highly sensitive single-molecule fluorescence imaging systems,as well as complex image analysis processes[55].In contrast to in situ transcriptomics,spatial barcode-based approaches enable the unbiased sequencing of RNA at the entire transcriptome level and can capture thousands of genes with low levels of transcriptional expression[56].However,spatial resolution is typically a limiting factor for these approaches. 10x Genomics Visium has improved this method by decreasing the diameter of the capture region, increasing the density of the capture region, increasing the number of molecules detected per capture region,and decreasing the workflow duration [57]. High tissue section throughput and comprehensive polyadenylation transcriptome analysis are distinctive benefits of 10x Genomics Visium [58]. Recently developed barcode-based DBiT-seq technology enables simultaneous localization of mRNA and proteins in tissues for multi-omics analysis [59].Currently, commercial in situ imaging platforms including 10x Genomicsk's Xeniump, NanoString's CosMx SMI, and Vizgen's Merscope have been utilized in numerous spatial gene expression studies. A detailed comparison of different spatial transcriptomic technologies is shown in Table 1[21,25,48,51,53-56,60-73].
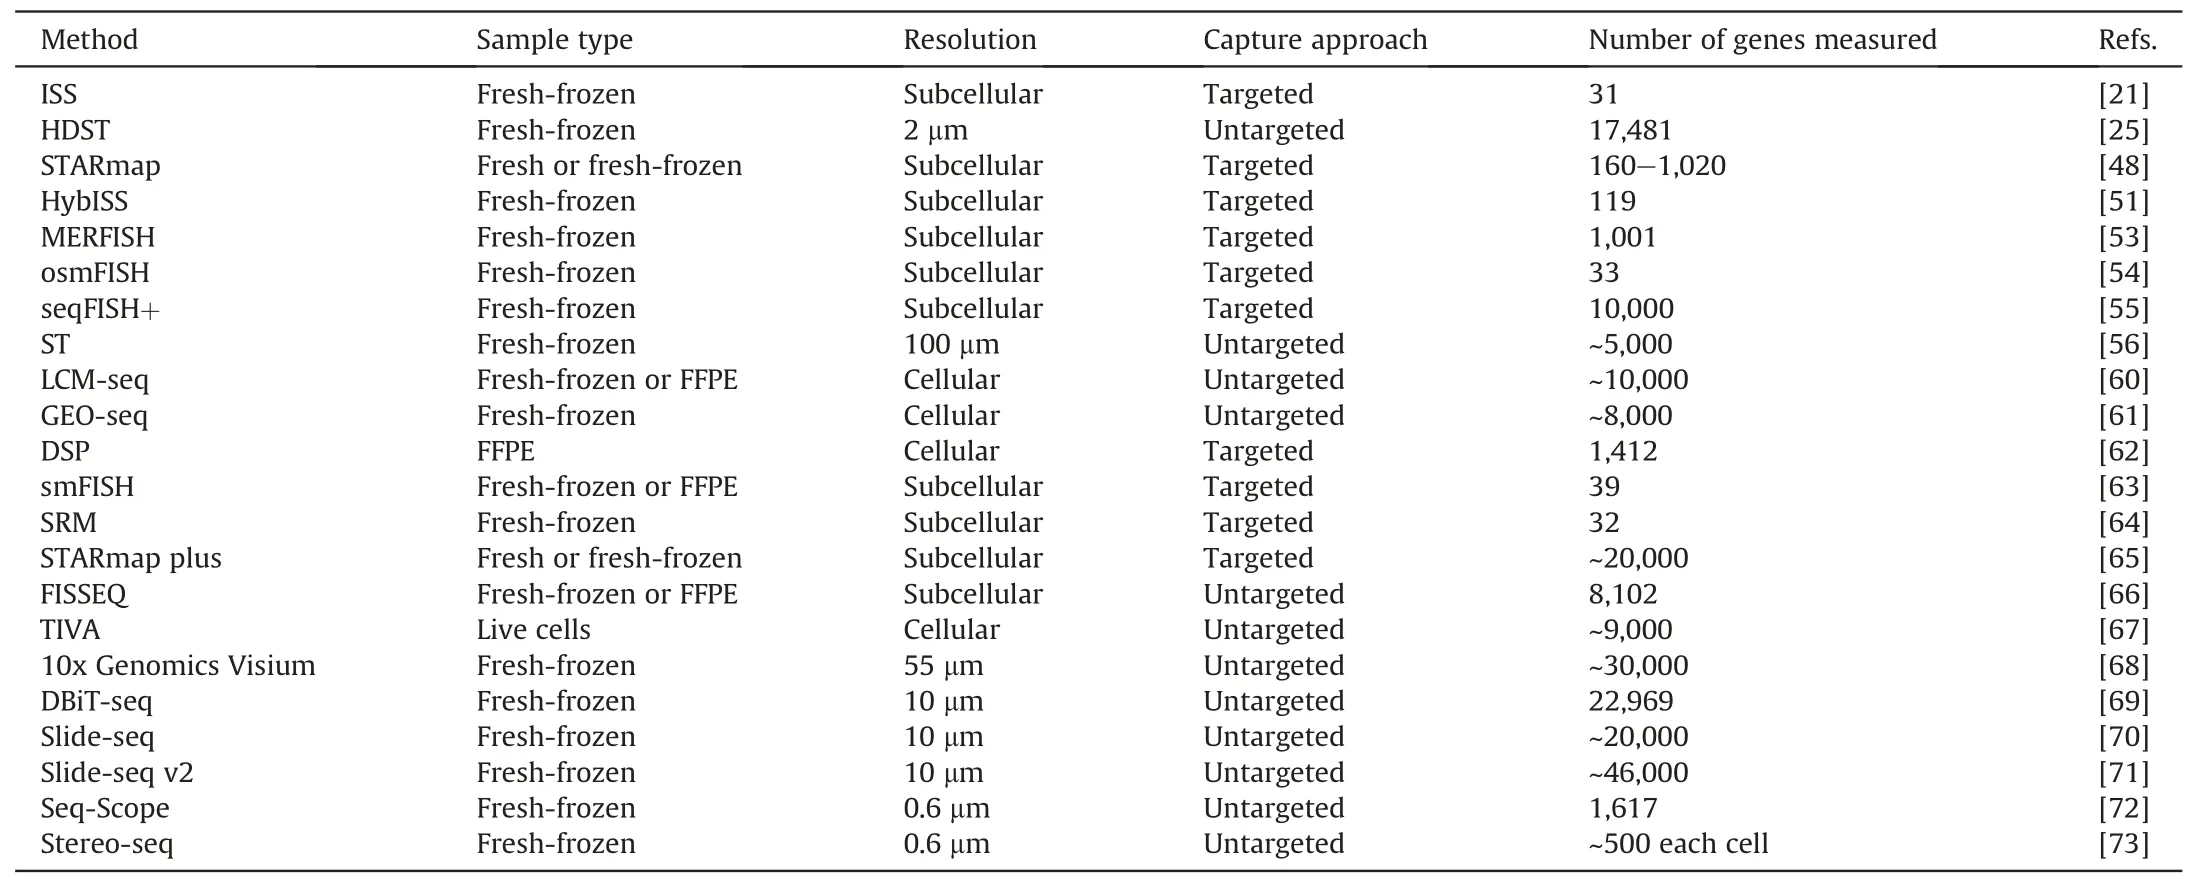
Table 1 Comparison of spatially resolved transcriptomics(SRT) techniques.
Complex transcriptomics datasets place a demand on the advanced computational tools and strategies for data analysis. Distinguishing the boundaries of individual cells is challenging in SRT.Unlike previous manual segmentation methods, recent spatial segmentation strategies use different computational methods to estimate the extent and shape of cell boundaries either mathematically or by using marker signals or both [74]. For example, U-net [75],CellPose [76], and DeepCell [77] predict segmentation by machine learning.Image processing,segmentation,and decoding can be efficiently executed with scripts and packages in Python,R,or MatLab.
2.4. Spatial resolution and sensitivity
Resolution is a crucial factor in spatial omics. The manner in which researchers report or calculate this parameter varies considerably. In the majority of studies, lateral resolution is primarily associated with the pixel, step, or spot size [78], and the actual size of the tissue or cell corresponding to the imaging map is frequently one of the criteria used to evaluate spatial resolution.In recent studies, spatial resolution has been effectively improved by enhancing instrumentation, optimizing the detection process, and developing algorithmic computer programs. The combination of transmission-mode MALDI-MSI and laser-induced post-ionization(MALDI-2) techniques enables subcellular resolution imaging analysis at a pixel size of 600 nm[79].Li et al.[80]designed a new integrated microfluidic nano-DESI MSI probe, iMFP, to achieve a spatial resolution of greater than 25 μm by optimizing the port shape for stability and sensitivity.Two recently developed methods,Slide-Seq and high-definition spatial transcriptomics (HDST), use beads with barcoded DNA oligonucleotide probes to significantly improve the spatial resolution.Slide-seq transfers RNA from tissue sections to a surface covered with DNA barcode beads of known location to measure whole genome expression in complex tissues at a resolution of 10 μm[70];HDSTuses Illumina bead arrays to capture RNA from tissue slices,and enables single-cell transcriptome analysis at 2-μm resolution [25]. Accordingly, specialized pipelines for the visualization and comprehensive analysis of the enormous datasets generated have been developed[47,81].
Sensitivity is another important metric in spatially resolved omics. Since high sensitivity enables more information about themolecule to be obtained, the number and dynamic range of metabolite or gene detection coverage are crucial factors to be considered. The relationship between sensitivity and spatial resolution is somewhat contradictory and antagonistic. In general, a higher spatial resolution diminishes the signal intensity for substance detection because the amount of substance is diminished as the unit area of pixel points decreases, thereby affecting the sensitivity [82]. Therefore, the detection of as many metabolites and genes and other molecules as possible while ensuring reasonable spatial resolution has become one of the goals of spatially resolved omics. On-tissue chemical derivatization [83] is an alternate technique used to enhance the ionization efficiency of target analytes. It can increase the molecular weights of smallmolecule analytes, thereby moving the derivatized product ions out of the “chemical noise” range [84]. For difficult-to-ionize metabolites,such as sterol molecules,chemical structure modification via derivatization can effectively boost the detection signal [85].Moreover, numerous studies have demonstrated that the incorporation of MALDI-2 technology into MSI can significantly enhance the ionic intensity and detection coverage of lipids [86]. Similarly,the low sensitivity of transcript detection with SRT limits the range of biological applications of this technology. Stickels et al. [71]described a technique referred to as Slide-seqV2 that increases sensitivity by one order of magnitude owing to improvements in barcode bead synthesis, the array sequencing pipeline, and enzymatic cDNA processing. Chen et al. [73] combined DNA nanoball pattern arrays and in situ RNA capture to generate spatially enhanced resolution omics sequencing (Stereo-seq) for highly sensitive single-cell-resolution spatial transcription analysis.
3. Application of spatially resolved omics to tumor research
3.1. Tumor heterogeneity
Spatial heterogeneity refers to the fact that, owing to TMErelated factors, cancer cells at different sites have distinct gene expression patterns and molecular compositions [87]. Numerous studies have demonstrated that metabolic reprogramming, mediated by metabolic enzymes and transporter proteins at the transcriptional and post-transcriptional levels, is one of the factors contributing to high tumor heterogeneity and is a hallmark of cancer[88,89].The “Warburg effect” describes the increased rate of glycolysis and lactate production in the presence of large amounts of oxygen and fully functional mitochondria to meet the biosynthetic needs of the tumor [90-92]. MSI combined with histopathological images and statistical methods is appropriate for the analysis of heterogeneous solid tumor metabolic alterations. Sun et al. applied AFADESI-MSI at the level of metabolites and related enzymes to the high-throughput characterization of tumor metabolic alterations, in conjunction with the specific immunohistochemical staining of adjacent tissue sections, which revealed significant alterations in proline biosynthesis, glutamine metabolism,uridine metabolism,histidine metabolism,FA biosynthesis,and polyamine (Fig. 3) [40]. Gawin et al. [93] segmented unsupervised peptide maps of all cancer regions obtained by MALDI-MSI to reveal their intrinsic heterogeneity. In heterogeneous tumors, differences in the distribution of immune-related proteins (e.g., the pan-leukocyte marker CD45) were observed, and this analysis revealed that a greater degree of phenotypic heterogeneity could be associated with a favorable prognosis in human epidermal growth factor receptor 2-positive breast cancers. In addition to direct comparisons of metabolite abundance,the use of a variety of stable isotope-labeled substrates for metabolic pathways associated with cell proliferation,glucose metabolism,and amino acid metabolism allows for the quantitative tracking of metabolic flow in vivo.Multiisotope imaging MS (MIMS) can be used to dissect the metabolic function of individual cells in their native tumor environment. By quantifying stable isotopes of glucose and glutamine and utilizing cell division markers in melanoma and malignant peripheral nerve sheath tumors, it was discovered that proliferating cells exhibit heterogeneity in substrate utilization compared to nonproliferating cells [94]. TME acidification is one characteristic of metabolic reprogramming in tumors. Adding heavy water to the spray solvent for DESI-MSI for the characterization of the acidic TME of the tumor tissue has enabled visualization of the transient hydrogen-deuterium exchange of metabolites in tissue sections,providing technical support for studies on pH-driven tumor metabolic heterogeneity [95].
At the transcriptional level, tumor heterogeneity is manifested as genotypic and phenotypic differences between tumor cells or between sites within tumor cells. As malignancy progresses, cells continue to diversify genetically, which enables tumor spread,recurrence,and treatment resistance[96].TME plays a crucial role in tumorigenesis by coordinating intercellular crosstalk via precise transcriptional regulation [97,98]. The application of SRT to construct comprehensive gene expression profiles can reveal heterogeneity that cannot be detected through conventional transcriptome analysis and provide more detailed prognostic information, according to some studies. Specifically, Thrane et al.[99] used SRT to quantify gene expression in stage III melanoma lymph node metastases in situ and successfully identified different gene expression profiles in the transcriptomes of tumor sections by combining deconvolution and data downscaling, demonstrating the heterogeneity of gene expression within and between lymph node metastases and tumors. The integration of SRT with singlecell histology permits the classification and localization of various tumor cells, the characterization of tumor-microenvironment interactions at the tumor boundary, and the analysis of the unique “interface” cellular state of tumor-adjacent tissue contacts, characterized by the upregulation of ciliary gene and protein expression[100]. Liao et al. [101] introduced Bulk2Space, a spatial deconvolution algorithm based on a deep learning framework.Applying Bulk2Space to reconstruct and annotate the dataset obtained by RNA-seq, the bluk transcriptome achieved single-cell resolution and successfully revealed the spatial heterogeneity of immune cells in inflammation-induced tumors. Additionally, SRT technology is anticipated to lead to the elucidation of the spatial dependence of tumor pathogenesis.Moncada et al.[102]described a multimodal cross-analysis approach for sequencing data, which was applied to primary pancreatic tumors and used to identify subpopulations of ductal cells, macrophages, dendritic cells, and cancer cells with spatially restricted enrichment and coenrichment that were distinct from those of other cell types,identifying the co-localization of inflammatory fibroblasts and cancer cells expressing stress response gene modules. Recent advances have also been made in the field of liver cancer using SRT technology,since the liver is an important site for tumor metastasis.Massalha et al. [103] applied LCM and smFISH to malignant and adjacent non-malignant liver tissue from patients with liver metastases and discovered that stromal cells exhibit recurrent,patient-independent expression programs and reconstructed ligand-receptor profiles, elucidating molecular cross-talk between tumor and stromal cell types.
3.2. Tumor pathology diagnosis
Staining or immunohistochemical techniques to observe tissue morphology under a microscope have been used to diagnose cancer and comprehend how cancer cells spread through healthy tissue.However, molecular changes can precede histologically detectable morphological changes. SRM and SRT provide a more sensitive platform to characterize disease states with an early onset [104].Owing to the fact that multi-omics and imaging technology incorporate multi-molecular information and precise location, they can help discover tumor biomarkers and determine the boundaries of tumors [105]. He et al. [106] developed ST-Net, a deep learning algorithm that combines spatial transcriptomics (ST) and histological images to capture high-resolution heterogeneity in gene expression. They applied the algorithm to identify more than 100 genes from breast cancer, including known intra-tumor heterogeneous breast cancer biomarkers and co-localized genes required for tumor growth and immune responses, and discovered gene expression heterogeneity within tumors, demonstrating that the combination of SRT and deep learning can be used to predict tumor progression. By imaging metabolites in prostate cancer tissue samples, Banerjee et al. [107] discovered statistically significant differences in the distribution of glucose/citrate ratios between cancerous and normal tissues, which could serve as a predictor of prostate cancer. Roudnicky et al. [108] characterized differential expression of the transcriptome of the tumor vascular system in human invasive bladder cancer using LCM and transcriptional analysis, identified upregulation of the expression of genes involved in proliferation,the cell cycle,angiogenesis,inflammation,and transforming growth factor signaling in the tumor vascular system, and tentatively identified ANGPTL2 as a potential biomarker that could predict human invasive bladder cancer. Sun et al. [109] optimized a MSI technique for the broad coverage of carnitine, observed a total of 17 carnitine species, and discovered that L-carnitine and short-chain acyl carnitine undergo metabolic reprogramming in breast cancer.In addition,to accurately identify breast cancers,a classification model based on the carnitine profiles of 170 cancer samples and 128 normal samples was developed.Some biomarkers,in addition to being used to diagnose cancer,also provide prognostic information.Using MALDI-MSI,Loch et al.[110]successfully identified signature peptides corresponding to nine protein intensity distribution alterations in pancreatic cancer.These signatures were significantly associated with poor prognostic parameters and lymphatic vessel invasion,lymph node metastasis,and vascular invasion, demonstrating the prognostic value of its workflow for the feasible identification of characteristic peptides.This method of classifying cancer foci based on the transcriptome and metabolome was found to be more accurate than pathologist annotations. Margulis et al. [111] revealed changes in lipids and their metabolites in basal cell carcinoma and discovered that the relative and absolute abundances of fatty acids,such as arachidonic acid, glycerophosphoglycerol, and glycerophosphoserine, are significantly increased in basal cell carcinoma,which can be used to distinguish basal cell carcinoma from adjacent normal skin,achieving a diagnostic accuracy of up to 94.1%. Berglund et al.investigated whole-tissue gene expression heterogeneity in multifocal prostate cancer by applying SRT techniques, combined with data from an unsupervised probabilistic framework analysis developed to more accurately depict the extent of cancer foci and identify gene expression gradients in the stroma adjacent to tumor regions. This resulted in re-stratification of the TME, with results indicating that the TME might precede the occurrence of genetic alterations in tumor cells (Fig. 4) [112].

Fig. 4. Spatial gene expression heterogeneity within the cancer tissue sample. (A) Factor activity maps for selected factors corresponding to epithelial, stromal, cancerous, prostatic intraepithelial neoplasia (PIN), or inflamed regions. (B) Annotated brightfield image of hematoxylin and eosin (H&E)-stained tissue section. (C) Heatmap of 20 most variable genes between cancer,PIN,and normal gland regions.Arrows highlight genes of interest validated by immunohistochemistry(IHC).(D)First two principal components of spot sets from C separate cancer, PIN, and normal regions. (E) Array dot plots for serine peptidase inhibitor kazal type 1 (SPINK1) and NPY. Circle size in array dot plots indicates normalized spatial transcriptomics(ST)counts.(F)IHC staining for SPINK1 and neuropeptide Y(NPY)of an adjacent section on the ST array.Nuclei are stained with 4',6-diamidino-2-phenylindole(DAPI;blue).Scale bar indicates 1 mm.UBC:ubiquitin C;NR4A1:nuclear receptor subfamily 4 group A member 1;IER2:immediate early response protein 2.Reprinted from Ref.[112]with permission.
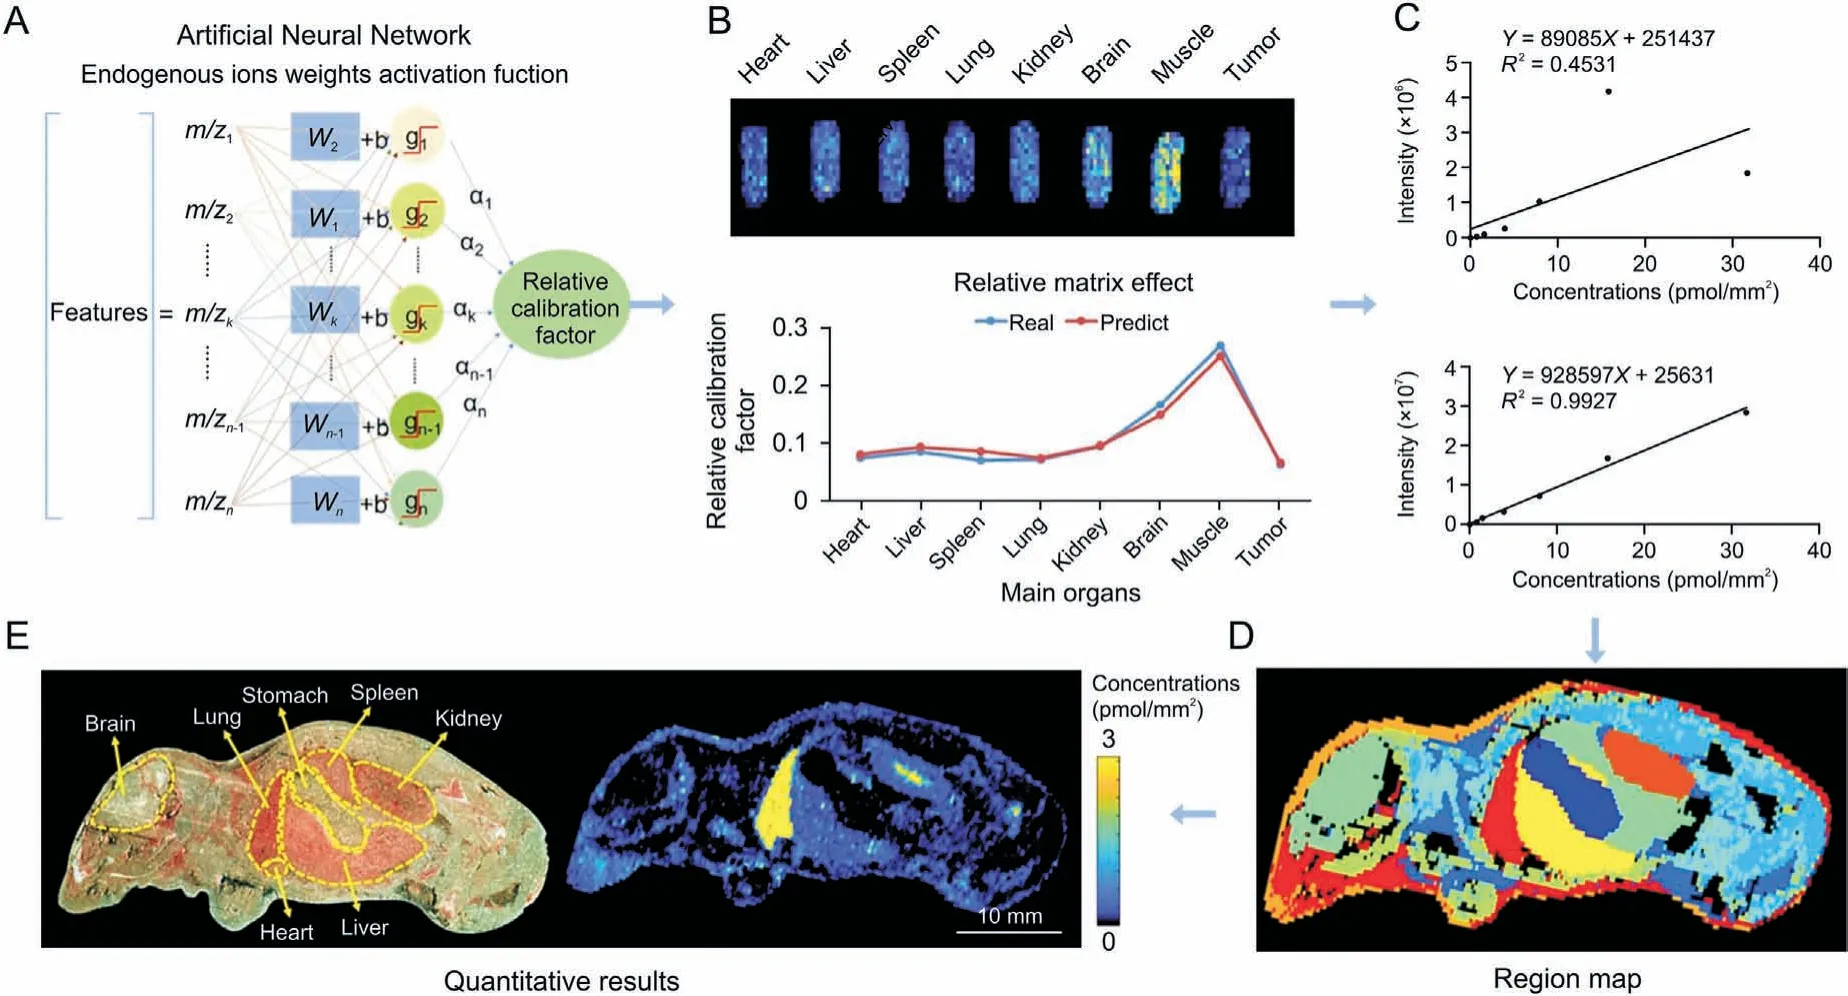
Fig.5. Application of the virtual calibration quantitative mass spectrometry imaging strategy to visualize antitumor drugs on whole-body animal sections.(A)The machine learning method to predict the relative calibration factor based on the endogenous metabolites.(B) The imaging of relative calibration factors of different organs (top)and the comparison between predicted and true values of the relative calibration factor (bottom). (C) The non-calibration and virtual calibration standard curves constructed with the drug amount versus the non-calibrated(top)and calibrated(bottom)drug ion intensities,respectively.(D)The image of whole-body sample segmentation by automatic pixel labelling using Kmeans and t-distributed stochastic neighbor embedding(t-SNE)clustering analysis.(E)The result of drug quantitative visualization and the optical image of the sample.Reprinted from Ref. [128] with permission.
Cancer prognosis and clinical treatment decisions are reliant upon the precise classification of tumor types and grades [113].High-grade tumors are typically more likely to grow and spread.In clinical cancer research, therefore, the correct identification of the tumor type is of great importance [114]. The conventional pathology methods currently employed in clinical practice are timeconsuming and subject to bias owing to reaction conditions and subjective data interpretation. In contrast, SRM and SRT can be modeled for unbiased predictive analysis and can be used to simultaneously obtain different types of information, such as metabolomes or transcriptomes, according to recent breast cancer research.The prediction models developed by applying a machine learning algorithm to four SRT breast cancer datasets clearly distinguished two subtypes of ductal carcinoma in situ and invasive ductal carcinoma [115]. Santoro et al. [116] used DESI-MSI combined with conventional pathology for the metabolomic analysis of different breast cancer molecular subtypes and found different lipid compositions among invasive breast cancer,ductal carcinoma in situ, and adjacent benign tissue, wherein highly saturated fatty acids and antioxidant molecules were able to differentiate invasive breast cancer from adjacent benign tissue, and fatty acids and glycerophospholipids could differentiate between ductal carcinoma. Porcari et al. [117] conducted a multicenter study of lipid profiles in invasive ductal carcinoma tissue samples using DESI-MSI to develop a diagnostic model for breast cancer, and discovered significant changes in the abundance of free fatty acids and glycosphingolipids,which might be of high clinical utility as biomarkers for the diagnosis of various types of breast cancer.Zhang et al.[118]developed the least absolute shrinkage and selection operator(LASSO) prediction model based on MSI,identified normal kidney,renal cell tumor, and renal cell carcinoma tissues by analyzing the distribution of small molecule metabolites and lipids, and distinguished three subtypes of renal cell carcinoma.
3.3. Evaluation of anti-tumor drugs and immunotherapy
The presence of tumor heterogeneity, which confers different levels of drug therapy sensitivity to different tumor cells or different regions of the same tumor, is one of the most important factors influencing the ability of drugs to penetrate tumor tissue and reach the therapeutic site.With the expansion of immunotherapies for the treatment of multiple tumors based on basic research and clinical oncology,the complexity of the TME has become a central barrier to elucidating poorly defined mechanisms of drug resistance, facilitating biomarker-driven drug discovery, and tailoring personalized therapy[119].To elucidate the mechanisms associated with effective drug discovery and biomarker implementation, it is necessary to investigate the dynamic interactions within the TME [120,121].MSI provides simultaneous data on the biodistribution,metabolism,and delivery of drugs in tissues, as well as the molecular profiles of endogenous metabolites, lipids, and proteins and pharmacokinetic or pharmacodynamic measurements at a cellular resolution in tissue sections or clinical biopsies. It is now a potent and versatile technique that can support contemporary drug research and development[122-124].Different metabolic phenotype-targeted drugs can induce cancer cell-specific cytotoxic effects,providing new ideas for next-generation cancer therapies[125].Morosi et al.[126]combined quantitative MSI with LC-MS/MS to propose an accurate and reproducible imaging method for determining the distribution of niraparib and olaparib in tumor tissues. It was capable of quantifying both drugs in every pixel of the tissue image while maintaining spatial information.The results indicated that niraparib is distributed uniformly throughout the tumor and is associated with greater exposure. Tobias et al. [127] utilized paper-based cultures (PBCs)coupled with MSI to develop a MALDI-MSI-PBC drug screening platform capable of assessing drug penetration and metabolism in a large number of samples in a non-targeted, rapid, and automated manner. Zhang et al. used a virtual calibration-based quantitative mass spectrometry imaging method to accurately quantify the distribution and tumor-targeting efficiency of paclitaxel (PTX) and its prodrug(PTX-R)in whole-body animal sections.They demonstrated that in the PTX-R group,both the prodrug and metabolized PTX were predominantly distributed in tumor tissues,with a 50-fold increase in targeting efficiency and a significant reduction in systemic toxicity(Fig. 5) [128]. Song et al. [129] proposed a metric called metabolic perturbation score (MPS) to reveal spatially resolved functional metabolic responses associated with disease progression or drug action. Applying the minkowski distance-based MPS, it was found that the molecular mechanisms of PTX action of antitumor drugs are related to methylation,methionine,and cysteine metabolism.Wang et al. [130] applied MSI to discover active choline metabolism in tumors and developed a choline-modified strategy for small molecule-drug conjugates design. This metabolic vulnerabilitydriven strategy greatly improves the targeting and reduces the toxicity of cytotoxic drugs.
Immunotherapy aims to improve the antitumor immune response by promoting activation of the immune system to attack cancer cells using natural mechanisms in vivo [131]. It has demonstrated great promise for the treatment of malignant solid tumors.Therefore,to improve the efficacy of immunotherapy,it is necessary to investigate the mechanisms underlying cellular and molecular remodeling in the TME and to identify potential intervention targets.Qi et al. [132] analyzed cells from colorectal cancer tumors and adjacent tissues, validated the tight localization of tumor-specific FAP+fibroblasts and SPP1+macrophages using immunofluorescent staining and spatial transcriptomics, and discovered that patients with high FAP or SPP1 expression benefitted less therapeutically from anti-PD-L1 treatment.Improving immunotherapy by disrupting the interaction between FAP+fibroblasts and SPP1+macrophages was explored in this study. Ji et al. [133] analyzed the expression of immune-related cells and chemokines and receptors,such as CXCR3,CXCR6,and CXCR4,in the TME of human squamous cell carcinoma by combining SRT with single-cell sequencing. CCR8 was found to be uniquely expressed in Tregs, indicating that it is a potential therapeutic target for inhibiting the recruitment of these cells.
4. Conclusions and future perspectives
To explain the spatial and temporal dynamics of tumors, the difficult study of tumor heterogeneity necessitates a non-targeted molecular analysis method. The SRT and SRM can be utilized to visualize gene expression in organisms and to obtain information on metabolite concentrations and tissue distribution in the organism, respectively, both of which are essential for cancer research. In recent years, technological advancements have substantially improved spatial resolution and detection throughput.Spatial-omic technologies such as MALDI-MSI, AFADESI-MSI,10x Genomics Visium, and FISSEQ have been commercialized,becoming essential methods to study the mechanism underlying tumor development and to identify biomarkers.
Although current spatial multi-omic technologies have undergone a number of optimizations,there is still considerable room for improvement in terms of precise quantification and data processing.Complete quantification is a formidable obstacle for molecular imaging techniques,it is dependent not only on the limitations of the instruments but also on the calibration and standardizationprotocols employed.The current subcellular discriminative capacity obtained with spatial multi-omics represents a direction for future development,such that cell type identification can be performed using tissue in situ and the material information exchange and interactions between tumorcells andimmune cells can be studied in depth.Thiswill provide new avenues for tumor research. Moreover, as the spatial resolution increases, the volume of data grows exponentially,necessitating the development of standardized and normalized data processing procedures, the integration and establishment of databases, and the management and interpretation of data. These are crucial issues that must be addressed in spatially resolved omics.
Currently, multi-omic technologies have been subjected to gradual interconvergence.Metabolites are the end product of gene transcription in organisms and are internally and externally controlled.Using the SRT to obtain a large number of differentially expressed genes and correlation analysis with differential metabolites obtained from the SRM, the complex biological processes within tumors can be explained in depth at both cause and effect levels, and the joint analysis of these two areas will expand the scope of cancer research.
CRediT author statement
Yanhe Zhou:Investigation, Data curation, Supervision, Visualization,Writing-Original draft preparation,Reviewing and Editing;Xinyi JiangandXiangyi Wang: Data curation, Investigation,Jianpeng HuangandTong Li:Conceptualization,Supervision;Hongtao JinandJiuming He: Funding acquisition, Resources, Supervision,Project administration, Writing -Reviewing and Editing.
Declaration of competing interest
The authors declare that there are no conflicts of interest.
Acknowledgments
This study was supported by the National Natural Science Foundation of China (Grant No.: 81974500) and the Chinese Academy of Medical Sciences Innovation Fund for Medical Sciences,China (Grant No.: 2022-I2M-2-001).
 Journal of Pharmaceutical Analysis2023年8期
- Journal of Pharmaceutical Analysis的其它文章
- Single-cell and spatially resolved omics: Advances and limitations
- Preface for Special Issue: Single-Cell and Spatially Resolved Omics
- Single-cell transcriptome analysis uncovers underlying mechanisms of acute liver injury induced by tripterygium glycosides tablet in mice
- Single-cell and spatial heterogeneity landscapes of mature epicardial cells
- A single-cell landscape of triptolide-associated testicular toxicity in mice
- Temporal dynamics of microglia-astrocyte interaction in neuroprotective glial scar formation after intracerebral hemorrhage
