Adsorption dynamics of double-stranded DNA on a graphene oxide surface with both large unoxidized and oxidized regions
Mengjiao Wu(吳夢(mèng)嬌), Huishu Ma(馬慧姝), Haiping Fang(方海平), Li Yang(陽(yáng)麗), and Xiaoling Lei(雷曉玲),?
1College of Physics Science and Technology,Guangxi Normal University,Guilin 541004,China
2Division of Interfacial Water and Key Laboratory of Interfacial Physics and Technology,Shanghai Institute of Applied Physics,Chinese Academy of Sciences,Shanghai 201800,China
3Changzhou Vocational Institute of Mechatronic Technology,Professional Basic Department,Changzhou 213164,China
4School of Physics,East China University of Science and Technology,Shanghai 200237,China
Keywords: double-strand DNA(dsDNA),molecular dynamics simulation,adsorption dynamic,graphene oxide
1. Introduction
Due to their characteristics of structural stability, specific base pairing and high information storage,[1]DNA molecules, as molecular devices, have attracted extensive attention in recent years when coupled with nanomaterials such as gold nanoparticles[2–5]and quantum dots.[6–8]The functional structures formed by the coupling of DNA molecules and the two-dimensional nanomaterials graphene and graphene oxide (GO) have been widely used in the fields of biosensors,[9–12]biomedicine,[13–15]nanotechnology and materials science.[16,17]GO, as the water-soluble dispersion of graphene, not only processes unique optical, electronic and mechanical properties but also has excellent biocompatibility and has been extensively applied in DNA/GObased biosensors.[18–20]The applications of DNA/GO-based biosensors are based on the preferential binding of GO to single-stranded DNA (ssDNA) molecules compared with double-stranded DNA (dsDNA) molecules.[21,22]When hybridized with the complementary ssDNA molecules, the ss-DNA molecules adsorbed on a GO surface can be released from the GO surface by forming dsDNA molecules, causing a fluorescence signal to be restored.[23]To improve the performance of this application, for example for fast, sensitive and selective detection of biomolecules,[10]it is important to understand the mechanism of interaction between DNA molecules and GO nanosheets. Up to now, extensive studies have been performed to understand the mechanism of interaction between ssDNA molecules and GO surfaces. Experimental and theoretical studies have proved that hydrophobic,[24,25]hydrogen bonding[26]andπ–πstacking interactions[27]are important for the interaction between ssDNA molecules and GO nanosheets, and molecular dynamics (MD) simulations have shown that ssDNA molecules can be stably adsorbed with their nucleobases lying nearly flat on the surface byπ–πstacking interactions between the nucleobases and the hexagonal cells of GO.[28]
Despite these studies, understanding of the interactions between dsDNA molecules and GO remains elusive. There is some experimental evidence that dsDNA molecules can be adsorbed on GO surfaces, possibly facilitated by partial deformation of the double helix on GO.[19,26]Kimet al. experimentally studied the effects of pH and salt concentration of the solution on the adsorption behavior of dsDNA on GO.[29]They showed that the adsorption efficiency of dsDNA was greatly increased,especially at pH 6.0 and 7.2 in the presence of 10 mM MgCl2and 0.1 M NaCl.Moreover,MD simulations also provide insights into the mechanism of interaction of ds-DNA molecules with one-dimensional and two-dimensional nanomaterials such as carbon nanotubes, graphene, GO and phosphorene. When exploring the molecular details and selfassembly mechanism by MD simulations, Zhao founded the primary driving force to be theπ–πstacking interaction between the end base pairs of dsDNA and the carbon rings of the graphene and carbon nanotube surfaces.[30]He also found that a dsDNA segment can ‘stand up’ on carbon surfaces as well as lie on them. Kabelacet al. investigated the role of the surface charge density of graphene in the structure and orientation of attached dsDNA via MD simulations.[31]They showed that the dsDNA kept its geometry close to the canonical B-DNA form, even at surfaces with high charge densities. They also found that the dsDNA remained oriented more or less perpendicularly to the graphene at uncharged surfaces.Zenget al.studied the mechanism of DNA adsorption on GO via MD simulations.[32]They found that dsDNA was preferentially oriented upright on the surface of GO, resulting in a weaker adsorption energy. Liet al.used both MD simulations and experimental techniques to investigate the binding patterns and dynamics of a dsDNA segment on a phosphorene surface and found that dsDNA adopted an upright orientation on the phosphorene surface regardless of its initial configuration.[33]Using a MD approach, Muraruet al.explored chloride(Cl-)and magnesium (Mg2+) ions that influenced dsDNA adsorption on GO.[34]They worked out that unlike Cl-, divalent Mg2+ions formed bridges between the GO surface and DNA molecules, promoting adsorption through electrostatic interactions. Recently, theoretical and experimental works have proved the coexistence of both large unoxidized and oxidized regions on the GO surface.[35–38]There are some small areas of sp2-hybridized domains, similar to ‘islands’, in oxidized regions.[36,37]This complex structure greatly changes the relevant local properties of GO, such as its hydrophilic and hydrophobic properties. Based on MD simulations, Xuet al.found that ssDNA segments could be stably adsorbed on a GO surface through hydrogen bonding and theπ–πstacking interaction, with preferential binding to the oxidized region compared with the unoxidized region of the GO surface.[39]More importantly,there was a dynamic cooperative adsorption process between the hydrogen bonding andπ–πstacking. Maet al. used MD simulations to reveal the dependence of absorption of ssDNA molecules onto a graphene-based surface on the degree of oxidation.[40]We need to ask how the distribution of the oxidized groups on the GO surface influences the adsorption dynamic process of dsDNA on the GO surface. This is very important for a complete understanding of the interaction mechanism between DNA and GO, especially the desorption of DNA from a GO surface.
In this work, we present the adsorption dynamics of ds-DNA molecules from 4 bp to 24 bp on a GO surface in an aqueous environment using MD simulations. Our simulation results indicate that dsDNA can stably bind with a GO surface through the nucleobases at the terminus,but the short dsDNA(4 bp)and long dsDNA(8 bp–24 bp)molecules have quite different dynamic behaviors and form different adsorption configurations on a GO surface. For 4 bp dsDNA molecules,the structural fluctuation of short dsDNA and the distribution of the oxidized groups on the GO surface have a great influence on the dynamic adsorption process, and the double-stranded structure is partially or totally broken during its dynamic adsorption. Long dsDNA(8 bp–24 bp)molecules can stably adsorb on the GO surface through the terminal bases and stand on the GO surface. To describe the orientation of different ds-DNA molecules on a GO surface, we calculated the contact angleαagbetween the axis of dsDNA molecules and the GO surface.By nonlinear fitting of the contact angleαag,we found that the length of dsDNA is longer than 54 bp whenαag=0°,which means that a dsDNA molecule adsorbed on a GO surface can orient parallel to the GO surface if its length is longer than 54 bp. We attributed this behavior to the flexibility of ds-DNA molecules. The results from this work give a whole picture of the adsorption of dsDNA molecules on a GO surface,and will benefit the design of DNA/GO based biosensors.
2. Methods
2.1. System
The system is composed of dsDNA molecules and GO filled with water molecules; sodium ions are added to neutralize the negative charges from the dsDNA molecules. The basal plane of GO (10.084 nm×10.224 nm) is parallel to thexzplane, and the carbon atoms of GO are constrained aty=0.5 nm using position restraints. The GO model utilized in this study is constructed based on the high correlation between oxidation loci, as reported by Yanget al.[41]The ds-DNA molecule repeats as (ATGC)n, wheren=1, 2, 3, 4,5, 6. As shown in Fig. 1(b), a dsDNA molecule is placed on a GO surface with its helical axis parallel to the basal plane.The distance between the surface of GO and the centroid of dsDNA is 3 nm. Then the minimum distance between the ds-DNA molecule and the GO surface is 2.024 nm and the maximum distance is 3.892 nm in the initial state. The initial structure of the dsDNA molecule in the canonical B-form is generated using the AmberTools package,[42]which corresponds to(ATGC)n. To investigate the length-dependent adsorption of dsDNA on GO in an aqueous environment using MD simulations,simulation systems were constructed as in Table S1.
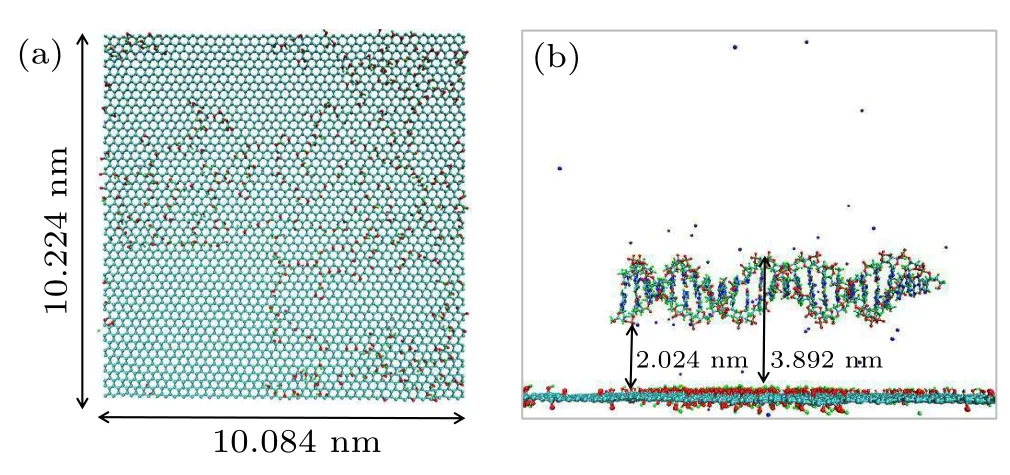
Fig.1. (a) Top view of the GO structure. The oxygen and hydrogen atoms on GO are shown as red and white spheres, respectively. The carbon atoms are represented by the cyan line. (b)The initial system setup for simulations where a dsDNA molecule is embedded in a water box adopting a parallel orientation relative to the GO surface. Na+ is shown as blue van der Waals spheres. Water is shown as transparent.
2.2. MD simulations
Simulations were performed with the NVT ensemble using GROMACS version 4.5.4[43]and the Amber 99SB-ILDN force field was chosen to simulate the dsDNA molecules.[44]Energy minimization was done with dsDNA molecules and GO fixed with a positional restraint of 1000 kJ·mol-1·nm-2,ensuring that only the water molecules and the sodium ions move during energy minimization. All the MD simulations were performed with no restraints on dsDNA molecules.Temperature coupling used velocity rescaling with a stochastic term.[45]The reference temperature for coupling of each group was set to 300 K.Periodic boundary conditions were applied in three dimensions. The time step was set at 2 fs and the data were collected every 2 ps in all simulations. Long-range electrostatics were treated using the particle mesh Ewald[46]method with a short-range cutoff of 1.2 nm and the Lennard–Jones potentials were treated with a cutoff distance of 1.2 nm.The system was solvated using the TIP3P water model.[47]The detailed force-field parameters of GO can be found in previous publications.[48–50]As for the simulation model of graphenebased materials, carbon atoms were modeled as uncharged Lennard–Jones particles with van der Waals parameters ofσCC=3.58 ?A andεCC=0.0663 kcal·mol-1.[49,51–53]The C–C bond balance length was 0.142 nm and the C–C–C bond balance angle was 120°by harmonic potentials with spring constants of 322.55 kcal·mol-1·?A-2and 53.35 kcal·mol-1·rad-2.The planar dihedral angles of C–C–C–C were maintained by spring constants of 3.15 kcal·mol-1. The simulation parameters of–OH,–O–,and–COOH groups on the graphene-based surface were set according to the Amber 99SB-ILPN force field. Molecular graphic images were produced using the visual molecular dynamics VMD package.[54]
3. Results and discussion
To measure the adsorption dynamics of dsDNA molecules on a GO surface, a series of control MD simulation systems were designed by varying the length of dsDNA molecules from 4 bp to 24 bp(4 bp,8 bp,12 bp,16 bp,20 bp,and 24 bp). The GO surfaces were constructed based on the Shi–Tu structure model,on which the distribution of oxidized groups was generated according to the rate constant ratios from the computation by combining density functional theory and conventional transition-state theory.[41]In all systems,the dsDNA molecules were initially placed above the GO surface with their helical axis parallel to the basal plane and a centroid distance of 3 nm on theyaxis. The parameters of these simulation systems are shown in Table S1. Three simulation samples were calculated for each length of dsDNA molecule. All typical snapshots of adsorbed dsDNA molecules on the GO surface are shown in Fig. S1. Long dsDNA molecules could stably adsorb on the GO surface through the terminal nucleobases and adopted a perpendicular orientation relative to the GO surface.These results are consistent with the former study.Unexpectedly the adsorbed short dsDNA(4 bp)molecules had a complex configuration on the GO surface. Three simulation samples formed different adsorption configurations and one was even adsorbed on the GO surface as two separated ssDNA molecules. It is obvious that the GO surface influences the adsorption dynamic of dsDNA molecules.
3.1. Analysis of short dsDNA(4 bp)molecules adsorbed on a GO surface
We first present the adsorption behaviors of 4 bp dsDNA molecules on a GO surface. Figure 2(a) shows side and top views of 4 bp dsDNA molecules adsorbed on a GO surface. It is clear that short dsDNA molecules have a different adsorption configuration on the GO surface. For sample 1,a dsDNA molecule was adsorbed in the unoxidized region of the GO surface through the terminal bases. For sample 2, a dsDNA molecule was also adsorbed in the unoxidized region of the GO surface, but separated into two ssDNA molecules. For sample 3, the dsDNA molecule was adsorbed in the boundary region close to the oxidized region,but there was a broken configuration on the adsorbed terminal compared with long ds-DNA. The different adsorbed configurations of short dsDNA molecules on the GO surface indicate that the GO surface has a great influence on the adsorption dynamics of short dsDNA molecules on the GO surface.
To quantitatively characterize the dynamic adsorption observed in the trajectories, we calculated the number ofπ–πstacking structures between the dsDNA molecule and the GO surface. Here, aπ–πstacking structure is defined as a vertical separation between the base and the GO surface of less than 0.5 nm. As shown in Figs. 2(b)–2(d), there is no contact at the early stage when the dsDNA molecule move freely in bulk water for several to tens of nanoseconds before touching the GO surface. For sample 1, the terminal base formed the firstπ–πstacking structure with the GO surface at about 25 ns, then its finalπ–πstacking structure formed with the GO surface at about 150 ns. Finally the dsDNA molecule was stably adsorbed on the GO surface. For sample 3, the dsDNA molecule quickly stood on the boundary region of the GO surface through the terminal pairing bases at about 75 ns,like the long dsDNA molecule. At about 100 ns, one of the two adsorbed terminal bases moved to the unoxidized region and dragged the other adsorbed base to the unoxidized region.In the drag dynamic process, the hydrogen bonds of the base pair adsorbed on the GO surface were broken during the interaction between the GO surface and the dsDNA molecule.This behavior makes the neighboring bases directly face the GO surface, and then form one moreπ–πstacking structure with the GO surface, as shown in Fig. 2(a). Compared with sample 1,the dsDNA molecule is inclined on the surface and forms threeπ–πstacking structures with the GO surface. For sample 2, the dsDNA molecule quickly stands on the unoxidized region of the GO surface through the terminal pairing bases at about 45 ns,like the long dsDNA molecule. But from 75 ns onwards the dsDNA molecule is unzipped step by step during the interaction between DNA and the oxidized group of GO.Finally there are eightπ–πstacking structures formed with the GO surface.
To obtain more information about the adsorption dynamics between dsDNA molecules and the GO surface,we present typical snapshots of the sample 2 system to highlight the adsorption dynamics shown in Fig.3(b). The dsDNA molecule is initially parallel to the GO surface(Fig.3(b),t=0 ns). Att=37 ns, the dsDNA molecule establishes twoπ–πstacking structures with the GO surface through the terminal bases,and stands on the unoxidized region of the GO surface like the long dsDNA molecules. Then the dsDNA molecule maintains this upright orientation and moves on the unoxidized region of the GO surface. During this movement,the adsorbed terminal bases contact the oxidized functional groups of the boundary region again and again, unbalancing the interaction between the adsorbed pairing bases. Att=75 ns,the hydrogen bonds between the adsorbed base pairing are broken during the continuous unbalancing of the interaction;meanwhile the dsDNA is unzipped. From then on, the dsDNA molecule moves to the unoxidized region with a forked shape on the GO surface.The forked nucleotides provide two directions for the dsDNA to contact the boundary region, and in turn this behavior accelerates unzipping of the dsDNA.Att=210 ns, the second base pairing is broken and the increased number of forked nucleotides provide more opportunity to contact the boundary region. Att=358 ns,the dsDNA molecule is completely separated into two ssDNA molecules;one ssDNA molecule is adsorbed on the boundary region and the other ssDNA molecule still moves in the unoxidized region. After the separation,we were surprised to find that the ssDNA molecule adsorbed along the boundary region moves all the way into the oxidation region. As shown in Fig. 3(b) (t=358 ns and 400 ns),the terminal nucleotide of ssDNA adsorbed on the boundary region has a displacement of about 0.79 nm into the oxidized region. These results provide clear evidence that the distribution of functional oxidation groups on the GO surface has a great influence on the adsorption dynamics of short dsDNA molecules.
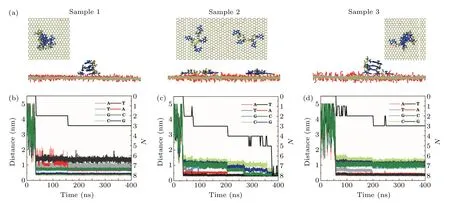
Fig.2. (a)Side and top views of 4 bp dsDNA molecules adsorbed on a GO surface. The oxygen and hydrogen atoms in the GO surface are shown by red and white lines,respectively. The carbon atoms are represented by the silver line. The phosphate backbone and nucleobases of dsDNA are shown by the yellow and blue bonds,respectively. The time evolution of the vertical separation between the bases of sample 1(b),sample 2(c)and sample 3(d)of a 4 bp dsDNA molecule and the GO surface. The black curve represents the number of π–π stacking structures between the 4 bp dsDNA molecule and the GO surface.
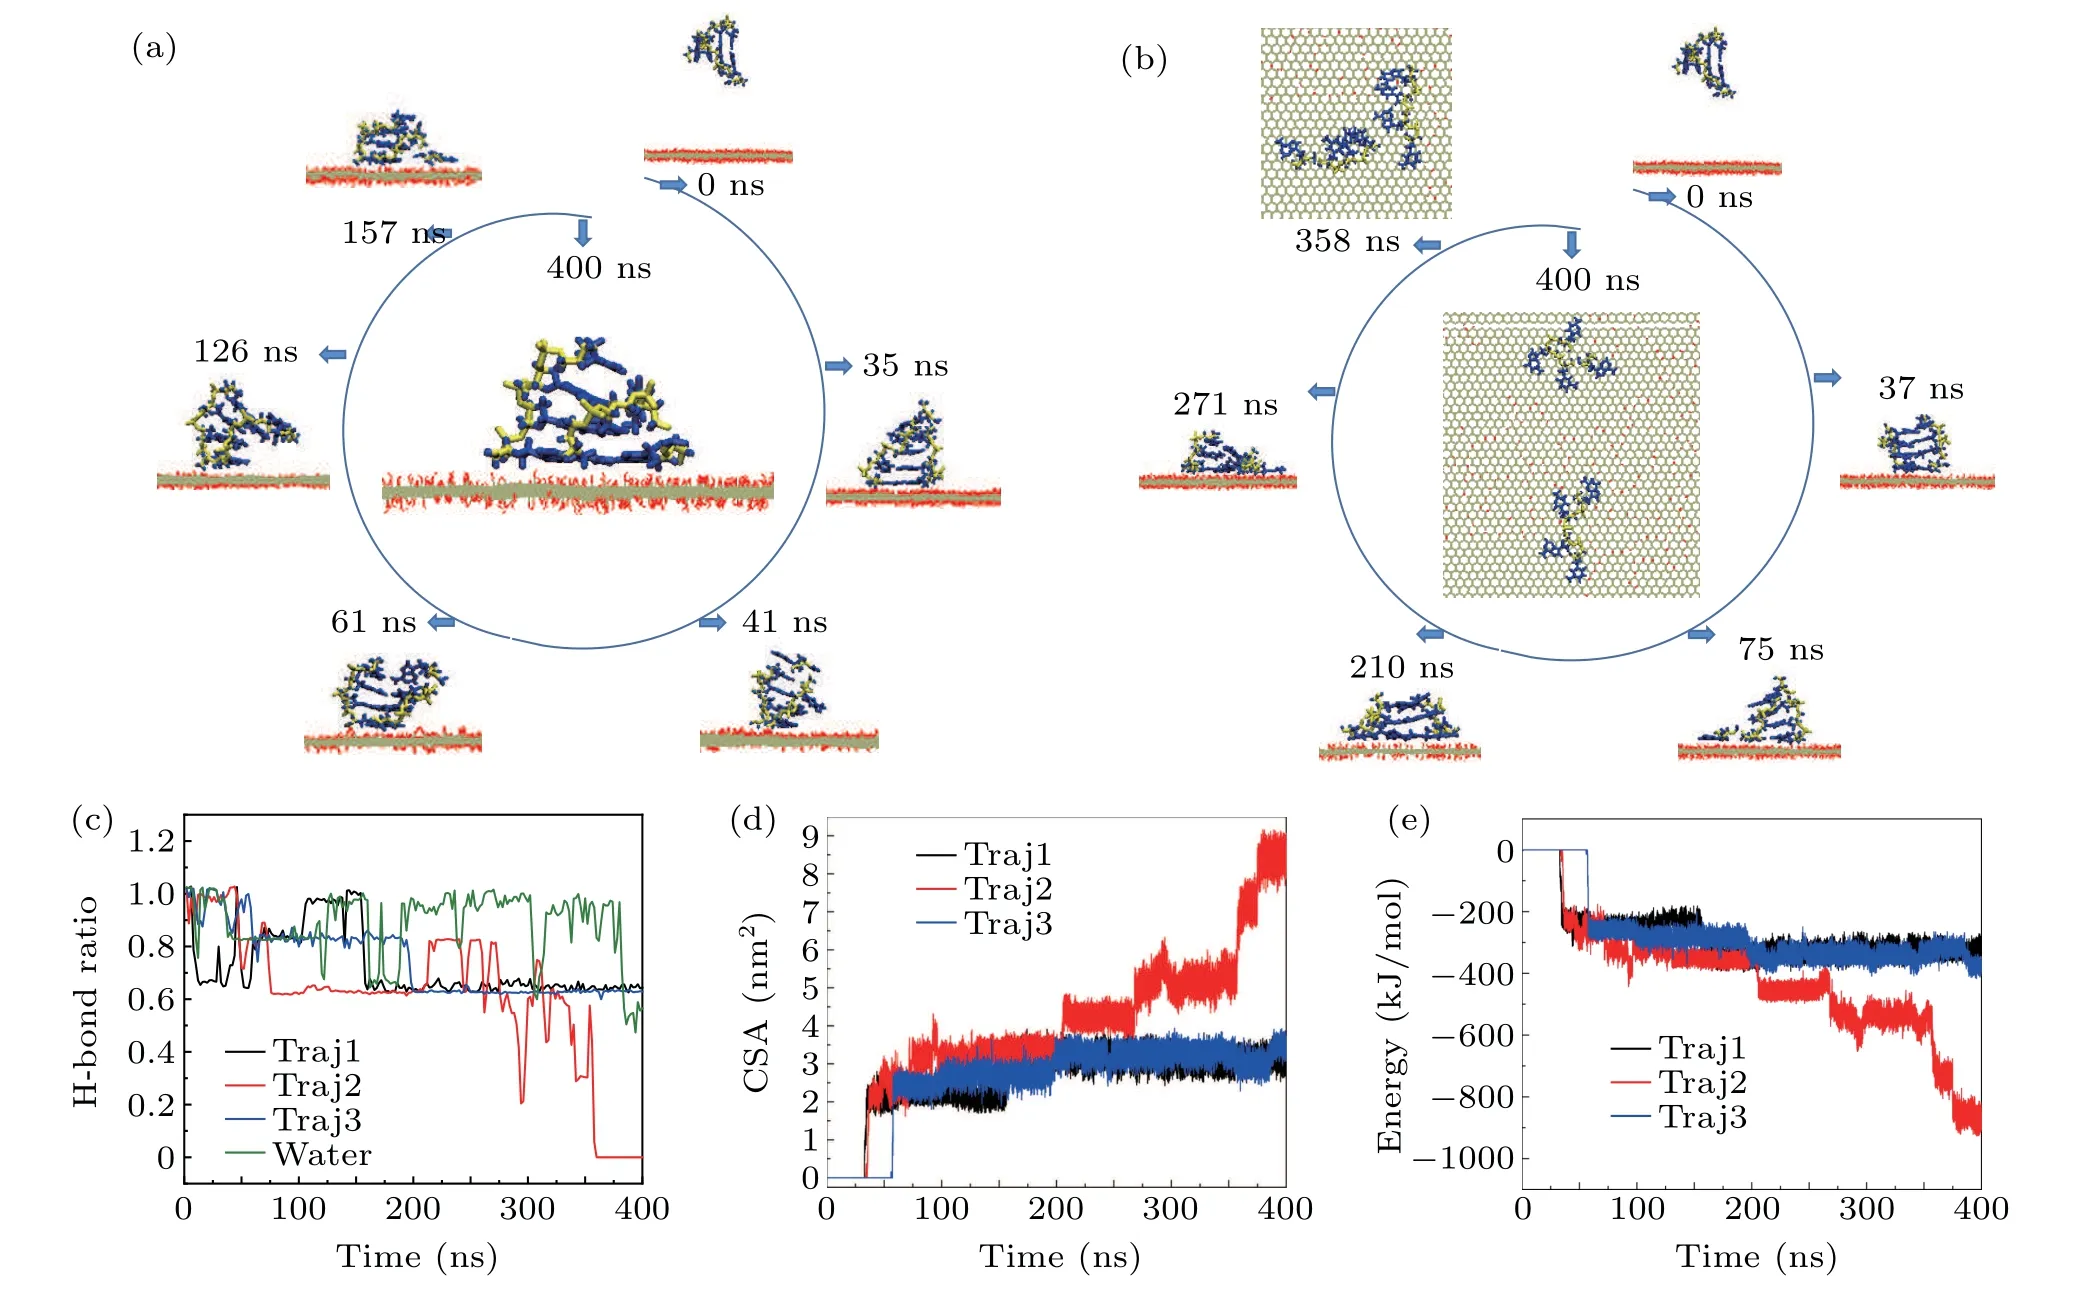
Fig.3. Typical snapshots of sample 1(a)and sample 2(b)of 4 bp dsDNA molecules adsorbed on a GO surface to show the adsorption dynamics of short dsDNA molecules. The oxygen and hydrogen atoms in the GO surface are shown by red and white lines,respectively. The carbon atoms are represented by the silver line. The phosphate backbone and nucleobases of dsDNA are shown by the yellow and blue bonds,respectively. (c)The ratio of the intra-molecular hydrogen bonds in a 4 bp dsDNA molecule as a function of simulation time. Time evolution of the contact surface area (d) and the interaction energy (e)between a 4 bp dsDNA molecule and GO. The data for Traj1, Traj2, and Traj3 were collected from three independent samples. The data in water were collected from 4 bp dsDNA molecules alone in a water environment.
As we know, the structural stability of 4 bp dsDNA molecules is weaker than that of long dsDNA molecules.Does this structural characteristic cause the structure to break? The intra-molecular hydrogen bonds of dsDNA molecules are especially important for maintaining its double-helix structure.We therefore calculated the time evolution of the ratio of the intra-molecular hydrogen bonds of dsDNA molecules adsorbed on a GO surface compared with that in water. Figure 3(c)shows the ratio of the intra-molecular hydrogen bonds in a dsDNA molecule as a function of simulation time during different dynamic processes. In water,the intra-molecular hydrogen bonds fluctuate around the initial structure,and sometimes even 40% of the intra-molecular hydrogen bonds are broken, but the 4 bp dsDNA molecule maintains its initial structure well during the whole dynamic process. We present typical snapshots of the sample 1 system to illustrate the influence of structural stability on the adsorption dynamics shown in Fig. 3(a). The dsDNA molecule was initially parallel to the GO surface (Fig. 3(a)t= 0 ns). Att= 35 ns, the ds-DNA molecule contacts the GO surface by forming twoπ–πstacking structures on the unoxidized region of the GO surface through the terminal bases, and stands on the unoxidized region of the GO surface like the long dsDNA molecules. Then the dsDNA molecule moves to the unoxidized region. During the adsorption and motion, the intra-molecular hydrogen bonds of the other end are broken and close frequently, as shown in Fig.3(a)(t=41 ns,61 ns,and 126 ns),and the ratio is around 80%,fluctuating between 60%and 100%as shown Fig. 3(c). When 60% of the intra-molecular hydrogen bonds are broken it means that nearly two base pairings are broken.Att=157 ns,one free terminal base is bent to the GO surface and forms one moreπ–πstacking structure. Finally, the ds-DNA molecule maintains 60%of its intra-molecular hydrogen bonds in samples 1 and 3. It should be pointed out the fluctuation of the intra-molecular hydrogen bonds after stable adsorption on the GO surface is much smaller than in water. For sample 2, the fluctuation of intra-molecular hydrogen bonds decreased from 100% to zero during the interaction between dsDNA molecules and the GO surface. From the change in sample 1, it is obvious that the structural fluctuation of short dsDNA molecules also has a great influence on the adsorption dynamics.
3.2. Analysis of long dsDNA molecules (8 bp–24 bp) adsorbed on a GO surface
Side views of different length dsDNA molecules from 8 bp to 24 bp adsorbed on a GO surface are shown in Fig.4. It is clear that dsDNA molecules can be stably adsorbed on a GO surface through the nucleobases at the terminus. Compared with the complex adsorption configurations of short dsDNA molecules (4 bp), the long dsDNA molecules with terminal nucleobases are all perpendicular to the GO surface. A previous study on the interactions between dsDNA molecules and graphene showed that a dsDNA molecule can‘stand up’on the carbon surface and also lie on it.[30]We calculated the angleβrgbetween the adsorbed bases and the GO surface, defined as the angle between the normal vectors of the bases’ plane and the normal vectors of the GO plane as shown in Fig. S4.From Fig.5,the angleβrgbetween the adsorbed bases and the GO surface is maintained at about 12.5°,which means that the adsorbed bases are almost parallel to the GO surface whatever the length of the dsDNA molecule. Using MD simulations,the influence of the role of the surface charge density of the graphene in the structure and the orientation of the attached dsDNA molecule were investigated, and dsDNA molecules maintain their geometry well even at surfaces with high charge densities.[31]The ratio of the intra-molecular hydrogen bonds of dsDNA molecules adsorbed on a GO surface was calculated to evaluate the structural stability of dsDNA molecules on a GO surface. As shown in Figs. S5(a)–S5(e), the ratio of the intra-molecular hydrogen bonds of the long dsDNA molecules fluctuated around the initial structure and remained relatively constant during the whole adsorption dynamics process. It is clear that dsDNA molecules maintain their double-helix structure well when adsorbed on a GO surface.
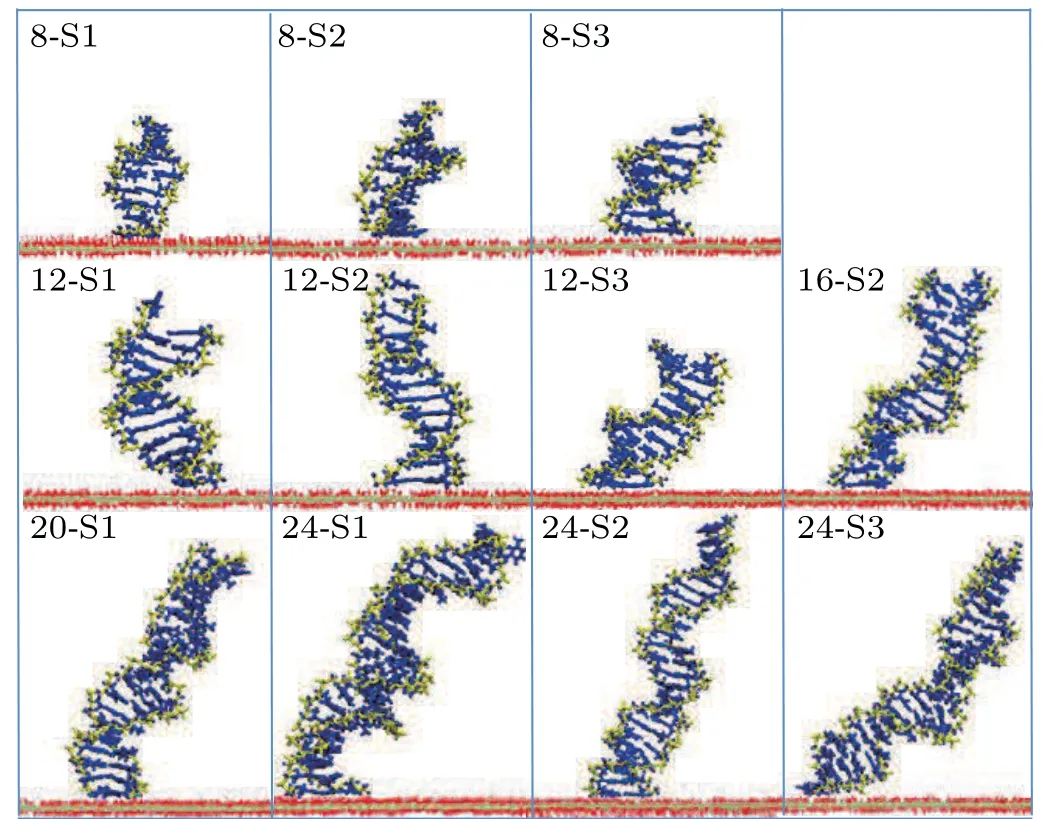
Fig.4. Typical snapshots of adsorbed long dsDNA molecules on a GO surface. The phosphate backbone and nucleobases of dsDNA are shown by the yellow and blue bonds,respectively. The oxygen and hydrogen atoms in the GO surface are shown by red and white lines,respectively. The carbon atoms are represented by the silver line.
From Fig. 4 we can see that the orientation of dsDNA molecules on a GO surface is quite different for dsDNA molecules of different lengths. Does the distribution of the oxidized groups on a GO surface influence the orientation of dsDNA molecules? The work of Kabelacet al. showed the orientation of dsDNA molecules on a graphene surface to be affected by different surface charges on the graphene surface.To better understand our question, we calculated the orientation of dsDNA molecules adsorbed on a GO surface as described by the contact angleαagbetween the axis of the ds-DNA molecule and the GO surface as shown in Figs. S6(a)–S6(e). The contact angleαagis defined as the average complementary angle between the normal vectors of base pairs(dsDNA) and the normal vectors of the GO surface.[31]Figure 6(a) shows the average contact angleαagduring the last 50 ns, and the averageαagdeclines from 72°for 8 bp to 55°for 24 bp. The decrease of the averageαagfrom 8 bp to 24 bp means that the axis of the dsDNA molecule is gradually inclined to the GO surface from 8 bp to 24 bp,and the decrease is not uniform. To further reveal the correlation betweenαagand the length of the dsDNA molecule, we used a nonlinear function to fit our data. The resulting functions are as follows:

whereα0=89.6329,A=12.7766, andγ=0.0359. Based on the fitting function, we can conclude that the length of a dsDNA molecule is longer than 54 bp whenαag=0°, which means that a dsDNA molecule adsorbed on a GO surface can become parallel to the GO surface if the dsDNA molecule is longer than 54 bp. With increasing length the flexibility of a dsDNA molecule also increases,and this increasing flexibility gives the adsorbed dsDNA molecule more chance to contact the GO surface with the free terminal. It is not hard to explain why the relevant length of a dsDNA molecule is 54 bp whenαag=0°as it is very close to the persistence length of short dsDNA molecules.We know that the flexibility of the ds-DNA molecule,observed experimentally as various deformations such as twisting,bending and stretching,plays an important role in its biological function and nanomaterial applications. Long dsDNA(kilobase pairs)molecules can be well described by the wormlike chain model with a persistence length of 50 nm, but short dsDNA molecules are more flexible than kilobase pairs of dsDNA,as proved by experiment.[55,56]Considering that DNA packaging occurs at a short DNA length scale(<50 nm)during active biological processes,our simulation results offer new insight to help understand the mechanical properties of short dsDNA molecules.
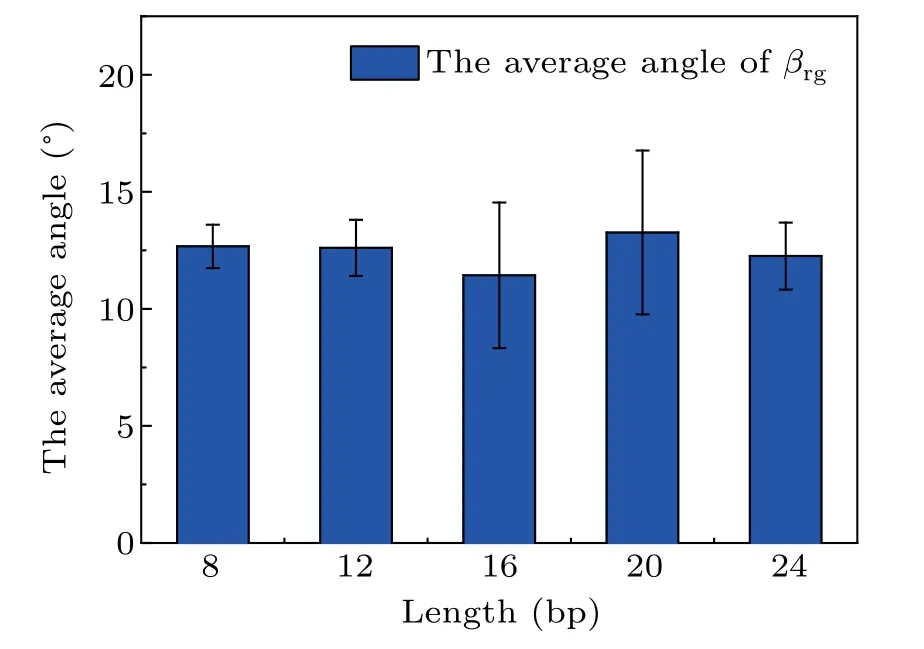
Fig.5.The average angle βrg between the adsorbed bases and the GO surface in the last 50 ns for different length dsDNA molecules.
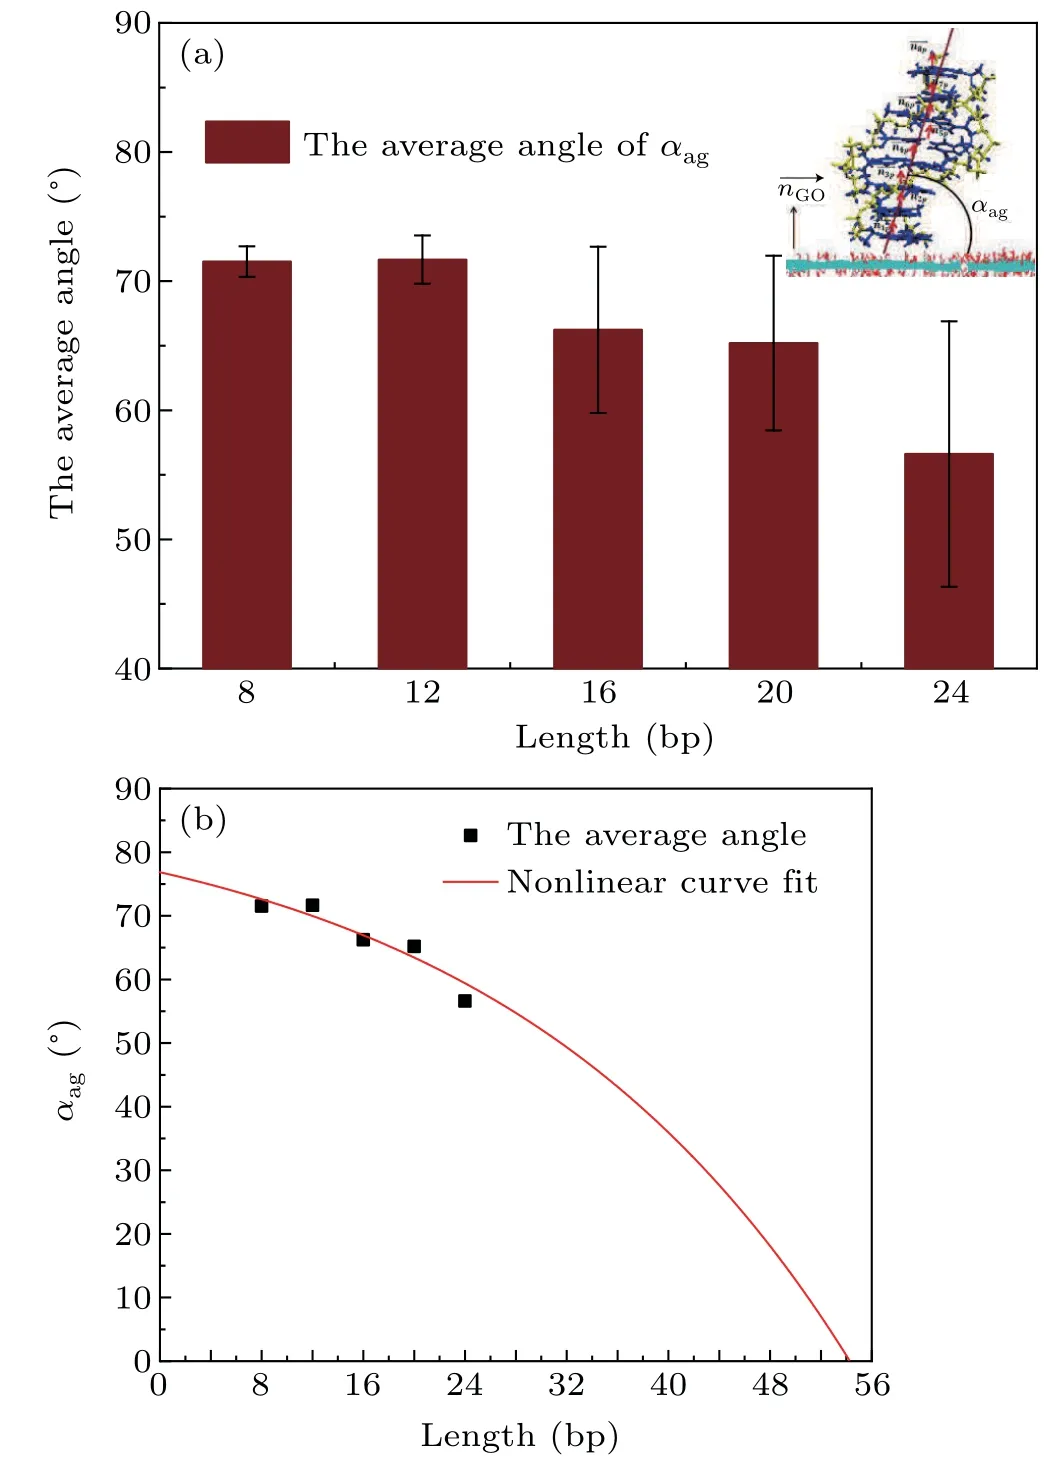
Fig.6. (a) The average contact angle αag between the axis of a dsDNA molecule and the GO surface in the last 50 ns with different length dsDNA molecules.A schematic of αag is shown in the inset.(b)The averaged contact angle αag between the axis of a dsDNA molecule and the GO surface in the last 50 ns with different length dsDNA molecules fitted by a nonlinear function. Black dots,the average contact angle αag between the axis of a dsDNA molecule and the GO surface;red curve,the nonlinear fitting function.
4. Conclusion
In summary, the adsorption of dsDNA molecules of different lengths (4 bp–24 bp) onto a GO surface was systematically studied by MD simulations. Our simulation results reveal that dsDNA molecules can be adsorbed on a GO surface through their terminal bases and stand on the GO surface,but the adsorption stability is different for short (4 bp) and long (8 bp–24 bp) dsDNA molecules. The adsorption stability of short dsDNA(4 bp)molecules is affected by the structural fluctuation of short dsDNA and the distribution of the oxidized groups on the GO surface after dsDNA molecules have stood on the GO surface. Among our three 4 bp ds-DNA molecule simulations, the double-helical structure of one dsDNA molecule was broken and one ssDNA bent to the GO surface due to structural fluctuation; the other two ds-DNA molecules were partially or completely unzipped during interaction between the dsDNA molecules and the oxidized groups. It is obvious that the adsorption dynamics of dsDNA molecules on a GO surface is affected by the structural fluctuation of short dsDNA and the local structure of the GO surface. For long dsDNA(8 bp–24 bp)molecules, adsorption is stable. By nonlinear fitting of the contact angle between the axis of a dsDNA molecule and a GO surface,we find that ds-DNA molecules adsorbed on a GO surface have the chance of becoming parallel to the GO surface if the length of the dsDNA molecule is longer than 54 bp. We attribute this behavior to the flexibility of dsDNA molecules. With increasing length,the flexibility of dsDNA molecules also increases,and this increasing flexibility gives the adsorbed dsDNA molecules more chance to contact the GO surface with their free terminals. This work provides a whole picture of the adsorption of dsDNA molecules on GO surfaces and offers new ways to understand the mechanism of interaction between DNA and GO, which may prompt further investigation into the design of DNA/GObased biosensors.
Acknowledgments
We gratefully acknowledge Dr Liuhua Mu and Dr Zejun Zhang for helpful discussions and their crucial reading of this manuscript.
Project supported by the National Natural Science Foundation of China (Grant No. 11974366), the Fundamental Research Funds for the Central Universities, China, the Supercomputer Center of the Chinese Academy of Sciences, and the Shanghai Supercomputer Center of China.
- Chinese Physics B的其它文章
- LAMOST medium-resolution spectroscopic survey of binarity and exotic star(LAMOST-MRS-B):Observation strategy and target selection
- Vertex centrality of complex networks based on joint nonnegative matrix factorization and graph embedding
- A novel lattice model integrating the cooperative deviation of density and optimal flux under V2X environment
- Effect of a static pedestrian as an exit obstacle on evacuation
- Chiral lateral optical force near plasmonic ring induced by Laguerre–Gaussian beam
- A polarization mismatched p-GaN/p-Al0.25Ga0.75N/p-GaN structure to improve the hole injection for GaN based micro-LED with secondary etched mesa

