An attention‐based cascade R‐CNN model for sternum fracture detection in X‐ray images
Yang Jia|Haijuan Wang|Weiguang Chen|Yagang Wang|Bin Yang
1School of Computer,Xi'an University of Posts and Telecommunications,Xi'an,Shaanxi,China
2Shaanxi Key Laboratory of Network Data Intelligent Processing,Xi'an University of Posts and Telecommunications,Xi'an,Shaanxi,China
3Xi'an Key Laboratory of Big Data and Intelligent Computing,Xi'an,Shaanxi,China
4Department of Radiology,Xi'an Honghui Hospital,Xi'an,China
Abstract Fracture is one of the most common and unexpected traumas.If not treated in time,it may cause serious consequences such as joint stiffness,traumatic arthritis,and nerve injury.Using computer vision technology to detect fractures can reduce the workload and misdiagnosis of fractures and also improve the fracture detection speed.However,there are still some problems in sternum fracture detection,such as the low detection rate of small and occult fractures.In this work,the authors have constructed a dataset with 1227 labelled X‐ray images for sternum fracture detection.The authors designed a fully automatic fracture detection model based on a deep convolution neural network(CNN).The authors used cascade R‐CNN,attention mechanism,and atrous convolution to optimise the detection of small fractures in a large X‐ray image with big local variations.The authors compared the detection results of YOLOv5 model,cascade R‐CNN and other state‐of‐the‐art models.The authors found that the convolution neural network based on cascade and attention mechanism models has a better detection effect and arrives at an mAP of 0.71,which is much better than using the YOLOv5 model(mAP=0.44)and cascade R‐CNN(mAP=0.55).
KEYWORDS attention mechanism,cascade R‐CNN,fracture detection,X‐ray image
1|INTRODUCTION
Bones protect many important organs,such as the brain,heart,lung,and other internal organs.As an important part of the human body,bone health impacts people's quality of life[1].According to statistics,more than 1.7 billion people worldwide suffer from musculoskeletal diseases,including fragility fractures,traumatic fractures etc.[2].A fracture usually brings sharp pain and swelling to the injured part and causes partial loss of function when severe.If it is not treated in time,it may cause a series of complications such as acute bone atrophy or joint stiffness.The common fracture types are shown in Figure 1,including(a)transverse fracture,(b)open fracture,(c)simple fracture,(d)spiral fracture,and(e)comminuted fracture.These images are taken from the Internet.
The development of radiation technology has greatly improved the diagnosis and treatment of many diseases[3].X‐ray and CT scan are the fastest and simplest methods to diagnose bone diseases[4–6].Compared with CT scanning,X‐ray has the advantages of lower cost,lower radiation dose,and less harmful to the human body.Hence,it is still the most commonly used diagnostic tool in orthopaedics.In the emergency and routine health examination,clinicians evaluate whether a patient has a fracture is mainly based on an X‐ray image.Doctors can diagnose whether a patient has a fracture and find the location of the fracture by observing the X‐ray image.In the emergency department,usually,professional orthopaedics doctors are not enough.Even experienced doctors may be tired due to excessive work,resulting in an increased probability of misdiagnosis and an increased risk of improper patient care[7–9].In the emergency department,the misdiagnosis of fracture accounts for 41%–80% of the diagnostic error reports[10],so there is an urgent need for auxiliary diagnostic technology in the field of radiology.

FIGURE 1 Examples of different types of bone fractures.(a)Transverse fracture,(b)open fracture,(c)simple fracture,(d)spiral fracture and(e)comminuted fracture.These images are taken from the Internet
Computer‐aided diagnosis(CAD)technology in the radiological department has the advantages such as low cost,high efficiency,and time‐saving.In recent years,CAD based on the deep learning methods has been used in many medical fields and has made significant breakthroughs.Convolutional neural network(CNN)has been successfully applied in skin cancer classification[11],brain tumour segmentation[12],lung nodule detection[13],and brain image analysis[14].The deep learning method plays a vital role in the field of radiology.With the application of deep learning in medical image processing,the research of exploring deep learning in solving the problem of fracture detection and diagnosis appeals to many scholars.
The biggest challenges in sternum fracture detection are as follows:(1)It is hard to find an open dataset of chest X‐rays with annotated sternal fractures.The collection of sternal fracture data is also difficult,and the data collected from the hospital have no fracture label.Annotation of fracture areas is complex and tedious.(2)The scale of the chest X‐ray is large,and the structure is complex.The size of the fracture area varies differently,and occult fractures are common,making the detection much more difficult.To address the above problems,we proposed an attention‐based cascade R‐CNN model[15]for sternum fracture detection.The overall architecture of our model,along with three networks[feature extraction network,feature pyramid network(FPN),and(region proposal network)RPN],is shown in Figure 2.Also,this work contributes the following:
(1)Established an X‐ray‐based sternum fracture dataset of 1227 images with labelled sternum fractures.
(2)Proposed a cascade CNN model for sternum fracture detection on X‐ray images.
(3)Investigated the efficiency of using attention mechanism and atrous convolution for sternum fracture detection.
As shown in the experimental results,the improved cascade convolution network with atrous convolution and attention mechanism effectively improves the detection accuracy of the small targets.The paper is organised as follows:in Section 2,we present the pre‐processing of the X‐ray image of the bone.Section 3 presents bone fracture detection based on cascade R‐CNN and attention mechanism.Section 4 presents the comprehensive evaluation of the fracture detection model.Section 5 summarises our work and identifies potential areas for future research(Figure 2).
2|RELATED WORKS
Many early studies have proved the feasibility of using CNN in fracture detection.The studies can be divided into two types:image classification(to predict if there is a fracture in one X‐ray image)and target detection(locate the fracture in the image).
Most of the research is about image classification,which just gives a prediction of whether if there is a fracture.Kim et al.[16]retrained the Inception‐V3 model with lateral wrist images to detect bone fracture,and they reached an AUC of 0.954.However,they were just classifying the image with and without a fracture,and the task did not refer to fracture detection and localisation.Raghavaendra et al.[17]developed a CNN classification model trained with 1120 reconstructed sagittal images of CT scans to detect thoracolumbar fractures.A clear vertebra image in a sagittal view was taken as the reference image,and three images before and after the reference image were considered to constitute seven images from each subject.This manual image sorting operation reduced the search range.It was a classification model determining whether there was a fracture,and the location of the fracture was not considered.Olczak et al.[18]used CaffeNet,VGG,and network‐in‐network to classify X‐ray images with and without fractures with 256,000 samples.The accuracy for classification was estimated at 83% for the best‐performing network.Tomita et al.[19]combined deep residual network(ResNet)and LSTM to detect osteoporotic vertebral fractures on CT scans automatically.They trained and evaluated their system on 1432 CT scans and achieved an accuracy of 89.2%.However,they just considered a single label for an entire volume of CT scans.The resulting model was susceptible to learning possible confounding factors in such a classification setting,which may result in diagnostic inaccuracy.
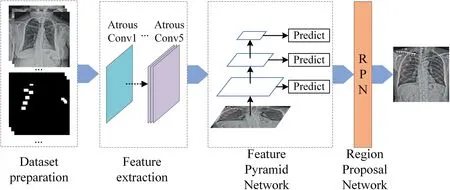
FIGURE 2 Flowchart of the proposed attention‐based cascade R‐CNN model for sternum fracture detection.Atrous convolution and attention block were used in feature extraction
These classification models mentioned above can diagnose whether there is a fracture in the X‐ray image.However,it cannot mark the location of a fracture by predicting the bounding box.The target detection task is much more challenging than just diagnosing whether there are bone fractures.It involves two main tasks:distinguishing the foreground from the background and assigning appropriate class labels and addressing the issue of localisation.To realise the fracture detection,Pranata et al.[20]combined ResNet50 with an accelerated robust feature(SUFR)algorithm to prove the feasibility of computer‐aided classification and detection of calcaneal fracture location in CT images.Robert et al.[21]developed a deep neural network(DCNN)to detect and localise wrist fractures in radiographs.They used the visualised probability of the feature map that was overlaid on the radiograph to indicate the fracture.Trained with 135,409 annotated radiographs,the model operated at 93.9% sensitivity and 94.5% specificity using a decision threshold set on the model development dataset.Gan et al.[22]used Faster R‐CNN and Inception‐v4 to detect distal radius fractures,and the experiments show that the ability of the proposed network is equivalent to orthopaedics doctors with IOU=0.87.At the same time,this model is designed to detect a single object in an image.It is much easier than multi‐object detection.Guan et al.[3]developed a dilated convolutional feature pyramid network(DCFPN)to detect thigh fractures,and they got an AP of 82.1%.However,compared with a sternum fracture,the number of thigh fractures is much smaller,and it is easier than sternum fracture detection.
Rajpurkar et al.[23]used 40,895 X‐ray images of musculoskeletal in the MURA dataset to train a 169‐layer CNN model to make the binary prediction of abnormal if the probability of abnormality for the case is greater than 0.5.Cohen's kappa statistics for elbow,finger,forearm,hand,humerus,shoulder,and wrist are 0.71,0.38,0.737,0.851,0.6,0.72,and 0.931,respectively.It indicates that for different bones,the difficulty of fracture detection varies greatly.Some examples of bone fractures at the different parts of the human body are shown in Figure 3.
The above research reflects the feasibility of deep learning in fracture detection.At present,the study of deep learning methods in the detection of arm,leg,and wrist fractures forms the majority,but the research on sternum fractures is not too much.The emergency department has a great demand for examining sternum fractures caused by traffic accidents and fights because the number and location of fractures have a great relationship with conviction and compensation.
3|DATASET AND PRE‐PROCESSING
Many of the X‐ray images have poor expressiveness of the tissue structure due to the equipment or human factors and often bring blurring,distortion,or artefacts,which affect the judgement of the target.Moreover,because of the complex structure of the human body,the variation of size,appearance,and position,images in different environments are different.Many different tissues of the human body look very similar,and the difference between the target and other parts is not obvious.Therefore,we used some pre‐process operations to enhance the original X‐ray images,and then,the images were input into the deep learning model for fracture detection.
3.1|Establishment of the training dataset
In deep learning model training,data is the foundation,and the medical data is mainly from public datasets or hospitals.Until now,there are no large‐scale public annotated datasets of sternal X‐ray images with fractures,and in fracture detection,all the fractures at different positions need to be annotated,which is a labour‐intensive work.Steps for constructing the dataset are as follows:(1)Data collection,collection of sternal radiographs and diagnostic reports from hospitals;(2)Data desensitisation.The original data from the hospital has privacy information such as the patient's name and residential address;firstly,we removed the privacy information.(3)Data annotation.Two professional radiologists annotated the fractures with labelImg software based on the sternal X‐ray images and the diagnosis report.(4)Data recheck.Experts reviewed the annotated radiographs,and finally,we got a dataset with 1227 annotated chest radiographs.(5)The dataset was split into training,validation,and testing sets in a ratio of 7:1:2.The original data is shown in Figure 3;there are inconsistencies in image resolution.The annotations were saved in a Pascal VOC format.The annotation information such as width,height,and depth of the subregions was saved in an XML file.Some of the annotated samples are shown in Figure 3.

FIGURE 3 Fracture of different places.(a)Forearm,(b)tibial,(c)metacarpal,(d)chest.Images in(a)–(c)are taken from the Internet.Image in(d)is from our dataset

FIGURE 4 Example of fracture annotations of our dataset
The annotated X‐ray images were converted into binary images as masks corresponding to the original images,as shown in Figure 4.
There are 1227 annotated sternal radiographs,859 in the training set,122 in the validation set,and 246 in the testing set.Each image contains at least one fracture area,and most of the radiographs have multiple fracture areas(Figure 5).
3.2|Pre‐processing of the X‐ray images
When taking an X‐ray image,there are significant differences in brightness,contrast,resolution,and size,which will have a significant impact on the performance of the model.Therefore,pre‐processing of the images,including data cleaning,image normalisation,and data augmentation,were used in our experiment.We removed data with incomplete information,repeated images,and data does not meet the needs of this experiment.
3.2.1|X‐ray image normalisation
Figure 6 shows an information map of the resolution of the dataset.The maximum size of the pictures in the dataset was 3712×4565,the minimum was 465×512,and the gap between the maximum and minimum resolution of the pictures was too large.The distribution of the fracture size in the sternal X‐ray was analysed,and Figure 6a,b presents the distribution of the fracture size.Figure 6c shows the density of the area of the fracture,and we can see that the area of most fractures is in the range of[50,300].
Sizes of the fractures in the original data are mainly concentrated at 200×200.However,a small portion of the fractures with sizes at 550×360 and the scales of the fracture target regions are different.The majority of the length and width of the images were centred between 2000 and 3000.In the target detection network,when the image size of the input network is larger,the more information is obtained,the better the result of detection will be,but at the same time,the network parameters become large,resulting in a large computation cost.Considering the limited computing resource and the small area of the fracture in the original image,the size of the bounding box is measured with the positional information of the target box in an XML file,followed by the cropping of the picture.
3.2.2|Cropping
As shown in Figure 7,the first row is the original images,the second row is the images after the cropping,the cropped picture contains the fractures,and we removed most of the background.
The grayscale of the original images in the dataset is large,appearing as a part of the images is brighter,and the other part is darker;the background of some images is close to grey,and some get a black background.To improve the quality of images,normalisation was performed with histogram equalisation.The bone area after histogram equalisation was clearer compared to the original picture.We also used data augmentation to generate equivalent data on the basis of the original dataset to increase the number and diversity of training samples and to improve the model's generalisation ability.Considering the low resolution of medical images,random cropping is used for data augmentation.Different from scaling,where images in the training set were randomly cropped to a specified size of image 1536×1536,and the training set was increased to 3000,all of the fractures were kept.The validation dataset includes 245(1227×0.2)images,and the test dataset includes 123(1227×0.1)images.
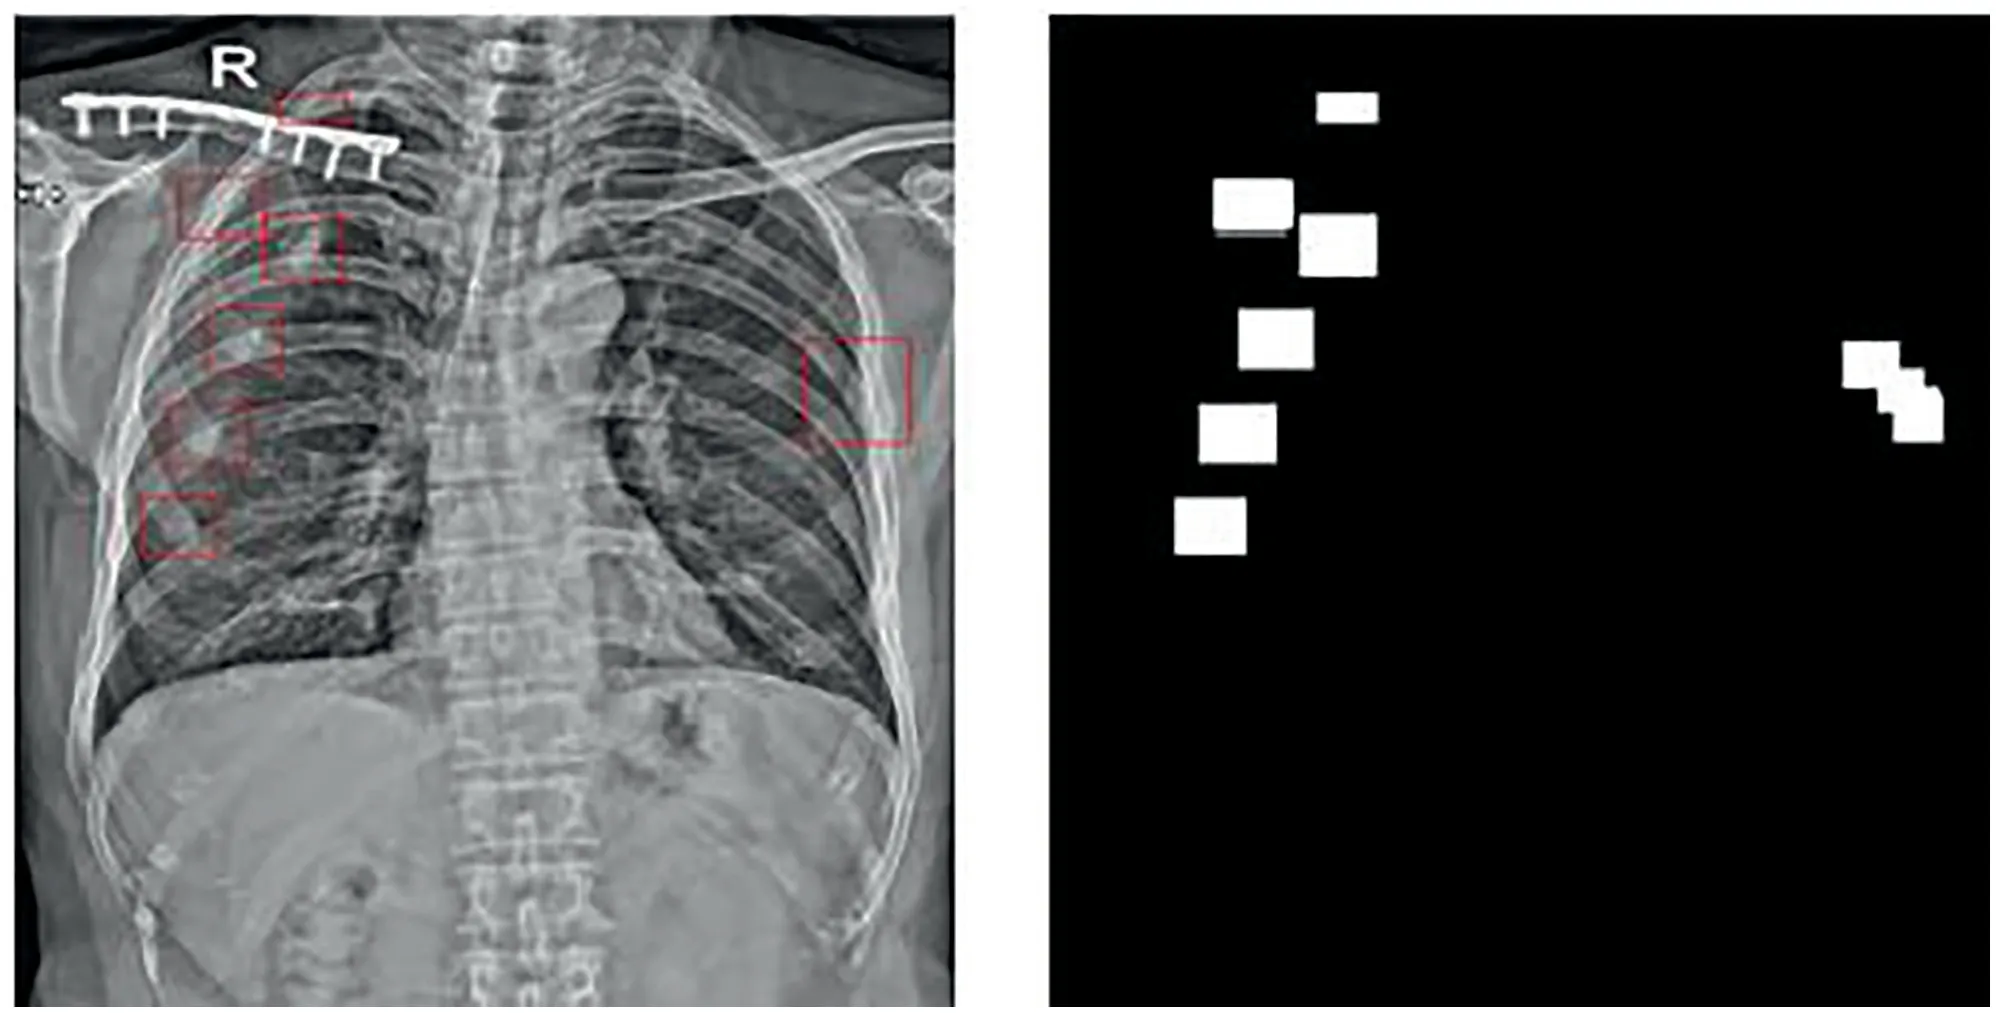
FIGURE 5 Original sternal X‐ray image and the labelled mask.If there are several overlap labels,the largest rectangle box is used as the bounding box on the X‐ray image,as shown on the right side of the images
4|FRACTURE DETECTION BASED ON CASCADE CNN AND ATTENTION MECHANISMS
4.1|A cascade CNN‐based model for fracture detection
We used this cascade R‐CNN[15]as the base model for fracture detection.Our network consists of a feature extraction network of ResNet and FPN,region detection network of RPN and cascade detector,as shown in Figure 8.After extracting the features from the ResNet network,the feature maps of different layers are fused and fed into RPN to get candidate bounding boxes.In cascade detectors,FC is the fully connected layer,C is the probability of classification,B is the regression of candidate boxes.During the detection stage,the previous candidate box regression B is utilised to sample the object region to be detected repeatedly.With the unchanged data quantity,by improving the IOU's threshold,we can train a better detector and lift the training result of the network.
The pseudocode of the sternum fracture detection algorithm proposed in this paper is shown in Table 1.
4.2|Improved cascade R‐CNN with attention mechanism

FIGURE 6 Sizes of the X‐ray image and fractures.(a)Distribution of the size of original X‐ray images.(b)Distribution of the aspect ratio of the fractures.(c)Distribution of the area of the fractures
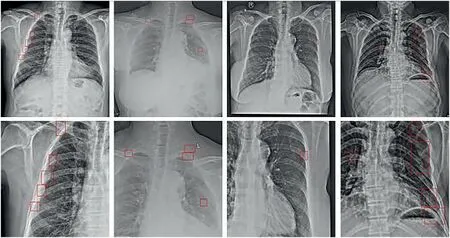
FIGURE 7 X‐ray images after cropping.The first row is the original images,and the second row is the images after the cropping
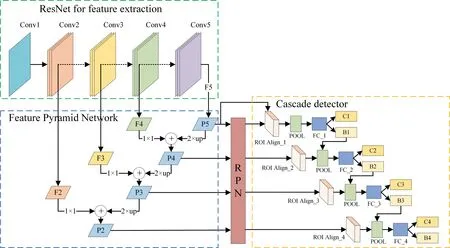
FIGURE 8 Network structure of the proposed cascade R‐CNN for fracture detection
Pixels on a feature map output by one layer in the CNN are mapped at a size called the receptive field in the original.Moreover,a pooling layer is used in a full convolution network to increase the receptive field,resulting in a downsizing image before going through the up‐sampling,but this operation reduces the resolution.We used atrous convolution to solve this problem,as shown in Figure 10.Compared with standard convolution,the size of the convolution kernel of the atrous convolution is consistent with standard convolution,but the atrous convolution sets up the expansion rate based on the standard convolution.The computation cost does not change,and the receptive field is enlarged,and more contextual information is acquired.The attentional mechanism is a process in which a set of weight coefficients is learnt autonomously by the network and is‘dynamically weighted’to emphasise regions of interest and suppress the background.Similar to the human attention mechanism,it will make the model focus on significant information,select useful information,and ignore the other information.We used channel attention in this work[24],and the model diagram of channel attention is shown in Figure 10.Channel attention uses MaxPool and AvgPool to compress the input feature map.It then obtains the corresponding spatial background descriptionandand then uses the shared network composed of MLP to calculate the channel attention Map as shown in Equation(1):

Because the sigmoid function is used as the activation function in the calculation of channel attention,the feature value is in[0,1],and some useful information after compression may be lost,so it is expanded to twice whenusing channel attention.Because the size of fractures varies greatly,and Figure 9 shows the target area of fracture of different scales in X‐ray images,it is necessary to set the anchor of different sizes to adapt to the fractures of different sizes.
In general,if the large convolution kernel is used for feature extraction,the details of the small‐scale target will be lost due to the large receptive field;if the small convolution kernel is used,the information of the large target will be lost because the receptive field is too small to extract high‐level semantic information.The detection performance of small‐scale targets needs to be improved by using the context.Therefore,to make the fracture detection network not only keep the details of the image but also have an appropriate receptive field,we take advantage of atrous convolution and attention mechanism to design the attention module in the feature extraction network ResNet of cascade R‐CNN.The schematic diagram of the model is shown in Figure 10.
In the network shown in Figure 10,two convolutions of different receptive fields and an atrous convolution are paralleled to process the input feature map.Then,the output feature map is concatenated,and the feature map is sent to the channel attention module to select the features of interest.Due to the small amount of data,to avoid overfitting of the model,1×1 convolution is added after the channel attention module for dimension reduction.The feature extraction network ResNet consists of five stages of convolution.We use the attention module to replace some convolution layers in ResNet to improve the model's performance.
5|EXPERIMENT
5.1|Metrics
In this study,for the detection model of fractures,three evaluation metrics were used:precision,recall,and mAP.In target detection,IOU is an indispensable function for calculating mAP,which is all called intersection ratio,and the calculation formula is shown in Equation(2):

IOU is the ratio of the intersection and union of predicted boxes and true boxes.A value of IOU greater than 0.5 in the evaluation algorithm for fracture detection is considered a correct predicted location of the fracture.Less than 0.5 is regarded as a prediction error when the area was not the fracture area[15].Precision was calculated as Equation(3),where TP denotes the number of fracture samples and the model classifies them as a fracture;FP is the number of samples that are not fractures but are classified as fractures by the classifier.FN is the number of samples that are fractures but are classified as non‐fractures.Precision represents the proportion of the number of correctly predicted fractures over the total number of predicted fractures,as shown in Equation(3):

The calculation of recall is shown in Equation(4):

The recall is the ratio of correctly predicted fractures and the proportion of fractures in the test set.The mAP is the mean value of the average precisions(APs).Because there is just one class of fracture in the detection task,the AP value is equal to the mAP value.
We also usedF‐measure,defined as the harmonic mean of the model's precision and recall,to evaluate the performance.Here,F1 score is used.As shown in Equation(5),

5.2|Results of fracture detection based on cascade R‐CNN and attention
The environment of this study is as follows:the operating system is Ubuntu 14.04,the CPU is Intel i7‐5820k,the GPU is NVIDIA GTX 1080,we use Python and MATLAB,and the deep learning framework is Keras and Pytorch.
In this experiment,we input a chest X‐ray image into the model.If there is a fracture,the fracture location is returned.It mainly includes using CNN to extract features,generating bounding boxes in the feature map,and classifying them.In deep learning network training,the image size has a significant impact on the final performance of the model.When inputting a larger size image,more information can be captured,but the cost of computing increases,which increases the pressure of GPU.We analysed the size of the input image.X‐ray images with different input sizes 2087×2757(original images),1696×1696,1536×1536,1024×1024,and 416×416 were tested,and the samples are shown in Figure 11.The best performance is when the image size is 1536×1536,which is used in this study.When the size of the cropped image is smaller than 1536×1536,the part of the fracture area will be lost,as shown in Figure 11d,e;because the original image is too large when inputting the original image into the model,the batch size can only be set to 1 in our computer,and the training speed is slow;when selecting the size of 1696×1696,the batch size can be adjusted to 1 or 2,and the performance is not as good as when the image is resized to 1536×1536.We think the reason may be that when the batch size is small,the batch normalisation module could not work well,and the AP is not good.When the size is 1536×1536,the batch size can be set to 4,and with these settings,we can get the best AP values.As shown in Figure 11c,most of the other lesions outside of the sternum are removed,which is a way to decrease the computation cost and exclude some of the inference.
The backbone network is ResNet,and the batch size is 2.The optimiser is Adam,and the learning rate is 0.001.After iterating 50 times,the network model converged completely.The graph of network training is in Figure 12.
From Figure 12a,it can be seen that after 45 iterations on the improved cascade R‐CNN network,the loss value is stable at around 0.12,and the model reaches the optimal state.The PR curve of the cascade R‐CNN network and the improved cascade R‐CNN network are shown in Figure 12b.The larger area under the PR curve indicates the higher mAP value,and it can be seen from Figure 12b that the mAP value of the improved cascade R‐CNN network with atrous convolution and attention mechanism is greater than that of the cascade R‐CNN network.There are 246 images in the testing set.
In Figure 13,red rectangles indicate the position of fracture detected by the model;yellow rectangles indicate the position of missed fracture,and the green ellipse circles show the false detected fracture.Figure 13A,a,b,e,f shows that the cascade R‐CNN missed lots of the features,and the context information is not fully utilised,so the detection of small targets is not very well.The precision,recall,and mAP values detected by the two networks are shown in Table 2.The cascade R‐CNN network can obtain a precision of 0.82,a recall of 0.77,and an mAP of 0.55.
Under the same condition,the improved cascade R‐CNN can detect small targets well but false detected fractures still exist,as shown in Figure 13C,c,d,f.Compared to the original cascade R‐CNN,the improved cascade R‐CNN network with attention block can work better.The improved cascade R‐CNN model has improved the detection performance of the small fractures.
It can be seen from Figure 13C that after adding atrous convolution and attention module,the effect of fracture detection results of the improved cascade convolution network has been significantly improved compared with the other two networks.If the fracture is too small or there are many overlapped fracture annotations in a small area,it is easy to miss the fracture during detection.

FIGURE 1 1 Sizes of input images in different scales,from left to right,the sizes of the images are:(a)2087×2757(original images),(b)1696×1696,(c)1536×1536,(d)1024×1024,and(e)416×416

FIGURE 1 2 Loss curve and PR curve of the fracture detection.(a)Loss curve of the model based on cascade R‐CNN,(b)PR curve of the model based on cascade R‐CNN and attention mechanism
5.3|Comparison result
We also test fracture detection based on YO LOv5[25].YOLOv5 includes YOLO5s,YOLO5m,YOLO5l,and YOLO5x,four different models.We used YOLO5s in this experiment.The neck structure in YOLOv5 uses FPN+PAN.To improve the ability of network feature fusion,the(Cross Stage Partial Network)CSP structure is added[26].This structure respects the variability of the gradients by integrating feature maps from the beginning and the end of a network stage,which reduces computations while keeping the performance.YOLOv5 uses Leaky ReLU as the activation function in the hidden layer and the sigmoid activation function in the final detection layer.In the post‐processing of fracture detection,GIOU_Loss is used in NMS to filter the target.
YOLOv5 learns based on anchors.In the COCO dataset,the size of the anchors is fixed.For different datasets,it is necessary to scale the size of the original image in general,and the target size in different datasets is different from the size in COCO datasets.In order to save network training time and improve the accuracy of network detection,the YOLOv5 network will automatically learn to analyse the datasets and calculate the anchor frame size in different training sets.We used CSP darknet53 as the backbone,the batch size is 4,the optimiser is SGD,the learning rate is set to 0.0001,and the epoch is 300.After 150 iterations on the training dataset,the loss value is about 0.22,and the model reaches its optimal state.The precision is 0.73,recall is 0.66,and mAP is 0.44.
As shown in Figure 13b,c,we can see that the fracture area is large,and the edge of the bones is not clear.In the rest of the figure,there are missed and falsely detected fractures.It can be seen from the picture that the area of the missed fracture is small and there are overlapped fractures in the two‐dimensional X‐ray image,so the situation of missing detection is more serious,and the false detection is because the difference between the fracture features and other tissues in the X‐ray images is not obvious.The fracture detection model based on YOLO has a beneficial effect on detecting larger fracture areas in X‐ray images.However,it is easy to miss the fractures whose morphological features are not obvious,and it tends to miss the smaller fracture areas.Aiming at the problem that the detection performance of the YOLOv5 on small objects is not good enough,we use atrous convolution and attention mechanism to solve the problem.The experimental results in Figure 13b,c show that the detection result of the improved cascade convolution network model with attention mechanism in the fracture is better than that of the YOLOv5 network and cascade convolution network.
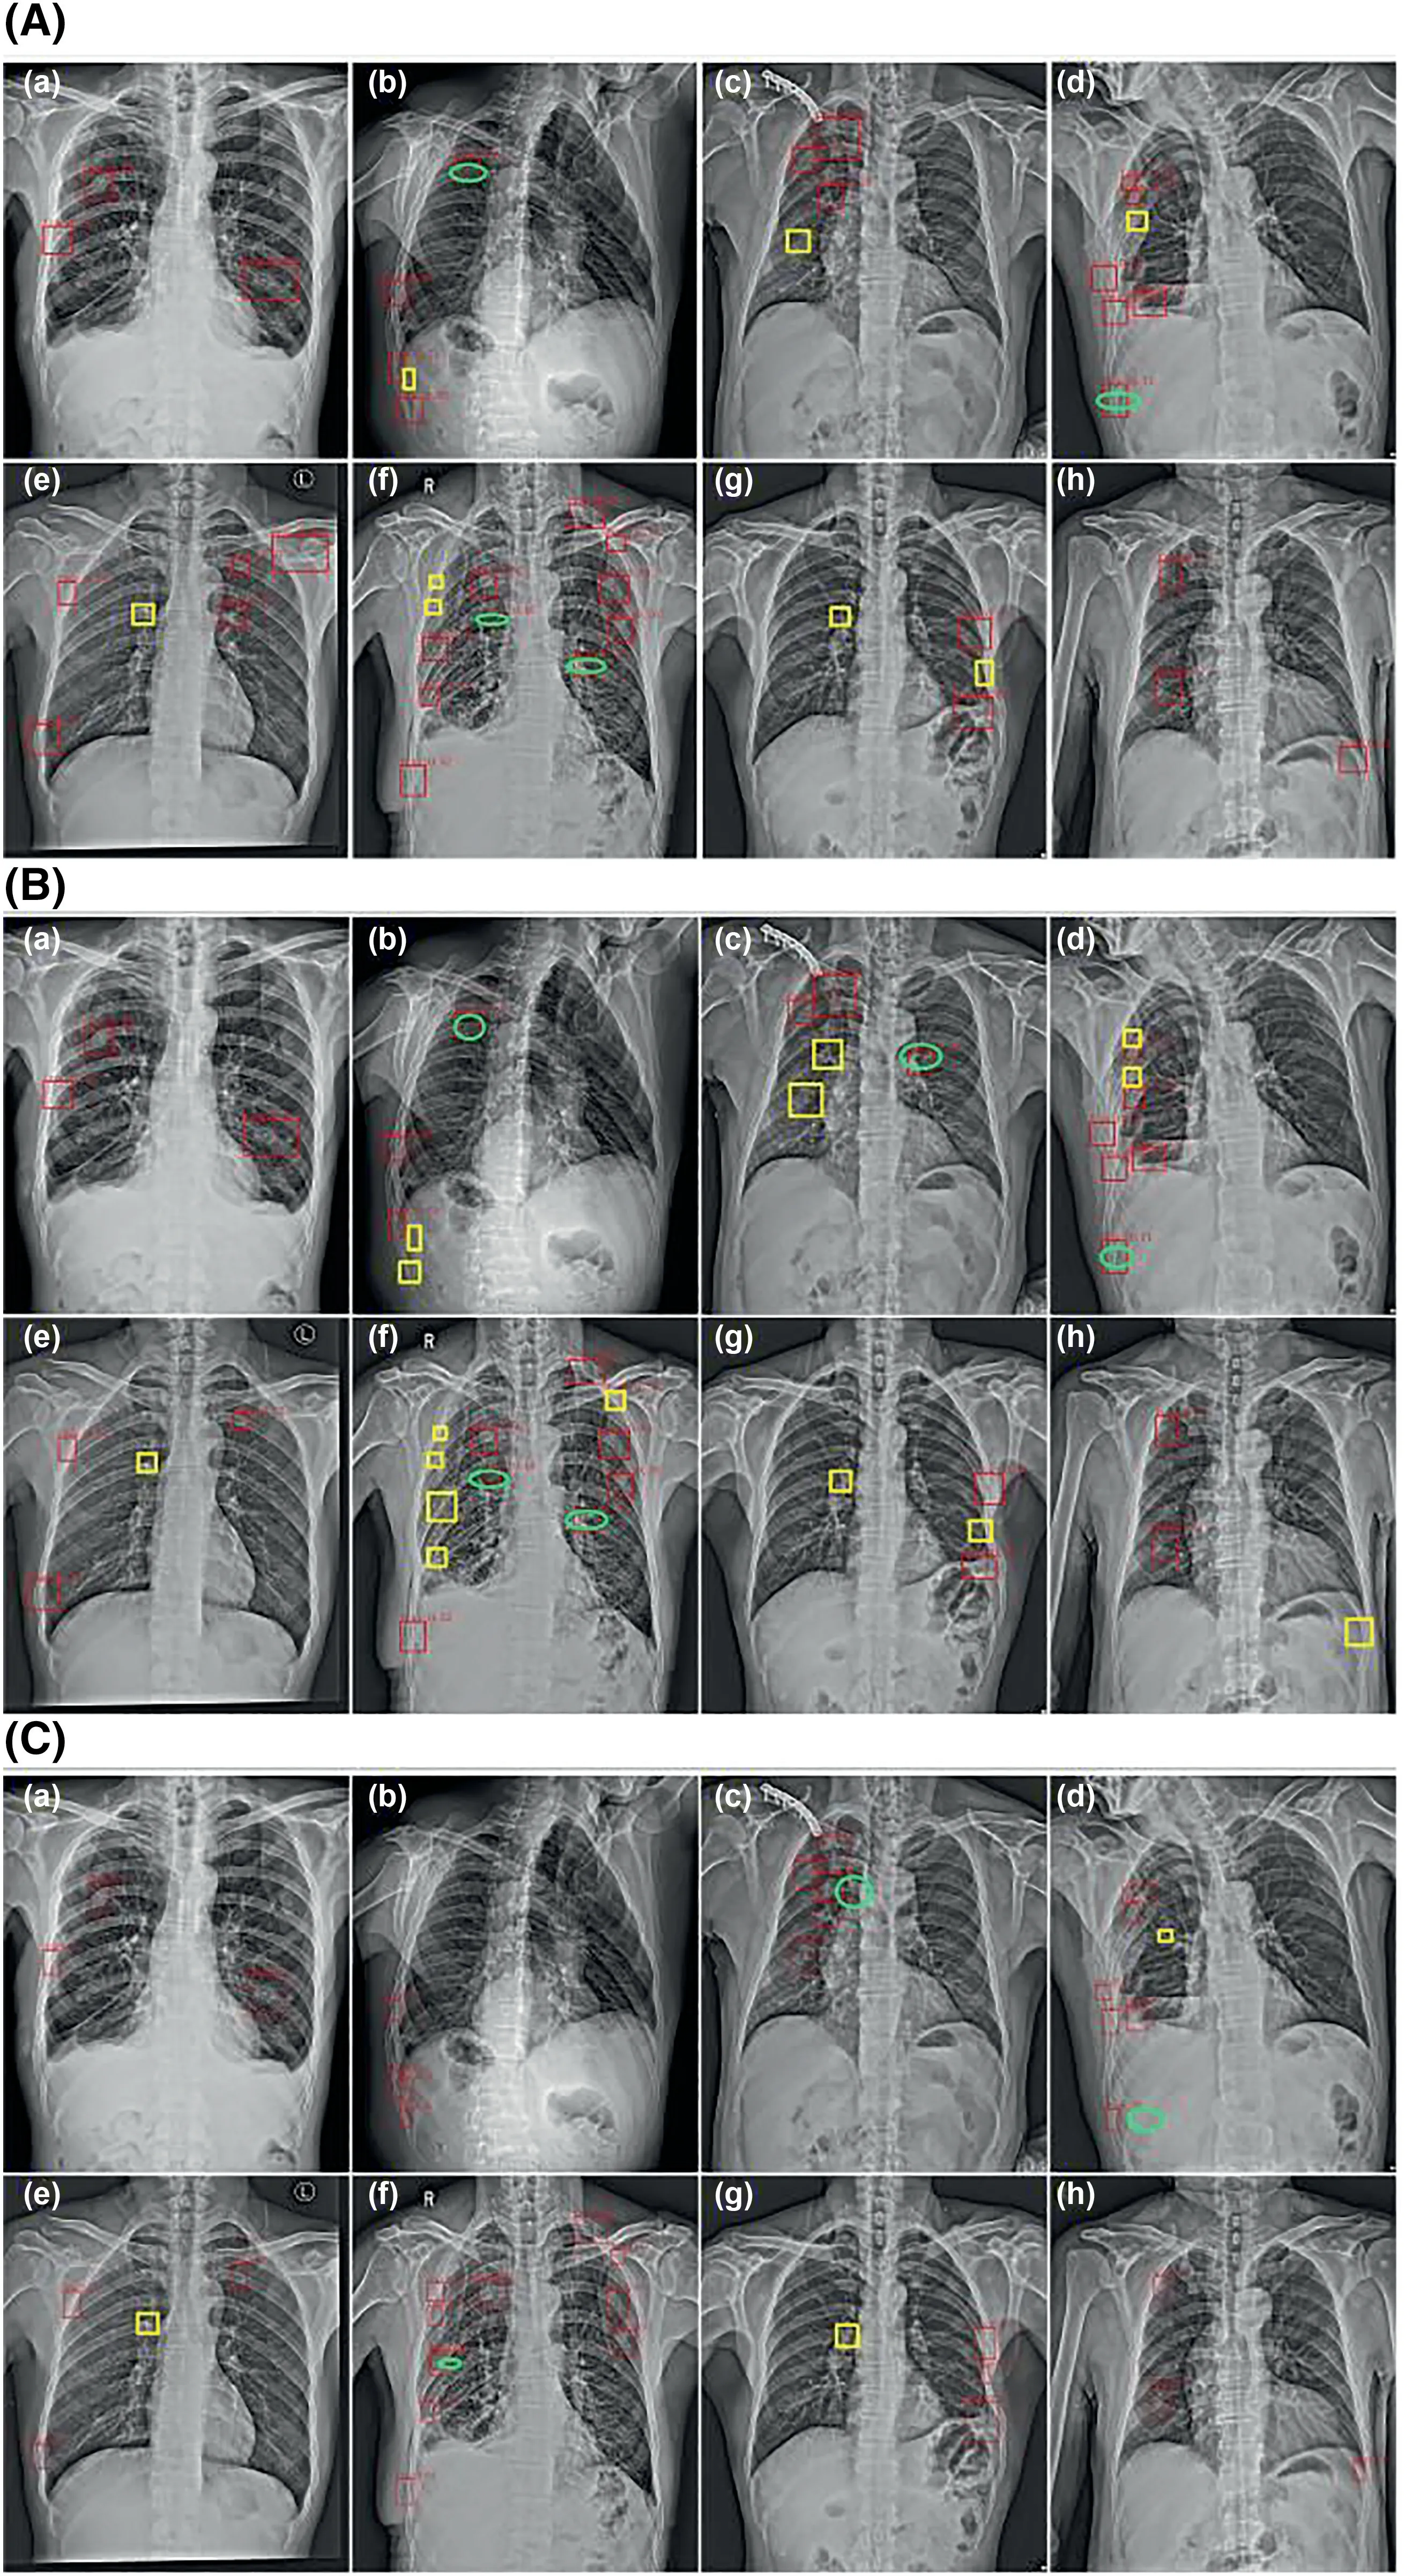
FIGURE 1 3 Comparison of fracture detection with cascade R‐CNN,YOLOv5 and improved cascade R‐CNN.(A)Fracture detection result with cascade R‐CNN,(B)fracture detection result with YOLOv5,(C)fracture detection result with improved cascade R‐CNN
We also tried FoveaBox[27],Grid RCNN[28],Libra RCNN[29,30]and Faster RCNN[31]for sternum fracture detection.The backbone of the models is the same as the cascade R‐CNN,which is ResNet.The ratio of training,validating,and testing dataset for the parallel experiments are the same and the epoch is 50.However,for FoveaBox[27],Grid RCNN[28],and Libra RCNN[29,30],the mAP is lower than 0.01 and it is almost impossible to get the sternum fracture from the X‐ray images with these models,which means that maybe these detection models are not appropriate for sternum fracture detection,and the metrics are not comparable with the methods such as YOLOv5[25],cascade R‐CNN[15]andImproved cascade R‐CNN in Table 2.Therefore,the result was not included in Table 2.

TABLE 2 The results of state‐of‐the‐art detection models for sternum fracture detection
The last two columns in Table 2 show us the computational complexity of the models with the model size and the inference time.YOLOv5 has the best spatial and time complexity.For the improved cascade R‐CNN,we can get 7.6 fps to detect one image,which is also quite fast for object detection.This detection task is not required to be real‐time work,and the inference time is enough for us.
ResNeXt[32](ResNet[33]+Inception[34]),ResNet‐101,and ResNet‐50 are used as the backbones of the three detection networks,and we compared the result of the model with different settings,as shown in Table 3.We found that with ResNet‐101 and ResNet‐50,it is hard to get satisfied detection results in the experiments.The ResNeXt shows the best performance for this task.
6|DISCUSSION
The main aim of the study was to detect the sternum fracture in X‐ray images automatically with a computer.Although the study provides a model that can arrive at an mAP of 0.71,there were certain limitations while exploring the aim of the study.It is expected that these points will help future researchers avoid facing the same shortcomings.
While conducting the study,all the data is from the same institution,and it is easier to train a model with the data from one centre with the same machines.However,to put the model into application in the future,the multi‐centre dataset is necessary.With mixed data from multi‐institutions,the distribution of the data may vary greatly,and we must consider the inconsistency of the data and design a more robust model to handle this.In addition,we will collect more X‐ray images for model training.
As far as we know,there is no public sternum fracture dataset,and we have not found a paper about the fracture detection in the chest.The fractures in different parts of the body have their own characteristics,and the degrees of difficulty are also very different[23].Therefore,it is hard to compare the result with other research works.This may have led to the limitation of the evaluation of the findings.As it may,we tried different models,such as Faster RCNN[31],YOLOv5[25],FoveaBox[27],Libra RCNN[29,30]etc.,to estimate the performance of the proposed model.Although the experiment result shows us that many the‐state‐of‐the‐art models are not appropriate for this task,at least we know which model works.On the other hand,it shows us that sternum fracture detection is still a very challenging task.We hope there will be more research works about the sternum fracture in the future,and then,we can compare the results more impartially.
Although the mAP of 0.71 is already better than using other models and similar to some fracture detection works[23],it is not enough for disease diagnosis.It can be used as an auxiliary diagnosis method in medical examination at this stage.It is sure that with more annotated data and developed target detection methods,we can get better performance of sternum fracture detection.
7|CONCLUSION
Fracture is one of the most common injuries in our life.If it is not treated in time,it may cause muscle atrophy,traumatic arthritis,nerve injury,and other complications.Therefore,early and timely diagnosis of fracture is important.In recent years,most of the research works on fracture detection focussed on the wrist and thigh.Due to the complex structure of the sternum,there are a few research works on fracture detection on sternum X‐ray images.At present,the fractures in X‐ray images are mainly detected by radiologists.Due to subjective factors such as doctors'professional level and experience,the fracture diagnosis is not timely,and some occult fractures are missed.Therefore,it is necessary to study the method based on deep learning for the automatic detection of the sternal fracture.In this study,1227 sternum X‐ray images were taken as the research object,and a fracture detection model was built,which achieved good results in fracture detection.A convolution neural network based on the cascade R‐CNN is used.Aiming at the large‐scale variation of fracture sizes and the difficulty of small fracture detection,the convolution neural network based on cascade is improved by using the advantages of attention mechanism and atrous convolution,so as to improve the fracture detection effect of the network in sternum X‐ray images.The fracture detection method proposed in this paper can aid doctors in diagnosing sternal fractures,and the efficiency has been preliminarily approved by doctors.However,there are still some limitations that need to be improved.In future,we will focus on the following aspects:

TABLE 3 The state‐of‐the‐art detectors with different backbones
(1)Add more data to our dataset.A sternal X‐ray dataset with 1227 images is small for the deep learning network model.Although the data enhancement method is used in the training process,due to the small amount of original data,the number of valuable images is limited.In future,we will continue to cooperate with hospitals to collect more data to improve the accuracy of the model by increasing the number of samples.In addition,we will try to build a public dataset to help to improve the techniques on computer‐aided fracture detection.
(2)Based on this study,the improved cascade convolution network with atrous convolution and attention mechanism effectively improves the detection accuracy of the small targets.We will try other strategies for fine‐grained object detection to improve the effectiveness of small fracture detection.
ACKNOWLEDGEMENT
This research is supported by Science and Technology Plan Project of Xi'an(GXYD17.12),Key Research and Development Program of Shaanxi Province(2019GY‐021),Open fund of Shaanxi Key Laboratory of Network Data Intelligent Processing[XUPT‐KLND(201802,201803)].
CONFLICT OF INTEREST
There is no conflict of interest.
ETHICAL APPROVAL
This research was approved by the Xi'an Honghui Hospital Research Ethics Committee.
DATA AVAILABILITY STATEMENT
The data that support the findings of this study are available from the corresponding author upon reasonable request.
ORCID
Yang Jiahttps://orcid.org/0000-0001-8964-6702
 CAAI Transactions on Intelligence Technology2022年4期
- CAAI Transactions on Intelligence Technology的其它文章
- Modelling of a shape memory alloy actuator for feedforward hysteresis compensator considering load fluctuation
- Apple grading method based on neural network with ordered partitions and evidential ensemble learning
- An improved bearing fault detection strategy based on artificial bee colony algorithm
- Parameter optimization of control system design for uncertain wireless power transfer systems using modified genetic algorithm
- Passive robust control for uncertain Hamiltonian systems by using operator theory
- Humanoid control of lower limb exoskeleton robot based on human gait data with sliding mode neural network
