A simple derivative spectrophotometric method for simultaneously detecting nitrate and nitrite in plasma treated water
Liangsheng XU (許良勝),Huihong WU (吳匯鴻),Xin WANG (王新),Qiang CHEN (陳強) and Kostya (Ken) OSTRIKOV
1 Shenzhen Research Institute of Xiamen University,Institute of Electromagnetics and Acoustics,Fujian Provincial Key Laboratory of Plasma and Magnetic Resonance,Key Laboratory of Electromagnetic Wave Science and Detection Technology,Xiamen University,Xiamen 361005,People’s Republic of China
2 School of Chemistry and Physics and QUT Centre for Materials Science,Queensland University of Technology (QUT),Brisbane QLD 4000,Australia
Abstract A spectrophotometric technique is developed to simultaneously quantify nitrate and nitrite in plasma treated water.The measurement is based on examining the inflection points(wavelengths) in the derivative absorbance of the nitrate or nitrite solution.At the inflection points of the pure nitrate solution,the derivative absorbance is zero and independent of the nitrate’s concentration,and thus the nitrite’s concentration in a mixed nitrate and nitrite solution can be obtained by using the Beer’s law at these points.The nitrate’s concentration can also be achieved from the inflection points of nitrite in the same manner.The relation between the tested substance’s (nitrate or nitrite) concentration and the second- or the third-order absorbances is obtained at these inflection points.Test measurements for mixed aqueous solutions of nitrate and nitrite with or without hydrogen peroxide confirm the reliability of this technique.We applied this technique to quantify the nitrate and nitrite generated in air plasma treated aqueous solutions.The results indicate that both nitrate and nitrite concentrations increase with the plasma treatment time,and the nitrite species is found to be generated prior to the nitrate species in the air plasma treated aqueous solution.Moreover,the production rate of total nitrogen species is independent of the solutions’pH value.These results are relevant to diverse applications of plasma activated solutions in materials processing,biotechnology,medicine and other fields.
Keywords: nitrate,nitrite,derivative spectrophotometry,inflection point,plasma treated water
1.Introduction
Discharge plasma contains free electrons,photons,ions as well as radicals from which the plasma obtains high reactivity and finds various applications in diverse fields [1].When the discharge plasma is in contact with a liquid,a plasma-liquid interface is formed.Across this interface,the plasma and liquid componenets are transferred and exchanged via the multitude of physical and chemical processes,such as sputtering,evaporation,diffusion,and decomposition of the components [2–6].These physical and chemical processes at the plasma-liquid interface provide an exotic parameter space for many chemical and physical reactions which are difficult or even impossible to take place under conventional conditions.Therefore,the plasma-liquid interactions broaden the field of the discharge plasma research,enabling many applications,such as plasma-based water treatment[7–10],plasma medicine [11–13],elemental analysis [14–16],nanomaterial fabrication [2,17–21],nitrogen fixation [22–25],and several others.
For plasmas in contact with an aqueous solution,the reactive species generated from the plasma-liquid interactions can be classified as short-lived and long-lived components based on their lifetimes.The most common short-lived aqueous species are dissolved hydroxyl (OHdis) radicals and hydrated electrons which are responsible for the fast processes in the plasma-treated solution,such as rapid oxidation or reduction.The most common long-lived species are hydrogen peroxide (H2O2),nitrate(N O?3),and nitrite (N O?2) [19,23–26]which are related to the long-term chemistry of the plasma-treated solution.Therefore,it is important to trace and quantify these species in order to control the chemistry of the plasma-treated solution.
The short-lived species OHdisand hydrated electrons have often been investigated by the molecular probe method[26–33].A colorimetric method is usually used to quantify aqueous H2O2,using the reactions of Ti4++H2O2+2H2O→H2TiO4+4H+[34–38]or VO?3+4H++H2O2→V O32++3H2O [39–42],where the absorbance of H2TiO4at 410 nm or the VO32+cation at 450 nm is proportional to the H2O2concentration.Many techniques have been developed to quantify the NO?3and NO?2species,including spectrophotometric [43],fluorescent,chemiluminescent,and liquid chromatography [44,45]methods.At present,the spectrophotometric detection with Griess reagents [46]is the most commonly used method for the NO?3and NO?2detection.However,the above-mentioned techniques are either complicated in processing or demand toxic reagents,thus there is a requirement to develop a simple,fast and toxic reagent-free method for detecting the NO?3and NO?2species in the plasmatreated aqueous solutions.
It is known that many chemicals have specific absorption bands in their ultraviolet–visible (UV–vis)spectra,and thereby the UV–vis spectrometry is a powerful tool to trace and quantify chemical species [47].Recently,absorption spectrophotometry has been used to detect the NO?3and NO?2species in the plasma-treated aqueous solutions.Jun-Seok Oh et al [48–51]quantified the H2O2,NO?3and NO?2species in the plasma-liquid system by fitting the UV–vis spectra of the plasma-treated solution.He et al[52]developed a derivative absorption spectroscopic method to in situ quantify the H2O2,NO?3and NO?2species in an air plasma treated water,where a multivariable linear regression process is used to reduce the estimation error[53–55].In a similar manner to references [48–51],Liu et al [56]investigated the concentration and penetration depth of long-lived species by fitting the UV absorption spectra of the plasma-treated water,and they also considered the influence of the pH and cross reactivity on the studied UV absorption spectra.In this work,we substantially advance the derivative absorption spectroscopic method by taking advatange of the inflection points in the derivative spectra.This new approach does not rely on the commonly used laborious fitting of the absorption curves or multivariable linear regression processing.
When several chemical species are present in an aqueous solution,the absorbance at wavelength λ (Aλ) for multi-component solution with m components can be expressed by equation (1) according to the principle of additivity,if the absorbances of all the components obey the Beer’s law:

where Aλand l are the solution’s absorbance at wavelength λ and the optical path length of the sample,respectively.Aλ(i)is the absorbance contributed only by the ith component.εiλZ and Ciare the extinction coefficient at wavelength λ and the concentration for the ith component,respectively.This is the basis for the multi-component analysis using absorption spectrophotometry.
2.Experimental method
For a multi-component solution,the absorbance bands overlapping will decrease the discrimination among spectra of different components.Some baselines,scattering,or matrix interference are also possibly present in the absorption spectra.To solve these problems,derivative spectra are usually used,as a result,the selectivity of the assay will be improved.A substance’s absorbance (A) can be expressed in a general form as a function of the wavelength (equation (2)) [47]:

where anis the absorption coefficient of the substance at the wavelength λ.
Any interference with a directly proportional relationship to different orders of wavelength can be removed using higher orders of absorbance.Thus,derivative spectra can reduce or remove the background interference from many sources such as scattering,matrix etc.Moreover,it is known that the amplitude (Dn) of the nth-order absorbance is inversely proportional to the original bandwidth(W)raised to the nth order as expressed by equation (3) [47]

This fact will sharpen the band of the derivative absorbance,and consequently the discrimination among the spectra of different components is enhanced.
The derivative spectra can be obtained by performing the differentiation operation on equation (1)

Suzuki et al [57]have used the inflection points of second-order derivative spectrophotometry to estimate the concentrations of NO?3and NO?2.The principle is as follows.
If we consider the second-order derivative spectra,for aqueous solution of NO?3and NO?2,equation (4) turns to be equation (5),

Suzuki et al [57]found the wavelengths called inflection points in the second-order derivative spectra,and they are 215.8 nm for pure NO?3solution and 223.2 nm for pure NO?2solution.At the inflection points,the intensity of the secondorder derivative spectrum for NO?3or NO?2is zero and independent of the concentration of the NO?3or NO?2species.Therefore,at the inflection point of the N?O3in the second-order derivative spectraequation (5) turns to be

The NO?2concentration can be estimated from equation (6)can be obtained by measuring the secondat this inflection point (215.8 nm),provided that order derivative spectra for several known concentrations of the NO?2solutions.On the other hand,the NO?3concentration can also be obtained in a similar manner.However,the authors incorrectly referred to the inflection points as isosbestic points[57].In fact,the isosbestic point is a specific wavelength at which the absorbance of a sample is invariant during a chemical or a physical change of the sample [58].In this work,we develop a method that is applicable to the solutions containing H2O2 species and also consider the influence of the solution’s pH value.
If a solution contains the NO?3,NO?2and H2O2species,which is often the case for the plasma-treated water,the nth order of the derivatives for the solution absorbance at the wavelength λ will be

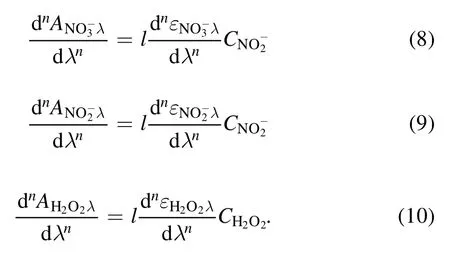
Provided that the inflection point in the derivative absorbance of the NO?3solution is λaequation (7) turns to be

Thus,we have

Thereby,can be obtained,ifCH2O2in the solution is measured.The value ofCNO?3can also be obtained in a similar way at the inflection points of the derivative absorbance for the NO?2solution.
Another issue required to be addressed is the pH influence on the band shape and position of the absorbance curve.In an aqueous solution,a chemical species HA is in an equilibrium state (equation (13)),the acid dissociation constant (pKa) is expressed as equation (14),

where[HA],[H+],and[A?]are the concentrations of HA,H+,and A?in the solution,respectively.
From equation (14),we can derive equation (15) for monoprotic acids that are able to produce one proton per molecule during the dissociation,

The H2O2,HNO3and HNO2are monoprotic acids,and thus we can find the ratio of the molecular state of HA in the solution as a function of the pH value,if we know pKa.Figure 1 presents the ratios of the molecular state for the H2O2,HNO3and HNO2species as a function of the pH value.It can be observed that most of the HNO3or HNO2species are in the ionic state(N O?3or NO?2anions,respectively)in the pH range of 5.5–14,while the H2O2species is predominantly in its molecular state in the pH range of 0–10.5.The band shape and position of the absorbances of the considered species will be influenced by the pH values,especially for the N?O2species,which has been reported by Tachibana et al[59]and Ng et al[60]in plasma-activated water.Therefore,to obtain reasonable results from the UV–vis absorption spectra,one must consider the pH influence.We choose to measure the absorbance of the solution in the pH range of 6–10 where the absorbance originates from the H2O2molecules,the NO?3and NO?2ions and the absorbances will not vary with the pH value.
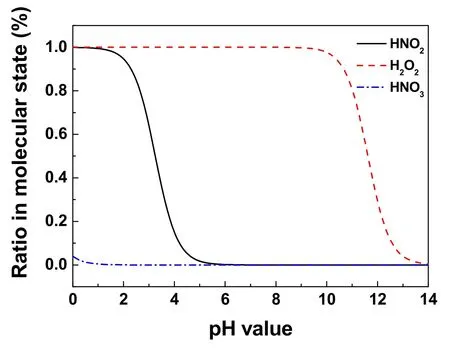
Figure 1.Ratios of the molecular state for the H2O2,HNO3 and HNO2 species as a function of the pH value.The values of pKa at 25°C for the H2O2,HNO3 and HNO2 species are 11.62,?1.38 and 3.25,respectively [61,62].
To quantify the NO?3and NO?2in a solution,we first performed a calibration process by which the absorbances of known concentrations of pure H2O2,NaNO3and NaNO2were measured,separately.The absorbance of solutions was measured by a UV–vis Spectrophotometer (UV-1780,SHIMADZU) with a resolution of 0.5 nm.The used chemicals(analytical grade)of NaNO2and NaNO2were purchased from Sinopharm Chemical Reagent Co.,Ltd.H2O2(30% w/w)was purchased from Xilong Scientific Co.,Ltd.A pH detector(Yesmylab SX620) was used to measure the pH value of the solutions.
To trace and quantify the NO?3and NO?2species in atmospheric pressure air DC discharge plasma-treated solution,we prepared three solutions with pH values of 2.80,6.78,and 8.86.Solutions with pH values of 6.78 and 8.86 were phosphate buffers (10 mM in buffer strength).The solution with the pH value of 2.80 was adjusted by diluted H2SO4solution.The atmospheric pressure air discharge plasma reactor is similar to that used in our previous study[63],and the detailed parameters of the reactor can be found there.Briefly,the plasma treated solution (120 ml,at 25 °C)was circulated by a peristaltic pump with a flow rate of 100 ml min?1in a cylinder-like plasma reactor.2 ml of solution was sampled every 2 min through a T-joint connector in the circulating path.The discharge current was 20 mA,the discharge gap was 3 mm,and the solution acted as a cathode.
The desired derivative absorbance spectrum can be calculated by directly or consecutively differentiating the original absorbance.Because a progressive generation of derivative absorbance can improve the signal-to-noise ratio in the derivative spectrum [64],we use the latter method to obtain the desired derivative absorbance by performing a Savitzky–Golay algorithm.
3.Results and discussion
Figure 2 presents zero-,second-,and third-order absorbances of known concentrations of pure H2O2,NaNO3and NaNO2solutions with the pH values in the range of 6–10 in which the absorbances are not affected by the pH values.We find that there exist inflection points in the derivative absorbances of the NaNO3and NaNO2solutions.In principle,we can obtainfrom fitting equations(8)–(10),while in practice intercepts will be usually introduced to these linear relationships when we perform the fitting process.Table 1 summarizes the inflection points and the linear relationships between the absorbance intensities at these inflection points and the related H2O2,NaNO3and NaNO2concentrations.In addition,the second- and thirdorder absorbances of the H2O2solution are relatively small compared with those of the NaNO3and NaNO2solutions,and the inflection points in the second- and third-order absorbances of the H2O2solution are at the wavelengths of 199.5 nm and 225.0 nm,respectively.Because the absorbances at shorter wavelengths of inflection points for pure NaNO3or pure NaNO2solution are deviated from the Beer’s law at the concentration of 25–100 mg l?1,and the absorbances at longer wavelengths of inflection points are too low,solutions with NaNO3or NaNO2concentration in the range of 25–100 mg l?1need to be diluted to satisfy the Beer’s law before the measurement.
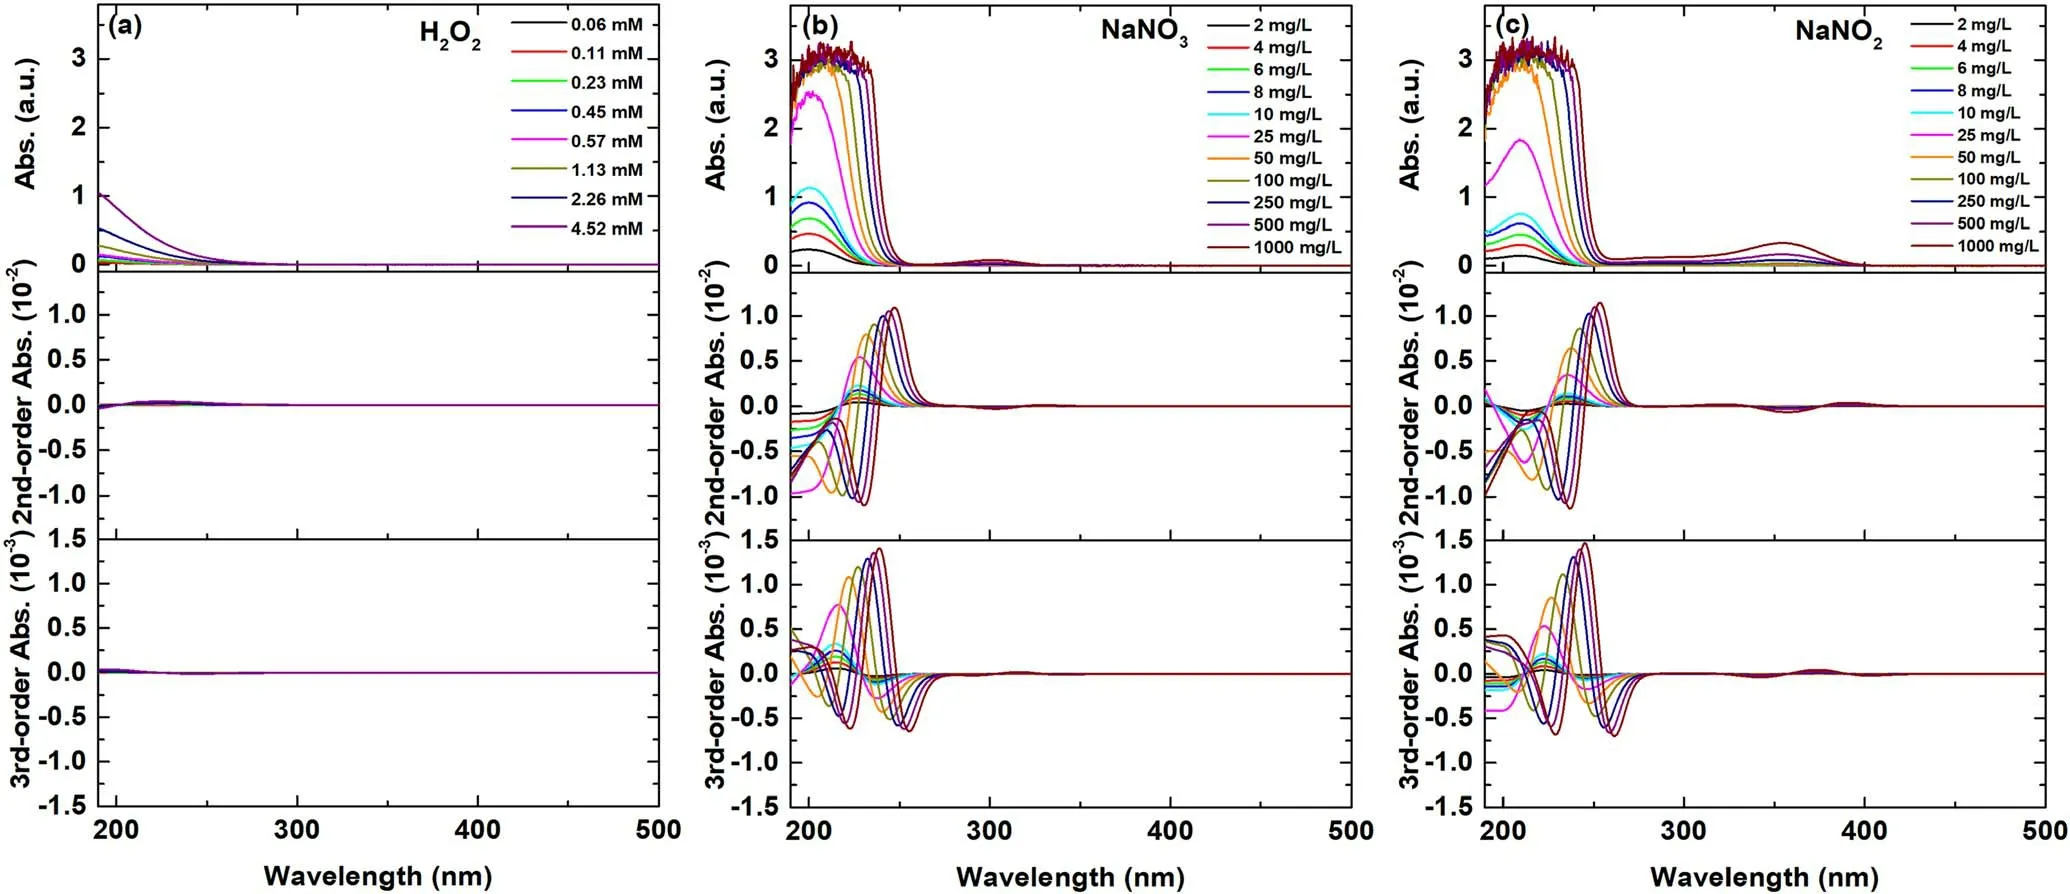
Figure 2.The zero-,second-,and third-order derivative absorbances for different concentrations of (a) H2O2,(b) NaNO3,and (c) NaNO2 solutions.The pH values of these solutions are in the range of 6–10.

Table 1.The slope/intercept in the linear relationships of the absorbance intensities at the inflection points and the concentrations of H2O2,NaNO3,and NaNO2.
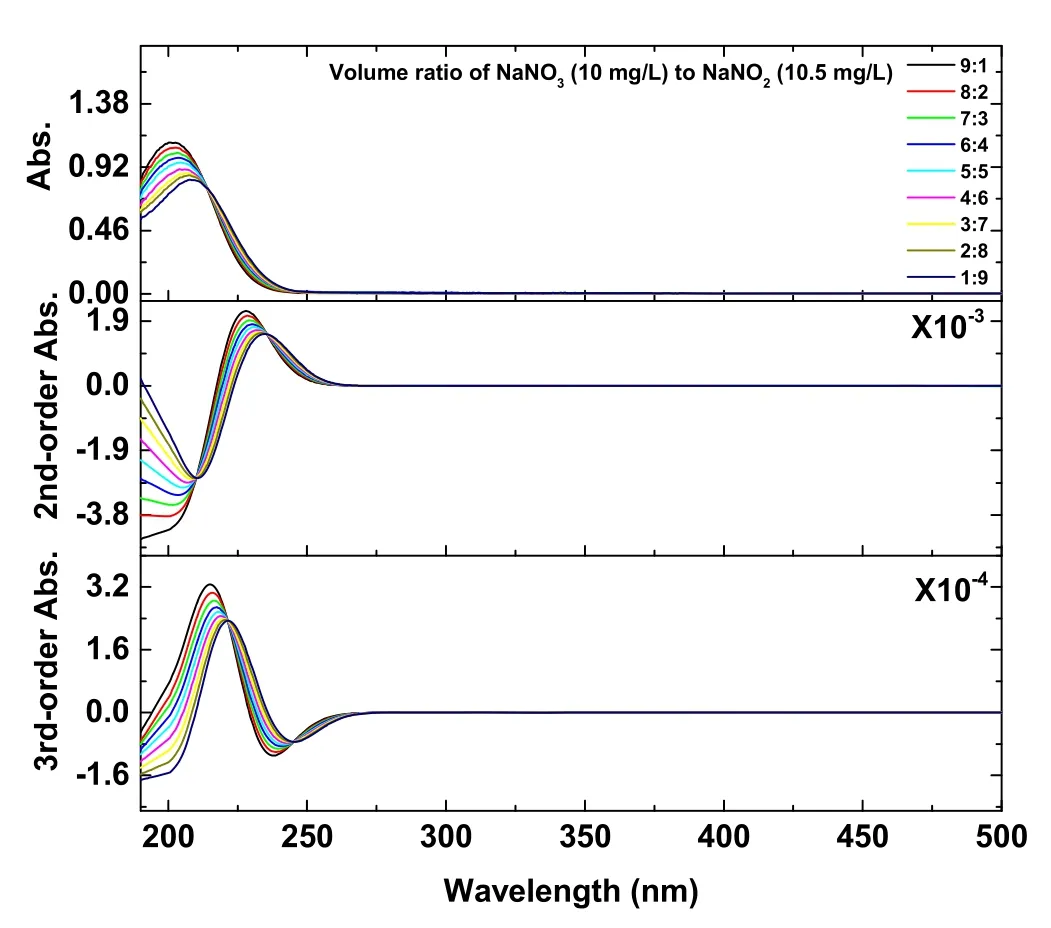
Figure 3.The zero-,second-,and third-order absorbances of the mixed NaNO3 and NaNO2 solutions with different volume ratios.
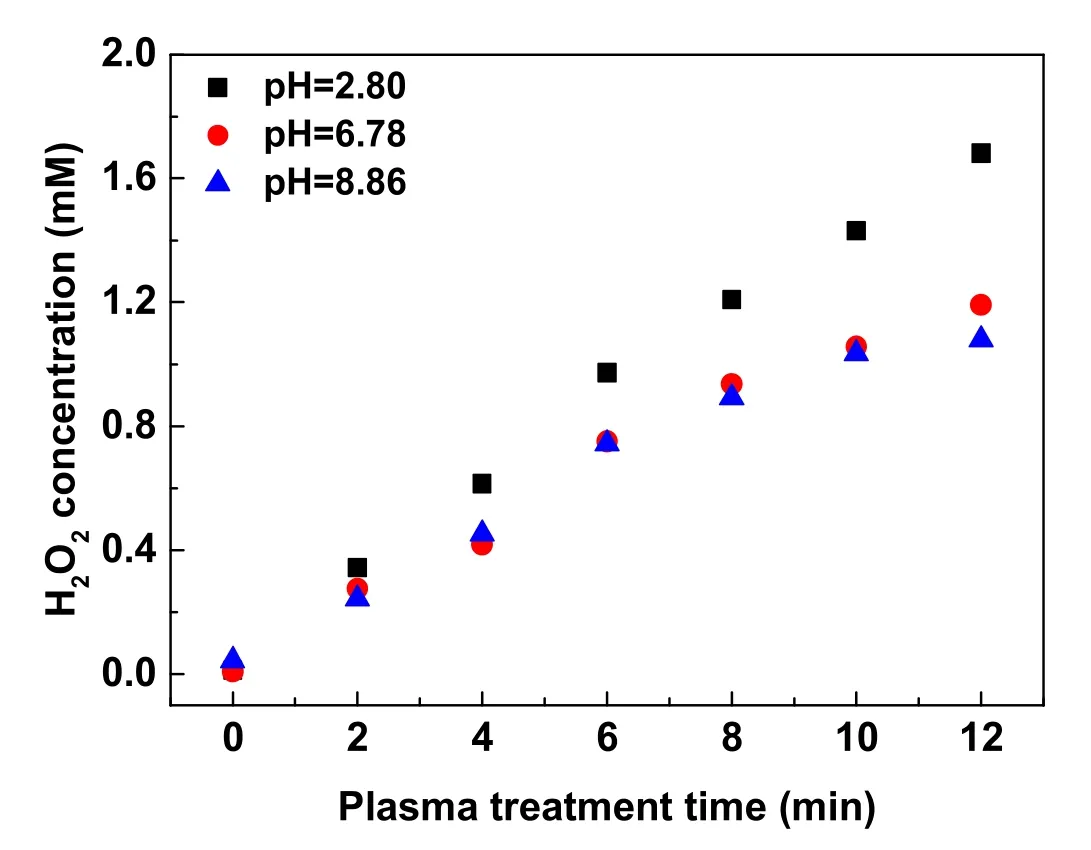
Figure 4.The H2O2 concentration as a function of the plasma treatment time in solutions with pH values of 2.80,6.78,and 8.86.
We prepared a series of aqueous solutions with known concentrations of NaNO3and NaNO2with or without the presence of H2O2.Figure 3 presents the typical zero-,second-,and third-order absorbances of several mixed NaNO3and NaNO2solutions with known concentrations.
Using the method described in the introduction section,we can calculate the NaNO3and NaNO2concentrations in the solutions.The results of all the prepared solutions without H2O2are summarized in table 2.Table 3 provides the calculated NaNO3and NaNO2concentrations of the solutions in the presence of H2O2,according to equation (9).In tables 2 and 3,we compared the actual results with the calculated ones,and the deviation of the calculated results from the real ones is affordable.Therefore,the above-proposed approach is reliable on estimating the NaNO3and NaNO2concentrations.
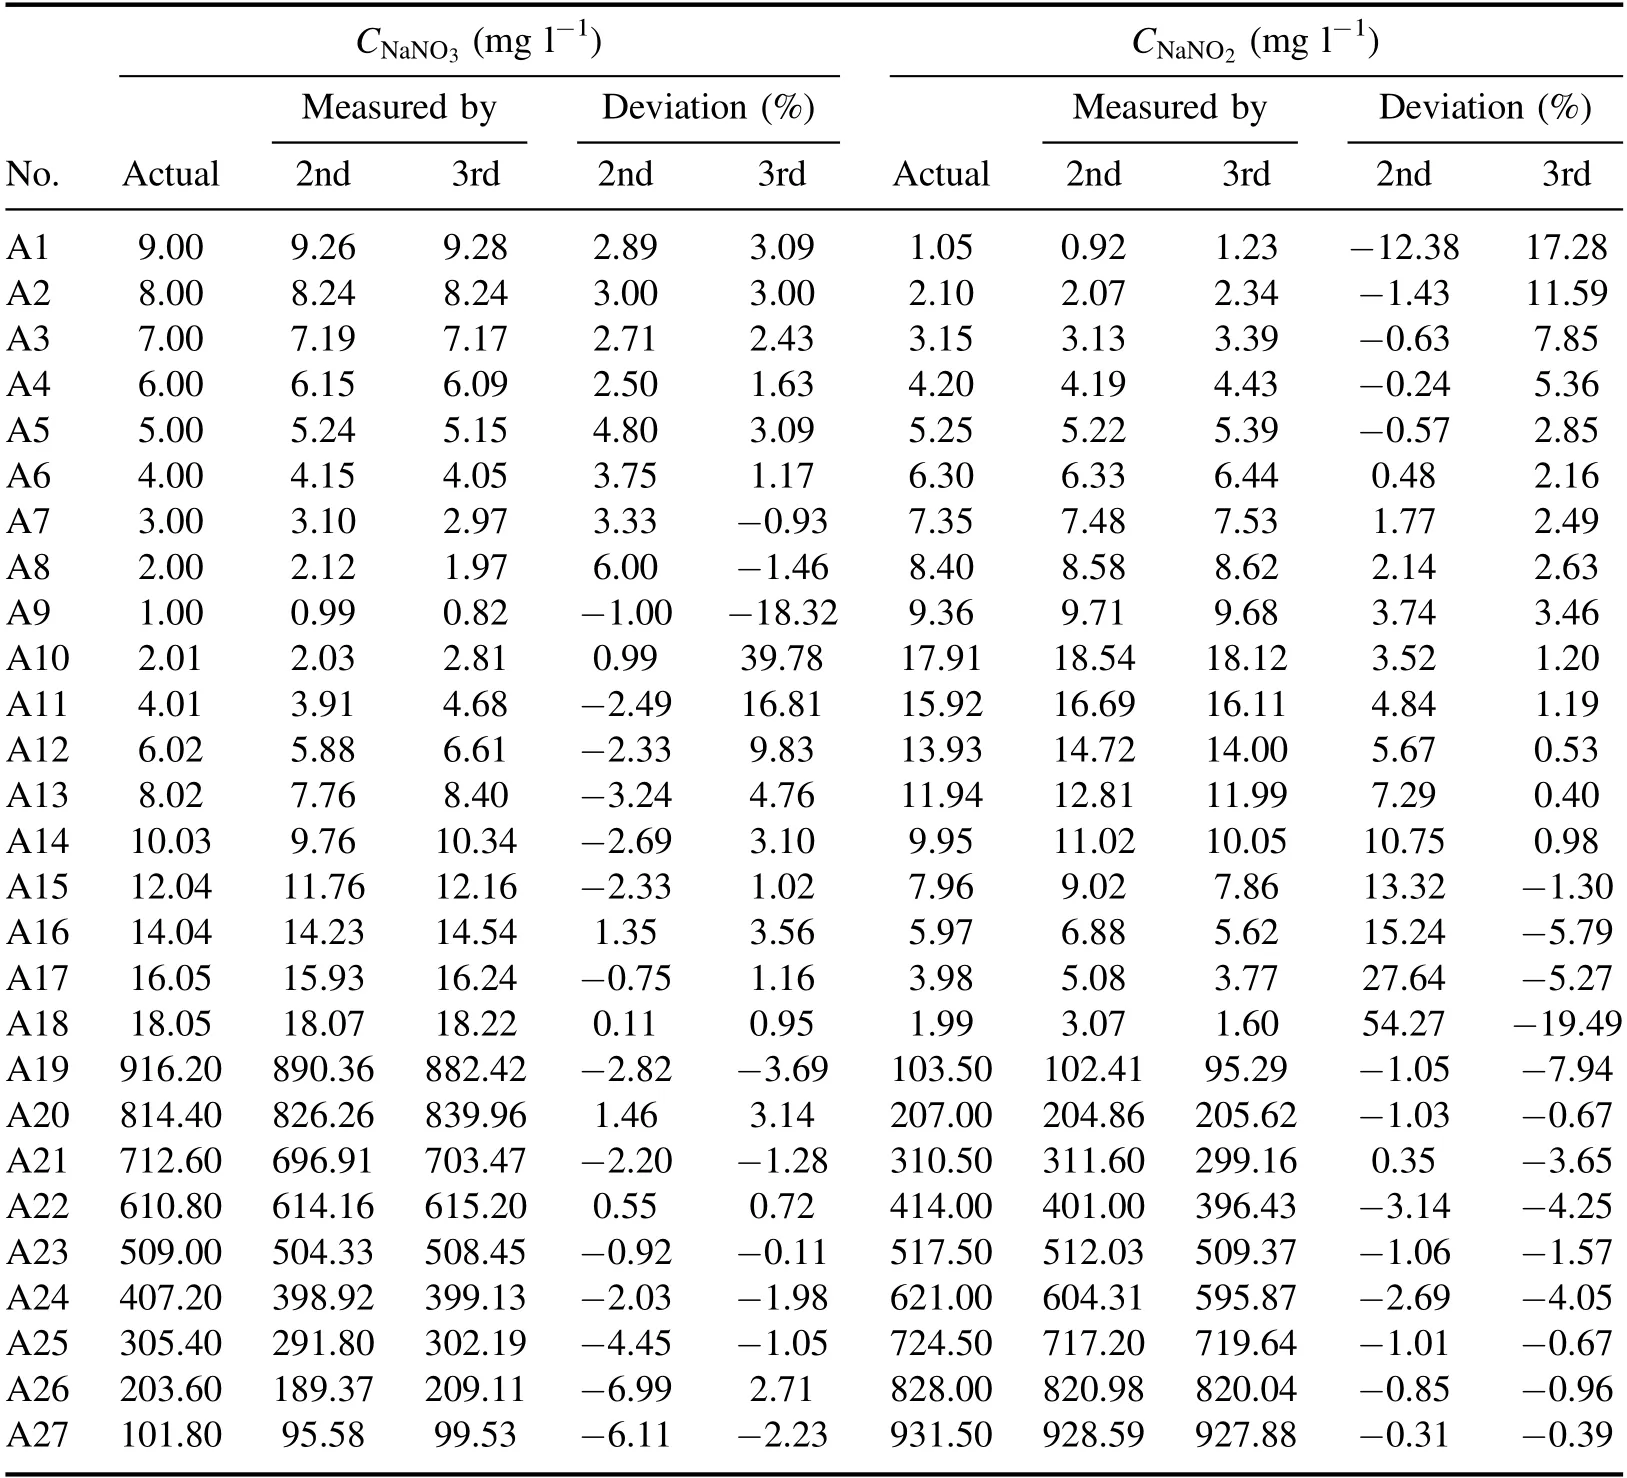
Table 2.Actual and measured concentrations of aqueous mixtures of nitrate and nitrite.The inflection points in 2nd- and 3rd-derivative absorbances are selected to obtain the NaNO3 and NaNO2 concentrationsa.
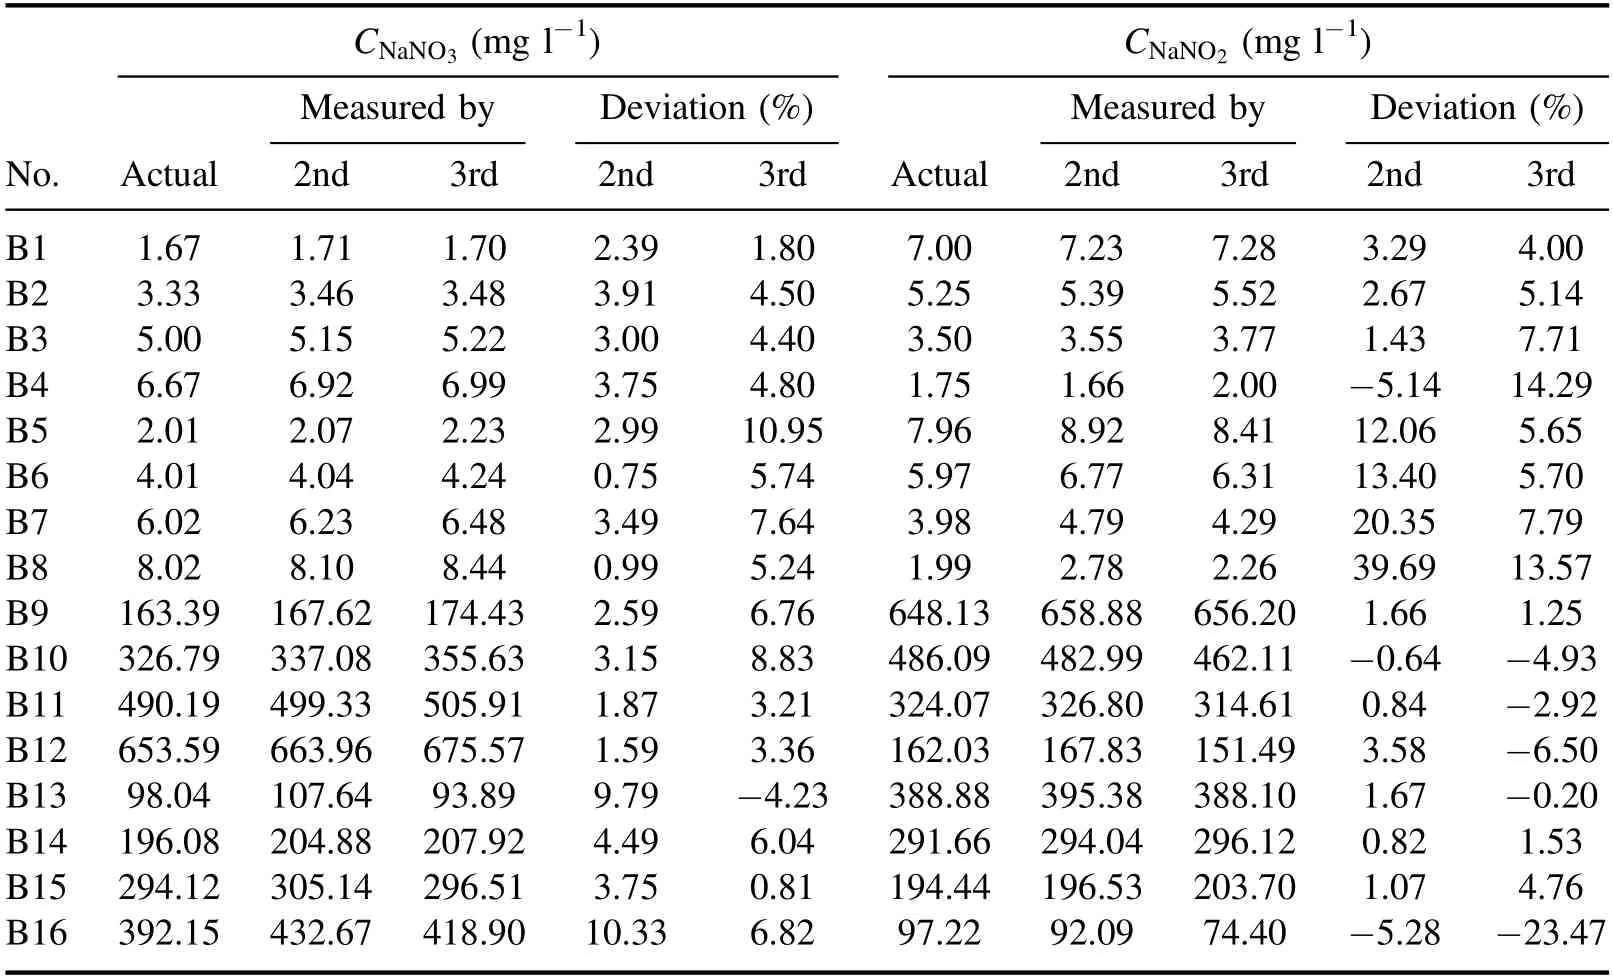
Table 3.Actual and measured concentrations of aqueous mixtures of nitrate and nitrite in the presence of H2O2.The inflection points in 2ndand 3rd-derivative absorbances are selected to obtain the NaNO3 and NaNO2 concentrationsa.The H2O2 concentration is 0.80 mM for B1–B4,and 2.20 mM for B5–B16.
To apply the method to air DC plasma-treated aqueous solutions where the solutions act as a cathode,we prepared three aqueous solutions with pH values of 2.80,6.78,and 8.86.Plasma treated samples were taken every 2 min.The solutions with pH values of 6.78 and 8.86 are phosphate buffered solutions,and then the pH values of solutions after the plasma treatments are still in the range of 6–10,we can directly perform the absorbance measurements in these cases.However,for the solution with the pH value of 2.80,we must adjust the pH value of the sample to be in the range of 6–10 by the prepared phosphate buffer before performing the absorption measurements.The H2O2concentration in the plasma treated solutions is shown in figure 4 which is measured using the colorimetric method as mentioned in the introduction section.For the three solutions,the H2O2concentration in the solutions increases with increasing the plasma treatment time.
Using equation(7),the data in table 1,and the results in figure 4,we can calculate the NO?3and NO?2concentrations in the plasma treated solutions from the measured absorbances.Figure 5 presents the time evolution of the NO?3and NO?2concentrations in the plasma treated solutions with pH values of 2.80,6.78,and 8.86.Both calculations from the second- and third-order derivative absorbances provide the smear results.For solutions with pH values of 6.78 and 8.86,the production rate of the N?O2species is much greater than that of the N?O3species.However,the production rate of the N?O2species for the solution with pH values of 2.80 is much smaller than that of the N?O3species.These results are consistent with our previous study [52]where we considered that the N?O2species will be converted to the N?O3species through the reactions described by equations (16) and (17) when the solution’s pH value is less than 3.3.These reactions might account for the difference of the production rate of the N?O3and the N?O2species in the plasma treated solutions with different pH values
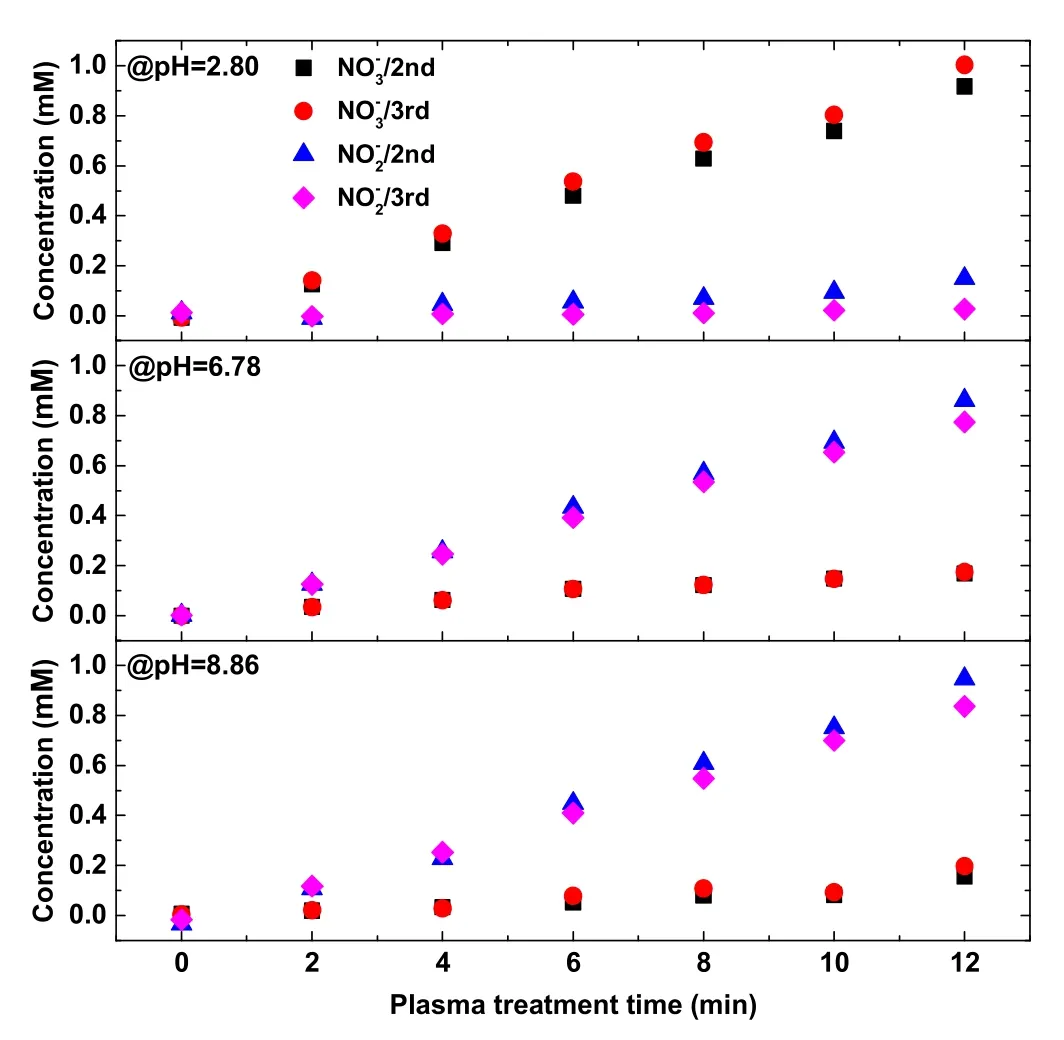
Figure 5.The time evolution of the NO?3 and NO?2 concentrations during the plasma treatment of solutions with pH values of(a)2.80,(b) 6.78,and (c) 8.86.The results are calculated from the second-and third-order absorbances.
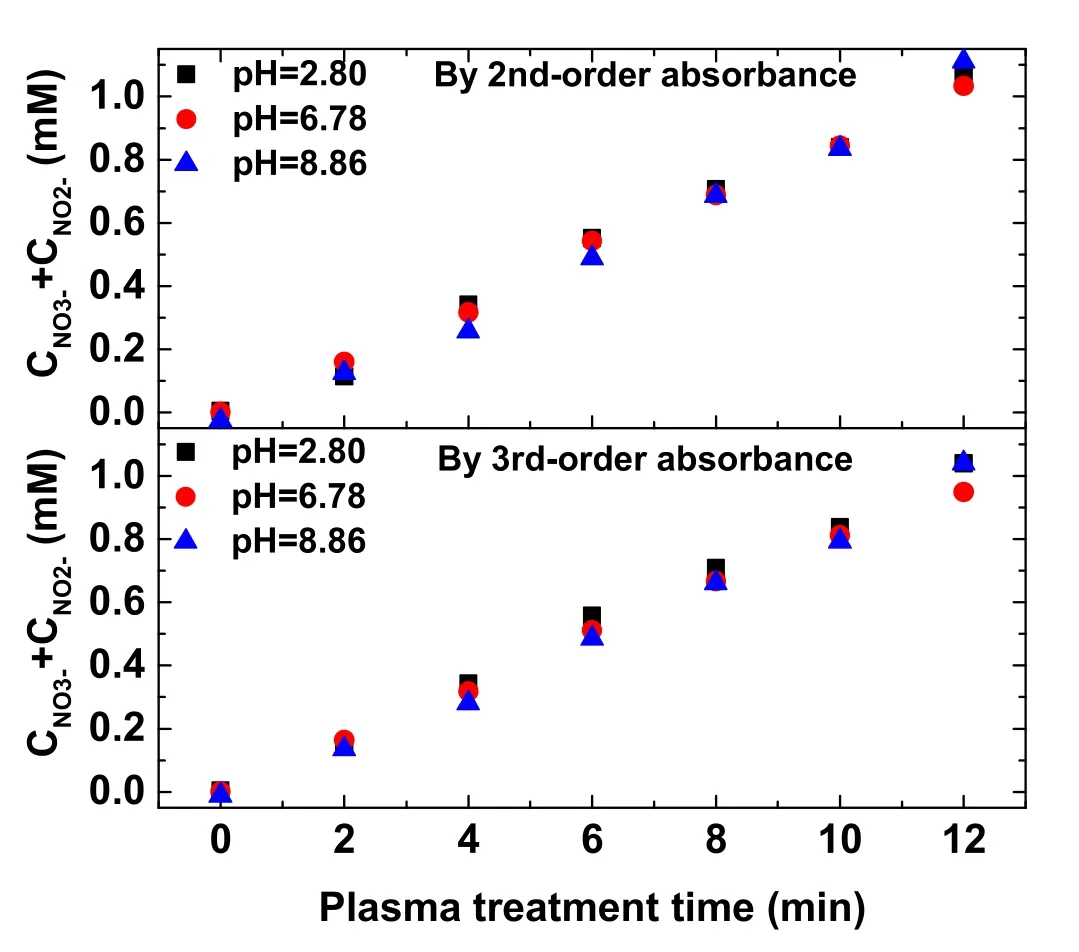
Figure 6.The time evolution of the total concentration for NO?3 and NO?2 during the plasma treatment of solutions with pH values of 2.80,6.78,and 8.86.Data are calculated from (a) second- and (b)third-order absorbances.

When the total concentration of the NO?3and NO?2species in solutions is plotted as a function of the plasma exposure time,we can find that the total concentration of the NO?3and NO?2species is almost the same for solutions with different pH values(figure 6).It is well known that the reactive nitrogen species in the solutions originate from the dissolution of gaseous plasma species [65].Therefore,based on the data in figures 5 and 6,we assume that the dissolution of gaseous nitrogen species is of the similar magnitude and is independent of the solution’s pH value for the plasma discharge sustained with the same discharge current.In the solution,the generation of the N?O2species is prior to the generation of the N?O3species in the solution during the air plasma treatment,and most of the N?O3species in the solution originate from the transformation of the N?O2species.
4.Conclusions
A simple,fast,and toxic reagent-free method is developed to simultaneously measure the NO?3and NO?2species
generated in plasma treated aqueous solutions.The operation is very simple,and only several wavelengths of the inflection points in the derivative absorbance for the considered solution should be examined.If a calibration process for the pure H2O2,NO?3and NO?2species is performed by measuring the known concentrations of the specific species’ absorbance,a simple relationship between the NO?3(or NO?2) concentration and the derivative absorbance at the inflection points can be deduced from the Beer’s law.It is worth pointing out that the measurement must be in a pH range of 6–10 due to the influence of pH values on the band shape and position of the absorbance,especially for the nitrite species.This method is not limited to the plasma treated solutions,and can be applied for the detection of NO?3and NO?2ions in drinking water and other industrial and environmental solutions.In a proof-of-principle application,we use the proposed approach to the plasma treated aqueous solutions with different pH values.The time evolution of the NO?3and NO?2in the solutions during the plasma treatment is investigated.The results indicate that the NO?2species are produced prior to the NO?3generation during the plasma treatment.
Acknowledgments
Q Chen thanks National Natural Science Foundation of China(No.52077185)and the Basic Research Program of Science and Technology of Shenzhen,China(No.JCYJ20190809162617137)for partial financial support.K Ostrikov thanks the Australian Research Council(ARC)and QUT Centre for Materials Science for partial support.
 Plasma Science and Technology2022年8期
- Plasma Science and Technology的其它文章
- A new stage of the Asian laser-induced breakdown spectroscopy community
- Analysis of non-ionized substance losses in experiments on plasma mass separation
- A novel fault current limiter topology design based on liquid metal current limiter
- Wideband radar cross-section reduction using plasma-based checkerboard metasurface
- Effect of rotating liquid samples on dynamic propagation and aqueous activation of a helium plasma jet
- Argon plume transition from a hollow swell to a diffuse swell with increasing amplitude of a trapezoidal voltage
