Correlation between Brightness Variability and Spectral Index Variability for Fermi Blazars
Wen-Xin YangHu-Bing XiaoHong-Guang WangJiang-He YangZhi-Yuan PeiDe-Xiang WuYu-Hai Yuanand Jun-Hui Fan
1 Center for Astrophysics,Guangzhou University,Guangzhou 510006,China; fjh@gzhu.edu.cn, hgwang@gzhu.edu.cn
2 Astronomy Science and Technology Research Laboratory of Department of Education of Guangdong Province,Guangzhou 510006,China
3 Key Laboratory for Astronomical Observation and Technology of Guangzhou,Guangzhou 510006,China
4 Shanghai Key Lab for Astrophysics,Shanghai Normal University,Shanghai 200234,China; hubing.xiao@shnu.edu.cn
5 Department of Physics and Electronics Science,Hunan University of Arts and Science,Changde 415000,China
Abstract In this work,the γ-ray photon flux,photon spectral index (αph),variability index (log V .I .),and the synchrotron peak frequency(logpν)are compiled for 851 common blazars from the 3FGL and 4FGL catalogs and Fan et al.to investigate variability properties for Fermi blazars.Our calculations and analyses reach following results: (1) the averaged luminosity,spectral index,and variability index of FSRQs are higher than those of BL Lacs for the whole sample.(2) It is found that the spectral index variation is closely anti-correlated with the luminosity variation implying that the spectrum becomes harder when the source becomes brighter in the γ-ray band.(3) Positive correlations are found between the photon spectral index and both γ-ray luminosity and variability index(log V .I .)for the whole sample,but anti-correlations are found in the two correlations for FSRQs.For BL Lac subclass,there is a marginal anti-correlation between the photon spectral index and both γ-ray luminosity,and a positive correlation between the photon spectral index and the variability index (log V .I .).We think those two positive correlations found for the whole sample are apparent.(4) We adopted the SVM machine learning method to separate BL Lacs and FSRQs in the αph versus log Lγ and αph versus log V .I .plots and proposed that a BCU is an FSRQ candidate if it satisfieslog V .I . >-1 0.119α +24.855,or αph >-0 .048 log Lγ +4.498,otherwise,itis a BL Lac candidate.Our classification results are quite consistent with those by Kang et al (2019).
Key words: (galaxies:) BL Lacertae objects: general–(galaxies:) quasars: general–galaxies: active Online material: machine-readable tables
1.Introduction
Blazars are a special subclass of active galactic nuclei(AGNs),showing extreme observation properties,such as rapid variability superposed on the long-term slow variation light curve,high and variable linear polarization,high energetic γ-ray emissions,some sources emitting TeV emissions,or superluminal motions,(Stickel et al.1991;Wills et al.1992;Urry&Padovani1995;Fan &Lin1999;Fan et al.2002,2021;Ghisellini et al.2014;Acero et al.2015;Yang et al.2017,2019,2022;Chen2018;Xiao et al.2019;Abdollahi et al.2020;Ajello et al.2020;Otero-Santos et al.2020;Pei et al.2020,2022;Zhang et al.2020;Ye &Fan2021;Zhou et al.2021).Those extreme observational properties can be explained using a beaming model,in which there is a supermassive black hole at the center,surrounded by an accretion disk,the jet coming out from the center is perpendicular to the disk.In this“black hole+accretion disk+jet”model,when the jet points to the observer,the viewing angle is small resulting in a strong beaming effect.The intrinsic flux density (flux density in the co-moving frame),fin,will be strongly boosted,so that the observed flux density,fob,can be expressed asfob=δqfin,where δ is a Doppler factor,which is in the formδ=[ Г (1-βcosθ)]-1,here Г=is a Lorentz factor,θ is the viewing angle,β is the jet speed in units of the speed of light,q=3+α is for the case of a moving sphere,andq=2+α is for the case of a continuous jet (Lind &Blandford1985),α is a spectral index (fν∝ν?α).
Based on the behavior of emission lines,blazars can be classified into two subclasses,namely BL Lacertae objects(BL Lacs)and flat spectrum radio quasars (FSRQs).BL Lacs show weak or no emission line feature while FSRQs have strong emission line features.From the spectral energy distributions(SEDs),it is proposed to use the synchrotron peak frequency to classify different subclass for BL Lacs (Padovani &Giommi1995;Nieppola et al.2006) and even all blazars (Abdo et al.2010b;Fan et al.2016).Following the acronym (Abdo et al.2010b),Fan et al.(2016) calculated the SEDs for a sample of 1392 Fermi blazars and proposed the classification as low synchrotron peak sources (LSPs) if logνp(H z)≤14.0,intermediate synchrotron peak sources(ISPs)if 14.0
Variability is a typically observational property of blazars through the whole electromagnetic wave bands,the variability timescales are from minutes to years as in a work (Fan2005).Observations show that the spectrum changes with the brightness,some sources show that the spectrum becomes bluer (harder) when the sources become brighter,some others show that the spectrum become redder (softer) when the sources become brighter,and there are some sources showing a complex situation (Gu et al.2006;Gupta et al.2008;Zheng et al.2008).
As the following generation of EGRET (Hartman et al.1999),Fermi/LAT detected a lot of γ-ray emitters,and majority of the Fermi/LAT detected sources are AGNs.So,γray emission was also taken as one of the observation properties of blazars (Fan et al.2013).Up to now,several catalogs have been released (Abdo et al.2010b;Nolan et al.2012;Acero et al.2015;Ackermann et al.2015;Abdollahi et al.2020;Ajello et al.2020;Ballet et al.2020).
Observations also show that the γ-ray loud blazars are very variable on a timescale of hours although there is no preferred variability scale for the variation time of any source.The shortest variability timescales are also searched to constrain the size of the γ-ray blazar emitting region (Saito et al.2013;Sobolewska et al.2014).The Fermi/LAT detected a doubling times of ~10 minutes for PKS 1222+216(Aleksic et al.2011),~12 h variability timescale for PKS 1454?354 (Abdo et al.2009),a doubling time of roughly 4 h for PKS 1502+105(Abdo et al.2010a),timescales of 2–3 h were detected in 3C 454.3,3C 273,PKS 1510-089 and PKS B1222+216(Ackermann et al.2010;Tavecchio et al.2010;Foschini et al.2011).A monthly quasi-period timescale was reported by Zhou et al.(2018) for the blazar PKS 2247-131.Short timescales were also detected by EGRET,~4 h for PKS 1622?297(Mattox et al.1997),and ~8 h for 3C 279(Wehrle et al.1998).Quasi-periods from 1.12 to 4.30 yr were detected in the γ-ray light curves of 22 Fermi blazars (Wang et al.2022).
Fermi/LAT detected a lot of γ-ray emitters,there are five catalogs of Fermi/LAT mission,which provide us with a nice opportunity to investigate the variability properties in the γ-ray band.The variability level in the γ-ray can be expressed as a variability index (V.I.) defined in Abdollahi et al.(2020) as:whereSiare the individual flux values,Li(S)is the likelihood in the intervaliassuming fluxS,and σiare the errors onSi,Savis the average flux andSglobis the globe flux.A variability is considered probable ifV.I.>18.48 (Abdollahi et al.2020).

The latest fourth Fermi/LAT catalog (4FGL) with 5099 sources was published (Abdollahi et al.2020;Ajello et al.2020).Out of them 1102 are BL Lacs and 681 are FSRQs,and many blazar candidates of uncertain type (BCUs).
In this work,we used the 3FGL and the 4FGL catalogs to investigate the variability properties.The work is arranged as follows: In Section2,a sample obtained from the 3FGL and 4FGL will be given,results are presented in Section3.The discussions and conclusions are given in Sections4and5.
2.Sample and γ-Ray Luminosity
2.1.Samples
In this work,we obtained 851 common sources withV.I.>18.48 by cross-checking the 4FGL catalog (Abdollahi et al.2020;Ajello et al.2020)and the work by Fan et al.(2016)(whose sample is from 3FGL),the sources are listed in Table1.There are 383 BL Lacs,396 FSRQs,and 72 BCUs.Their redshifts are from NEDs(https://ned.ipac.caltech.edu/classic/),the redshift is in a range ofz=0.00034 for 4FGL J1436.9+5638 toz=6.395 for 4FGL J1233-0144 for the whole sample.There are three objects withz≥4.0,z=6.39520 for 4FGL J1233.7-0144,z=4.26396 for 4FGL J1104.4+0730,andz=4.16248 for 4FGL J0929.3+5014,they are all BL Lacs.For all sources,708 have available redshift giving an averaged redshift of〈z〉=0.937.
For the subclasses BL Lacs,FSRQs,and BCUs,we have following results:For the 383 BL Lacs,only have 279 sources redshifts,zranges fromz=0.00034 toz=6.395.For the 396 FSRQs,it is found thatzis in a range fromz=0.0031 for 4FGL J1434.2+4204 toz=3.104 for 4FGL J0539.9-2839.For the 72 BCUs,33 sources have redshift,which ranges fromz=0.04638 for 4FGL J0602.0+5315 toz=2.08500 for 4FGL J1418.4+3543.
In Table1,Col.(1) gives the 4FGL name;Col.(2)Classification in 3FGL;Col.(3) Classification in 4FGL;Col.(4) redshift;Col.(5) synchrotron peak frequency,log νp(HZ);Col.(6)reference for log νp(HZ),F16:(Fan et al.2016),ZF19:(Zhang &Fan2019);Col.(7) photons in 1–100 GeV given in 3FGL,;Col.(8) error in photons in 1–100 GeV given in 3FGL,Col.(9) photon spectral index in 3FGL,Col.(10) error in photon spectral index,Col.(11) photons in 1–100 GeV given in 4FGL,Col.(12) error in photons in 1–100 GeV given in 4FGL,Col.(13)photon spectral index in 4FGL,Col.(14)error in photon spectral index,Col.(15) variability index in 4FGL,(V.I.)4;Col.(11)–(15)are from Abdollahi et al.(2020).This table is available in its entirety in machine-readable forms.

2.2. γ-Ray Luminosity Calculation

wheredLis a luminosity distance with ΩΛ~0.692,ΩM~0.308 andH0=67.8 km s?1Mpc?1,zis a redshift,αγis a γ-ray spectral index,αγ=αph?1,αphis a photon spectral index,andFis in units of GeV cm?2s?1.In the work,ELandEUcorrespond to 1 GeV and 100 GeV respectively.
3.Results
In 2016,Fan et al.(2016)calculated the SED for a sample of 1392 blazars from the 3FGL catalog (Acero et al.2015;Ackermann et al.2015).Based on the catalogs of 3FGL and the 4FGL catalog (Abdollahi et al.2020;Ajello et al.2020),we obtained the integral photons,spectral index,and variability index (V.I.) for 851 sources withV.I.>18.48.We also calculated the γ-ray luminosity,Lγcorresponding to the 3FGL and 4FGL catalogs.From all those parameters,we can discuss their distributions and their mutual correlations for the whole sample,and BL Lacs and FSRQs subclasses respectively.Because BCUs are not known to belong to which subtype,we do not consider average value or correlations for BCUs.
3.1.Average Values
Redshift-z: For the 851 blazars and blazar candidates,redshift is available for 702 sources from NED.For all the known redshift,an averaged value 〈z〉=0.937 is obtained.If we only considered 396 FSRQs and 279 BL Lacs with available redshift,then the averaged value of redshift is〈z〉=0.945.In Figure1(a),the redshift distribution for the 396 FSRQs is shown in the upper left panel,and that for the 279 BL Lacs is shown in the lower left panel while their cumulative distribution for FSRQs and BL Lacs is shown in the right panel.The averaged values arez=1.168±0.622 for FSRQs,andz=0.628±0.724 for BL Lacs.When a K-S test is performed to the distributions,a probabilityp=1.35×10?31for the two distributions to be from the same parent distribution is obtained.
Photon Spectral Index-αph: From the 4FGL catalog(Abdollahi et al.2020;Ajello et al.2020),the photon spectral index distributions are shown in the upper left panel for FSRQs,in the lower left panel for BL Lacs in Figure1(b),a cumulative distribution is shown in the right panel of Figure1(b).One can get the averaged values of〈αph〉=2.45 ±0.16 for FSRQs,and 〈αph〉=2.05 ±0.18 for BL Lacs.The probability for the two distributions to be from the same parent distribution is zero (p=1.17×10?110).
Variability Index—V.I.: From the 4FGL catalog,we can get the variability in the γ-ray band,the logarithm of the γ-ray variability index is obtained and their distribution is shown in the upper left panel for FSRQs,in the lower left panel for BL Lacs in Figure1(c),and a corresponding cumulative distribution is in the right panel of Figure1(c).The obtained corresponding averaged values are 〈 logV.I.〉 = 2.35 ±0.68 for FSRQs,and 〈 logV.I.〉 = 1.81 ± 0.51for BL Lacs.The correspondingpis 2.83×10?30.
γ-ray Luminosity—logL γ: From Equation (3),one can calculate the γ-ray luminosity,Lγ.However,it is found that some sources have no known redshift,so an averaged value of〈z〉=0.628 is adopted for BL Lacs without known redshift,and 〈z〉=0.937 for the BCUs without redshift.
The logarithm of the γ-ray luminosity is obtained and their distribution is shown in the upper left panel for FSRQs,in the lower left panel for BL Lacs in Figure1(d),and a corresponding cumulative distribution is in the right panel of Figure1(d).The corresponding averaged values are 〈 logLγ〉= 47.50 ±0.98 for FSRQs,and 〈 logLγ〉= 46.95 ±1.29for BL Lacs.The correspondingpis 1.06×10?10.
Variation of Photon Spectral Index—Δαph:From 3FGL and 4FGL catalogs,we can obtain the change of photon spectral indexWe show their histograms in the upper left panel for FSRQs,in the lower left panel for BL Lacs in Figure1(e),and a corresponding cumulative distribution is in the right panel of Figure1(e).The corresponding averaged values are Δαph=0.044 ±0.147 for FSRQs,and Δαph=0.008 ±0.080 for BL Lacs.The corresponding probabilityp=2.42×10?4.
Variation of Luminosity—ΔlogLγ: From 3FGL and 4FGL catalogs and the luminosity calculation of Equation (3),we can obtain the logarithm of luminosity,and the corresponding variability Δ logLγ=We show their histograms of luminosity variability in the upper left panel for FSRQs,in the lower left panel for BL Lacs in Figure1(f),and a corresponding cumulative distribution is in the right panel of Figure1(f).The corresponding averaged values are ΔlogLγ=0.07 ±0.30for FSRQs,andΔlogLγ=0.02±0.21for BL Lacs.The probability for the two distributions to be from the same parent distribution isp=7.54×10?8.
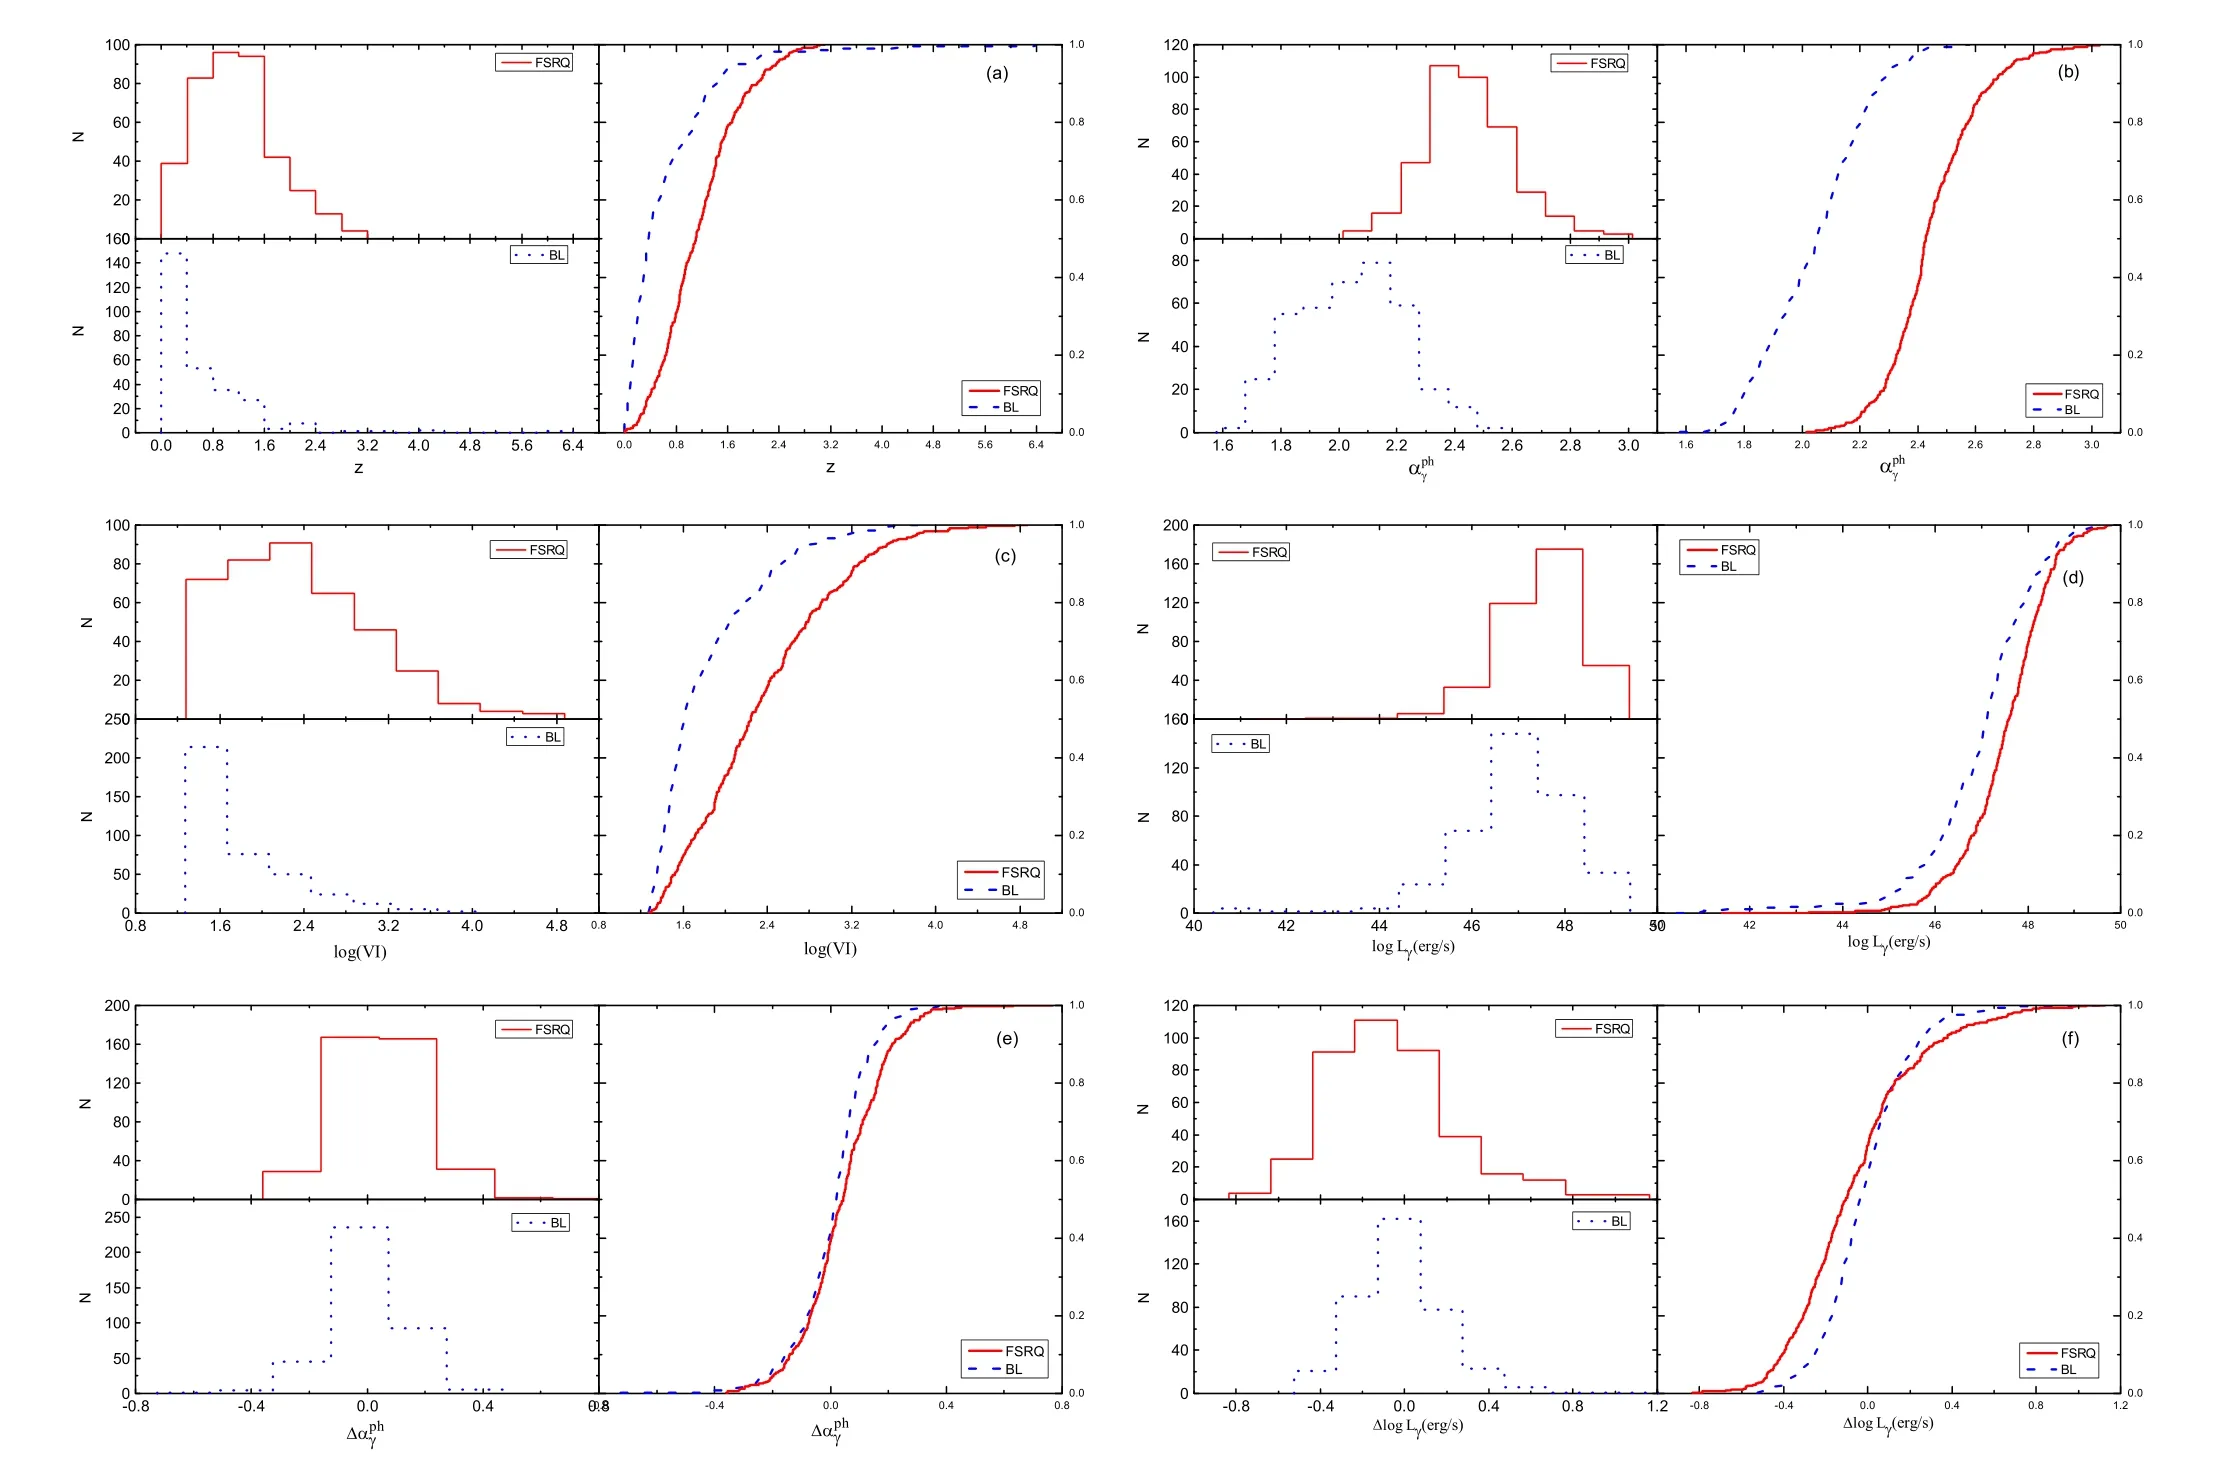
Figure 1.Histograms for FSRQs(upper left panel)and BL Lacs(lower left panel)and their corresponding cumulative distributions in the right panel for parameters.(a) For redshift (z),(b) for photospectral index (αph),(c) for variability index (V.I.),(d) for γ-ray luminosity obtained from 4FGL catalog (logL γ (erg s?1)),(e) for variability of photospectral index (Δαph),and (f) for variability of γ-ray luminosity (ΔlogLγ).
3.2.Correlations
We will make the mutual correlation analysis for physics parameters.
Photon Spectral Index versus Redshift(αph?z): In the present sample,redshift is known for 708 blazars and BUCs.When a linear regression is adopted to the available redshift and photon spectral index,it is obtainedαph= (0.799±0.017) log (1 +z)+2.077 ±0.018for the 708 blazar with available redshift with a correlation coefficientr=0.459 and a chance probability ofp<10?4.When the two subclasses are considered separately,it is found thatαph= (0.248±0.062) log (1 +z)+2.370 ±0.021withr=0.20 andp<10?4for the 396 FSRQs,andαph= (0.30±0.075) log (1 +z)+1.991 ±0.018withr=0.23 andp=1.06×10?4for the 279 BL Lacs.See Figure2(a).
Spectral Index versus Peak Frequency(αph?νp): Fan et al.(2016) obtained synchrotron peak frequency (logpν) for 1392 3FGL blazars from their SED fittings.In this work,we only considered 851 common sources with 4FGL andV.I.>18.48.When a linear correlation analysis is adopted to the photon spectral index(αph)from 4FGL catalog and the peak frequency(logpν),it is found that

withr=?0.61 andp<10?4for the whole sample (851 blazars and BCUs).The corresponding best fitting result is shown in Figure2(b).When BL Lacs and FSRQs are considered separately,one hasαph=-(0 .116 ± 0.006) logνp+3.750 ±0.093withr=?0.683 andp<10?4for 383 BL Lacs,and a marginal correlationαph=(0 .027 ± 0.109) logνp+2.082 ±0.168withr=0.109 andp=2.9% for 396 FSRQs.
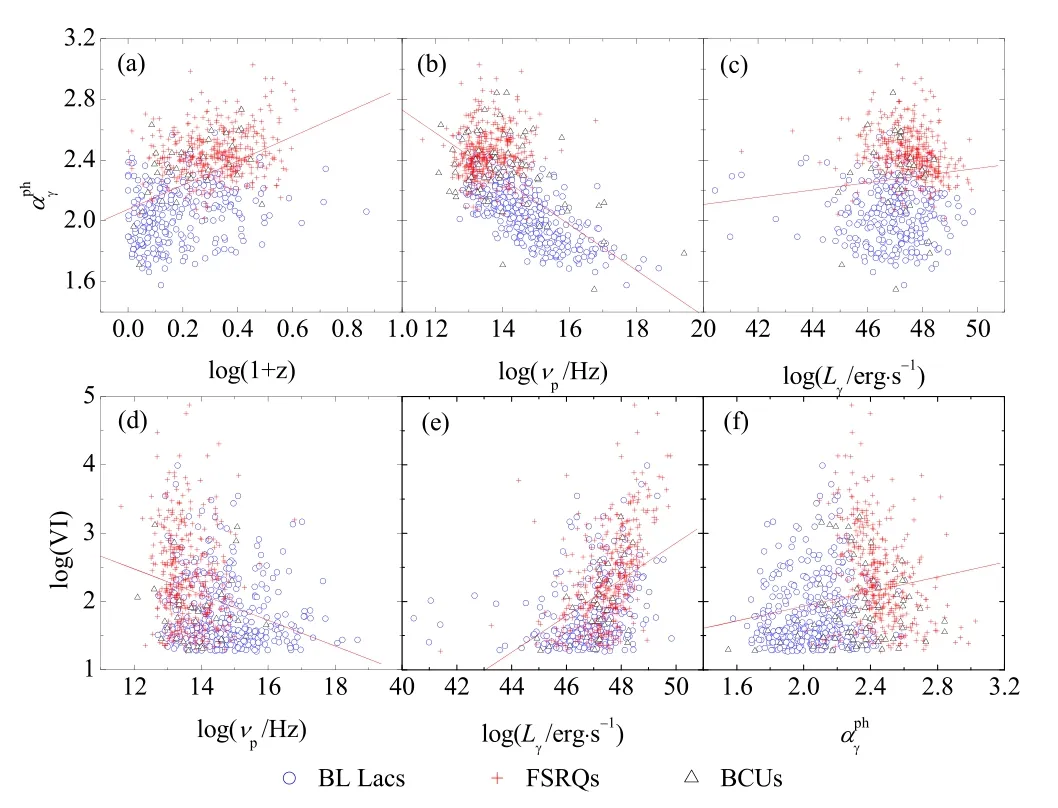
Figure 2.Plot of mutual correlations.The straight line stands for the best fitting result for the whole sample.Symbol“plus”is for FSRQs,“open circle”for BL Lacs,and “open triangle” for BCUs.(a) Photon spectral index (αph) against redshift (1+z),(b) photon spectral index (αph) against synchrotron peak frequency (log νp),(c) photon spectral index (αph) against γ-ray luminosity obtained from 4FGL catalog (logL γ (erg s?1)),(d) variability index (log V .I .)against synchrotron peak frequency (log νp),(e) variability index (log V .I .)against γ-ray luminosity (logL γ (erg s?1)),and (f) variability index (log V .I .)against photospectral index (αph).
Luminosity versus Photon Spectral Index(Lγ?αph):From the calculated γ-ray luminosity and the photon spectral index from the 4FGL catalog,we investigated their mutual correlation and obtained

withr=0.262 andp=5.9×10?3for all the 708 blazars and BCUs with available redshift.The corresponding best fitting result is shown in Figure2(c).When BL Lacs and FSRQs with available redshift are considered separately,one hasαph=-(0.038 ± 0.008) logLγ+4.255 ±0.376withr=?0.235 andp<10?4for 396 FSRQs,and there is no clear correlation between αphandlogL γfor BL Lacs.
Variability Index versus Peak Frequency(V.I.?νp): When the linear correlation analysis is adopted to the variability index(logV.I.)from 4FGL catalog and logpν(Fan et al.2016),it is found that

with a correlation coefficientr=?0.297 and a chance probability ofp<10?4for the whole sample.The corresponding best fitting result is shown in Figure2(d).When BL Lacs and FSRQs are considered separately,one haslogV.I.=-(0.133 ± 0.053) logνp+4.157 ± 0.723withr=?0.125 andp=1.2% for 396 FSRQs,and logV.I.= -( 0.058±0.024) logνp+2.669 ± 0.356withr=?0.123 andp=1.6% for 383 BL Lacs.
Luminosity versus Variability Index(Lγ?V.I.): From the present γ-ray luminosity and variability index obtained from the 4FGL catalog,we obtained their mutual correlation

withr=0.460 andp<10?4for all the 708 blazars and BCUs with available redshift.The corresponding best fitting result is shown in Figure2(e).While for BL Lacs and FSRQs with available redshift,one has logV.I.=(0 .357 ± 0.030) logLγ-14.621 ±1.425 withr=0.512 andp<10?4for 396 FSRQs,andlogV.I.=(0.108 ±0.023) logLγ- 3.286 ±1.069withr=0.275 andp<10?4for 279 BL Lacs.
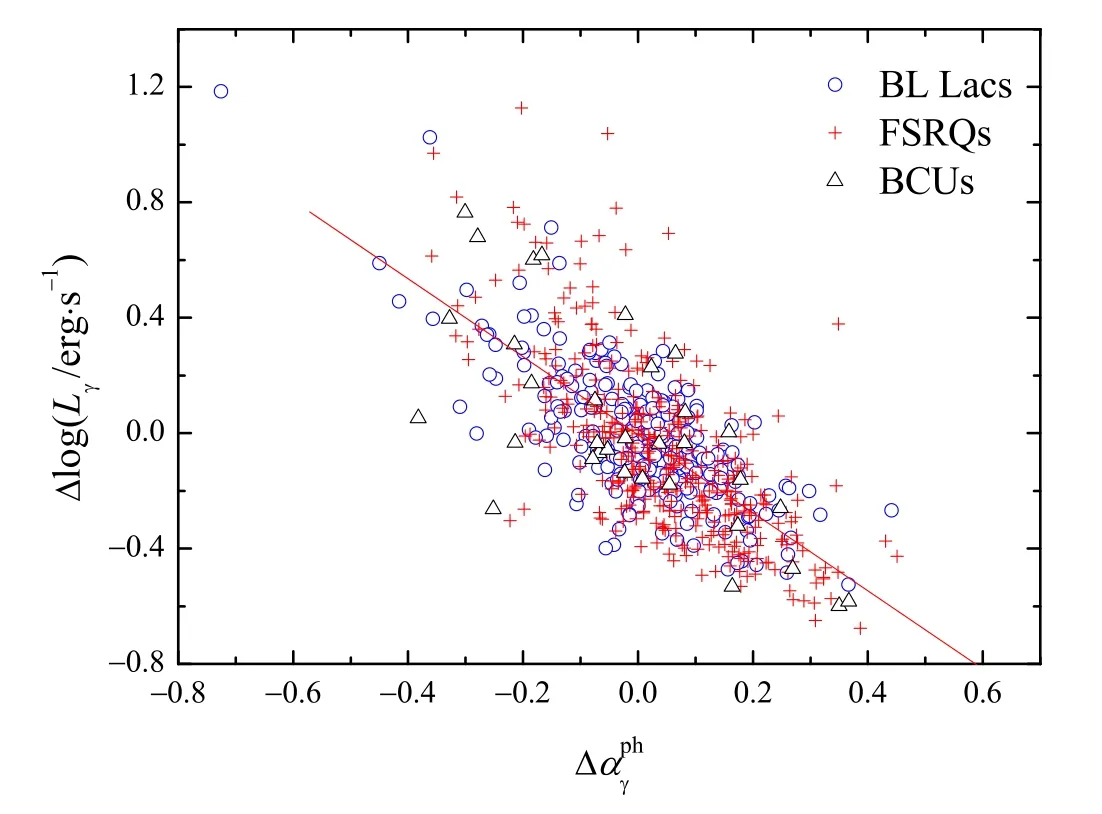
Figure 3.Plot of variability in luminosity (ΔlogLγ) against variability in photon spectral index (Δαph).The solid line stands for the best fitting result.Open circles stand for BL Lacs,plus for FSRQs,and triangle for BCUs.
Photon Spectral Index versus Variability Index(αph?V.I.):The photon spectral index and variability are obtained from the 4FGL catalog for the 851 sources,and a linear mutual correlation analysis gives

4.Discussions
Variability is one of the typical observation properties in blazars,and it shows up through the whole electromagnetic wavelength.The rapid variability may be due to the relativistic beaming effect because,when a beaming effect is taken into account,the observed timescale(Δtob.)is shorter than the intrinsic timescale (Δtin.) while the observed flux density (fob.) is larger than the intrinsic flux density (fin.) as Δtob.=Δtin./δ,fob.=δp+αfin..The variations are used to estimate Doppler factor in radio bands (L?hteem?ki &Valtaoja1999;Hovatta et al.2009;Savolainen et al.2010;Liodakis et al.2018),in the optical band(Xie et al.1989,1992),and in the γ-ray bands(Mattox et al.1993;von Montigny et al.1995;Cheng et al.1999;Fan2005;Fan et al.2013,2014;Pei et al.2020;Zhang et al.2020;Yang et al.2022).
Observations show rapid variation in the γ-ray band(Kniffen et al.1993;Mattox et al.1993;Abdo et al.2009,2010a;Ackermann et al.2010;Tavecchio et al.2010;Aleksic et al.2011;Foschini et al.2011) and show periodic variations in some Fermi blazars as summarized by Wang et al.(2022).
After the launch of Fermi/LAT in 2008,five catalogs(0FGL,1 FGL,2FGL,3FGL,and 4FGL) have been released.By cross-checking 4FGL-DR27(Abdollahi et al.2020)and the sample (Fan et al.2016),there are 1250 common blazars (702 BL Lacs,427 FSRQs,and 121 BCUs).If we only take the blazars withV.I.>18.48 (Abdollahi et al.2020),then we can get a sample of 851 blazars(383 BL Lacs,396 FSRQs,and 72 BCUs),which are considered in this work.In our sample,there are 708 sources with available redshift from NED,including three BL Lacs withz>4,which are 4FGL J0929.3+5014(z=4.16248),4FGL J1104.4+0730(z=4.26396),and 4FGL J1233.7-0144(z=6.3952).We note that these values are much larger than the average of the BL Lac redshift,but we still use these values of redshift in this work as there are no other available redshifts for them,except for a redshift lower limit of 0.1 for 4FGL J1233.7-0144 (Paiano et al.2020).
4.1.The Average Values
The present analysis based on our sample shows that,on average,the photon spectral index (αph),the variability index(logV.I.),the γ-ray luminosity (logL γ),and its variability(ΔlogLγ) in FSRQs are all clearly greater than those in BL Lacs.The K-S test indicates that the probabilities for the distribution for FSRQs and that for BL Lacs to be from the same parent distribution is less than 7.54×10?8.For the average variation in spectral index (〈Δαph〉),we can also obtain that 〈Δαph〉 of FSRQs is greater than that of BL Lacs,the K-S test indicates that the probability for the distribution in FSRQs and that in BL Lacs to be from the same parent distribution isp=2.42×10?4.
The fact that FSRQs show greater γ-ray luminosity and the photon spectral index than the BL Lacs was mentioned in previous studies(Ghisellini et al.2009;Ackermann et al.2015;Chen2018;Abdollahi et al.2020).It is found that the photon spectral index decreases with synchrotron peak frequency as shown in Figure2(b),which is consistent with the result that〈αph〉 in FSRQs is averagely greater than that in BL Lacs(Figure1(b)) because FSRQs have,on average,lower synchrotron peak frequency (logνph) than do BL Lacs.Our result is also consistent with that in Ackermann et al.(2015),who displayed that the photon spectral index decreases with synchrotron peak frequency.The γ-ray emission is originated from the inverse Compton(IC)process in a leptonic model,the FSRQs are believed to have richer seed photons from the external field than the BL Lacs (Fossai et al.1998;Ghisellini et al.1998) that have been proved by the emission line observations (Shaw et al.2012;Paliya et al.2021).From the view of the relativistic beaming model,blazars display a strong beaming effect (Hovatta et al.2009;Liodakis et al.2018) and the FSRQs show a larger Doppler factor than the BL Lacs in γray band (Zhang et al.2020;Xiao et al.2022).Thus,it is natural that the FSRQs are showing brighter γ-ray luminosity than the BL Lacs.A rich soft photon field yields a lower synchrotron and IC peaks,which is mostly observed in FSRQs,due to the efficient relativistic electrons cooling.In this case,those electrons can hardly up-scatter soft photons to extremely high energy regime.Consequently,FSRQs have lower IC peak frequency and steeper γ-ray spectrum than the BL Lacs at GeV γ-ray band.
From the perspective of blazar γ-ray emission,a more variable γ-ray emission and spectral is expected for FSRQs.Because γ-ray emission is believed to be a combination of synchrotron self-Compton(SSC)and of IC process for FSRQs,the SSC is considered to be the only γ-ray emission mechanism in BL Lacs(Ghisellini et al.1998).The strength of the external photons field,which is provided by the accretion disk,board emission-line region (BLR),and dusty torus (DT),could vary with the black hole and disk activities.Thus,we should expect larger γ-ray luminosity variability (ΔlogLγ),spectral index variability (〈Δαph〉),and variability index (logV.I.).One can also find that the variability index (logV.I.) decreases with synchrotron peak frequency (logpν) as shown in Figure2(d),which is consistent with that in Ackermann et al.(2015).
4.2.The Separation between FSRQs and BL Lacs
For the γ-ray luminosity and the photon spectral index,it was found that the spectral index increases with the γ-ray luminosity in Ghisellini et al.(2009),who proposed that FSRQs occupy the region with αγ>1.2 and logLγ(e rg s-1) >47,and BL Lacs in the region with αγ<1.2 and logLγ(e rg s-1) <47.In this work,a positive correlation,αph= (0 .024 ± 0.009) logLγ+1.162 ±0.405shows up for the 708 sources with available redshift as shown in Figure2(c),which is consistent with the results in Ghisellini et al.(2009),Ackermann et al.(2015).
However,when BL Lacs and FSRQs are considered separately,they both display different correlations between the spectral index and the γ-ray luminosity.αph=-( 0.038±0.008) logLγ+4.255 ±0.376withr=0.235 andp<10?4is obtained for 396 FSRQs showing an anti-correlation,and there is also a marginal anti-correlation,αph=-( 0.011±0.008) logLγ+2.562 ±0.392for BL Lacs.It is found that the more luminous the source is the harder the γ-ray spectrum,suggesting brighter source have harder spectrum.So,the observed positive correlation for the whole blazars between the γ-ray luminosity and the photon spectral index is an apparent correlation.
Our analysis shows that BL Lacs and FSRQs occupy different regions in the plot of spectral index against the γ-ray luminosity(αphversuslogL γ) as in Ghisellini et al.(2009),in which the separation between FSRQs and BL Lacs results from two independent populations with different physical conditions as to the origin,propagation and radiative properties of their jets.We employ a support vector machine (SVM),a kind of machine learning(ML) method,to find a dividing line for separating the two blazar subclasses in the diagram of αphversuslogL γ.The result gives an accuracy of 91.0%for the separation and predicts a dividing line ofαph=-0 .048 logLγ+4.498as shown in Figure4.In 2018,Chen (2018) obtained thatαph=-0.127 logLγ+8.18with an accuracy of 88.6%.It is found in Figure4that majority of FSRQs occupy the region above the line while majority of BL Lacs below the line.Therefore,a source is classified as an FSRQ candidate ifαph>-0.048 logLγ+4.498,otherwise,it is classified as a BL Lac candidate.When the 72 BCUs are considered,50 BCUs are in the region above the dividing line,so those BCUs can be taken as FSRQ candidates and 22 BCUs are in the region below the line,which can be taken as BL Lac candidates.
Figure2(f) shows a positive correlation between variability indexlogV.I.and the photon spectral index (αph).FSRQs,which lie in the upper-right region,have higher variability and larger power index than BL Lacs,which occupy the lower-left region.So,the positive correlation is apparent.When BL Lacs and FSRQs are considered separately,there is an anticorrelation for FSRQs but no correlation for BL Lacs as shown in Figure2(f).
We also employ a support vector machine (SVM) to find a dividing line for separating blazar subclasses in the diagram oflogV.I.against αph.A dividing line oflogV.I.=-10.119αph+24.855with an accuracy of 91% for the separation is obtained as shown in Figure5.FSRQs occupy the region above the line while BL Lacs are below the line.Therefore,a source is classified as an FSRQ candidate if logV.I. >-1 0.119αph+24.855,otherwise,it is classified as a BL Lac candidate.
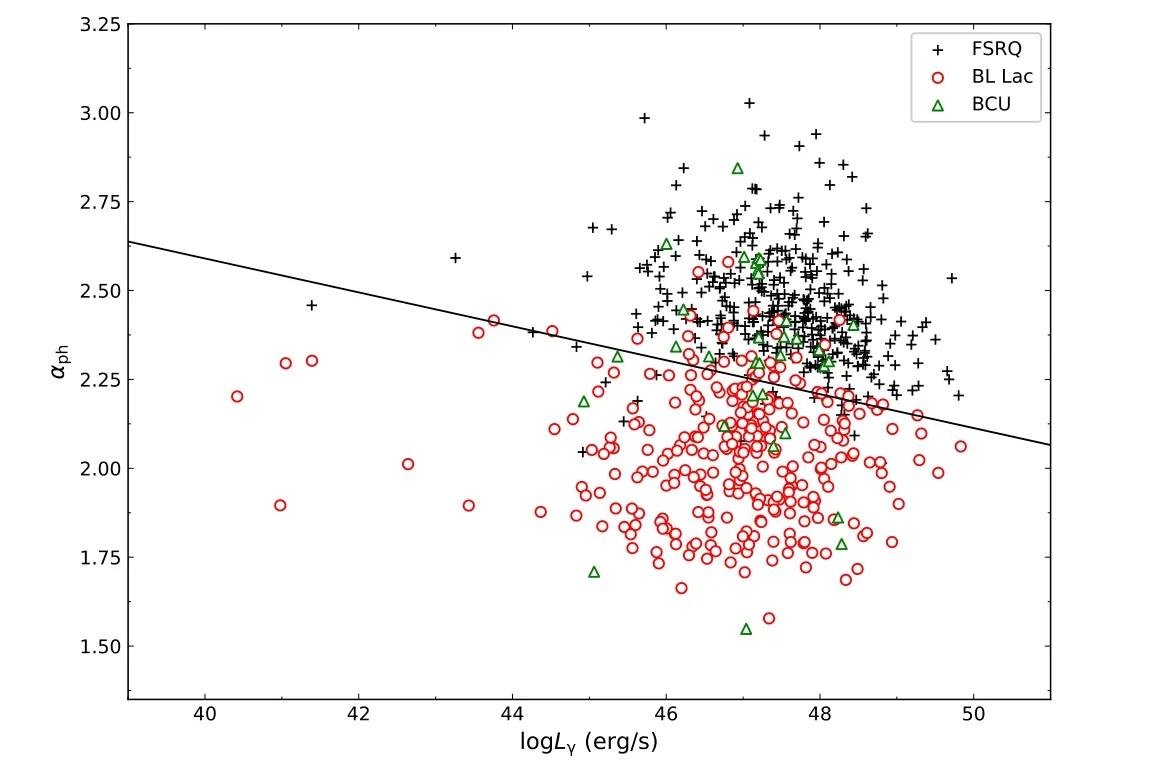
Figure 4.Plot of photon spectral index against gamma-ray luminosity.Open circles stand for BL Lacs,plus for FSRQs,and triangle points for BCUs.The solid line (α ph=-0 .048 log Lγ +4.498) is obtained from the SVM method,it separates FSRQs and BL Lacs.
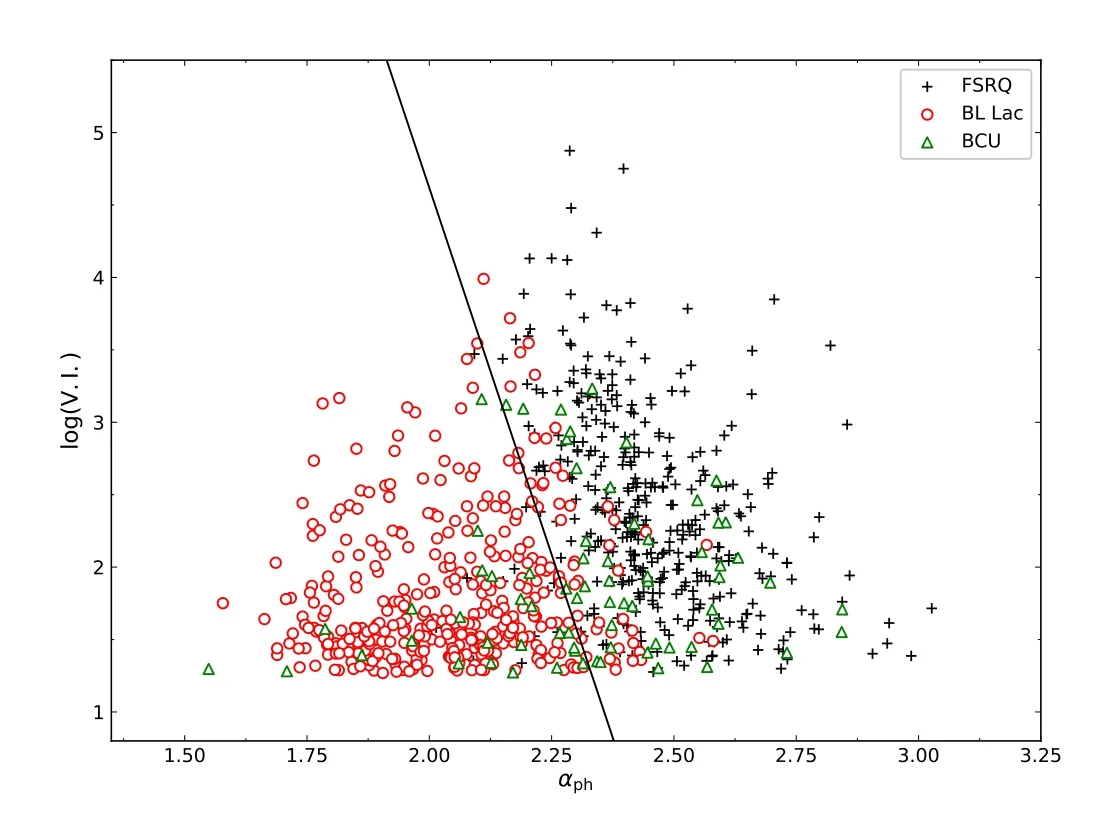
Figure 5.Plot of variability index (log V .I .) against photon spectral index(αph).The solid line,log V .I .=-1 0.119α ph+24.855,stands for a dividing line obtained from support vector machine (SVM).Open circles stand for BL Lacs,plus for FSRQs,and triangle points for BCUs.Solid points above the dividing line are classified as FSRQs candidates,while those below the line as BL Lac candidates.
When a BCU is introduced to the diagram,it can be classified as an FSRQ candidate if it lies above the dividing line and as a BL Lac candidate if it lies below the dividing line.For the present 72 BCUs,47 BCUs are classified as FSRQ candidates and 25 BCUs as BL Lac candidates.
We compare classification results from the above two methods,namely the photon spectral index versus γ-ray luminosity(αph–Lγ) method usingαph=- 0.048 logLγ+4.498in Figure4,and the photon spectral index and variability index(αph–V.I.) method usinglogV.I.=-1 0.119αph+24.855in Figure5.
When we compare the FSRQs candidates obtained from the αph–Lγmethod(Figure4)and the αph–V.I.method(Figure5),we found 68 common classification,namely,46 FSRQ candidates and 21 BL Lac candidates.It is found that all 47 FSRQ but one(J0644.3-6713)candidates from αph–V.I.method are included in the 50 FSRQ candidates from αph–Lγmethod.For BL Lac candidates,22 but one(J0644.3-6713)sources obtained from the αph–Lγmethod are included in those from the αph–V.I.method.
There are also four sources (J2230.5-7817,J0017.2-0643,J1647.1-6438,and J1302.6+5748) classified as BL Lac candidates in the αph–V.I.method are classified as FSRQ candidates in the αph–Lγmethod.We still keep the four BCU sources and the BCU J0644.3-6713 as BCUs in this work.We can also found that the five sources have no known redshift.It is possible that the unknown redshift results in false classification.In this case,if only are 33 BCU with available redshift considered,then it is found that the two methods give very similar classification,only one source (J1302.6+5748),which is classified as a BL Lac candidate in αph–V.I.method but as an FSRQ candidate in αph–Lγ.So,for 33 BCUs with redshift,we have 23 FSRQ candidates and nine BL Lac candidates.
When we compared our results with that by Kang et al.(2019),it is found that there are 70 common sources(J0734.3-7709 and J1532.7-1319 were not in Kang et al.2019),out of them 61 sources in αph–V.I.method are the same classification as that by Kang et al.(2019) giving a 87.1% goodness of fit;and the 59 sources in the αph–Lγmethod are the same classification as that by Kang et al.(2019) giving a 84.3%goodness of fit as shown in Table2,which give our classification for the BCUs.
In Table2,Column information is as follows:Col.(1)4FGL name,Col.(2)classification based on αph–Lγmethod,Col.(3)classification based onV.I.–αphmethod,Col.(4)classification from the two methods,we choose the same classification from the two methods as a candidate,otherwise,we still take it as a BCU;Col.(5) classification in Kang et al.(2019),Col.(6)comparison between classification by αph–Lγmethod and that in Kang et al.(2019).If our classification is the same as that in Kang et al.(2019),then we use “Y,” otherwise,we use “N.”“NN” means that the source was not included in Kang et al.(2019),Col.(7)comparison between classification byV.I.–αphmethod and that in Kang et al.(2019).
From Table2,it is found that for the 70 common sources,we give classification for 65 sources and BCUs for five sources.For the 65 sources,our classifications for 58 sources are the same as that in Kang et al.(2019)giving a 89.3%goodness of fit.38 out of our 44 FSRQ candidates were also classified as FSRQs candidates in Kang et al.(2019) giving a 86.4%goodness of fit.19 out of our 21 BL Lac candidates were classified as BL Lac candidates in Kang et al.(2019) giving a 90.5% goodness of fit.So,our blazar (BL Lacs and FSRQs)candidate selection methods are available.We encourage colleagues who are interested in the classification to do spectroscopic observations from those sources to confirm the classifications.In addition,if we know the classification,then we can use the αph–Lγrelation to give a redshift lower limit for FSRQs candidates and an upper limit for BL Lac candidates.

Table 2Classification for the BCU Sources in this Work
4.3.The Correlation between γ-Ray Luminosity Variation and Spectral Index Variation
It is observed from Figure3that there is an anti-correlation between the γ-ray luminosity variation (ΔlogLγ) and the spectral index variation (Δαph),

for the whole sample.
When BL Lacs and FSRQs are considered separately,such an anti-correlation is also observed for BL Lacs and FSRQs.ΔlogLγ=-(1.386 ±0.037) Δαph+0.010 ±0.010withr=?0.71 andp~0 is found for FSRQs,andΔlogLγ=-(0.890 ± 0.032) Δαph+0.028 ± 0.005withr=?0.724 andp~0 for BL Lacs.The corresponding best fitting result for the whole sample is shown in Figure3.
In the γ-ray band,the flux density can be expressed asso,the luminosity can be expressed in the formIt is obtained thatwhich results in Δ logLγ=-AΔαph+B,here αph=αγ+1.The correlation suggests that when the source becomes brighter,then the spectrum becomes harder.It is common for blazars to show a blue spectrum when the sources become brighter(BWB) as discussed in the optical band (Fan &Lin2000;Gu et al.2006;Gupta et al.2008;Zheng et al.2008;Carnerero et al.2017)and in the X-ray band(Pian et al.1997).The BWB phenomenon could be explained in different ways (Gu et al.2006),including a two-component (one stable component and a variable one) model for blazar optical emission or the one synchrotron model that the intense energy release is produced by the higher particles(Fiorucci et al.2004).Some researchers suggested that the fresh electrons injection,with a harder energy distribution than the cooled one,should explain the BWB phenomenon (Kirk et al.1998;Mastichiadis &Kirk2002),etc.However,these models would have to involve more parameters in the blazar emission model and those models may not be able to explain the BWB phenomenon in the entire wavelength band,e.g.,optical,X-ray,and γ-ray bands.We suggest that the Doppler beaming effect could be one of the main reasons for raising the BWB phenomenon,andthe γ-ray band brightness and spectra change due to a variety of Doppler factors (δ),this idea was also suggested by Villata et al.(2004) to explain the optical BWB phenomenon.The blazar emission is dominated by the relativistic jet,which is strongly beamed due to a Doppler beaming effect.The luminosity becomes brighter and the spectrum becomes harder at the γ-ray band when the Doppler factor becomes greater.This is because an increase of δ can enlarge the IC peak frequency as well as its intensity (Albert et al.2007,see Figure 21).
5.Conclusions
In this work,851 common blazars withV.I.>18.48 are compiled from the 3FGL and 4FGL catalogs to investigate the variability properties for the whole sample,and the two subclasses(BL Lacs and FSRQs).We also investigate mutual correlations for some parameters,it is found that the mutual correlations for bothαphversus logLγandαphversus logV.I.in FSRQs are different from those in BL Lacs,which are used to select FSRQs and BL Lacs from BCUs.Our analysis conclusions are as follows:
1.The luminosity,spectral index,and variability index of FSRQs are higher than those of BL Lacs for the whole sample.
2.The γ-ray spectral index is closely correlated with redshift suggesting the more distant sources have softer spectra.
3.It is found that the change of spectral indices is closely anticorrelated with the change of the luminosity implying that the spectrum become harder when the source becomes brighter in the γ-ray band.
4.A positive correlation is found between γ-ray luminosity and the photon spectral index for the whole sample,but an anti-correlation is found for FSRQs and a marginal anti-correlation for BL Lacs.In addition,a positive correlation is found between variability index (logV.I.)and the γ-ray photon spectrum index (αph) for the whole sample,but an anti-correlation for FSRQs and a positive correlation for BL Lacs.We think those two positive correlations for the whole sample are apparent.
5.We adopted the SVM machine learning method to divide BL Lacs and FSRQs in theαphversus logLγand αphversusV.I.plots and proposed that we can select an FSRQ candidate from BCUs if a source satisfieslogV.I.>-1 0.119α+24.855,orαph>-0 .048 logLγ+4.498 and select a BL Lac candidate from BCUs if a source satisfieslogV.I. <-1 0.119α+24.855orαph<-0.048 logLγ+4.498.Our selection results are quite consistent with those by Kang et al.(2019).
Acknowledgments
The work is partially supported by the National Natural Science Foundation of China (NSFC U2031201,11733001,U2031112,12133004 and 12103012),Guangdong Major Project of Basic and Applied Basic Research (Grant No.2019B030302001).We also acknowledge the science research grants from the China Manned Space Project with NO.CMSCSST-2021-A06,and the supports for Astrophysics Key Subjects of Guangdong Province and Guangzhou City.The work is also supported by Guangzhou University(YM2020001).
ORCID iDs
 Research in Astronomy and Astrophysics2022年8期
- Research in Astronomy and Astrophysics的其它文章
- A Baseline Correction Algorithm for FAST
- Ultra-wide Bandwidth Observations of 19 Pulsars with Parkes Telescope
- HI Vertical Structure of Nearby Edge-on Galaxies from CHANG-ES
- Analyzing Dominant 13.5 and 27day Periods of Solar Terrestrial Interaction:A New Insight into Solar Cycle Activities
- Identifying Outliers in Astronomical Images with Unsupervised Machine Learning
- Irregular Spatial Distributions of Spectral Line Parameters in the Middle Solar Chromosphere Revealed from Analysis of Solar Flash MgI b2 Spectra
