Active flow control of S-duct by plasma synthetic jet
Ru-bing LIU ,Xiao-yin MEI ,Sheng-huiXUE ,Yu-wen LU ,Zhe-zhe SU ,QiLIN
1School of Aerospace Engineering,Xiamen University,Xiamen 361102,China
2Fujian Key Laboratory of Plasma and Magnetic Resonance Research,Xiamen 361102,China
Abstract: Flow separation and secondary flow in the S-duct of an aircraft engine cause severe pressure loss and airflow distortion at the outlet,lowering engine performance.Herein,a serial two-electrode plasma synthetic jet (PSJ) actuator array is used to actively control the flow field in the duct and improve its characteristics.The results show that the PSJ significantly increases the wall pressure recovery coefficient,suppresses flow separation,and improves the outlet pressure distortion.The primary and secondary orders of the influencing factors are as follows: control position>jet momentum coefficient>excitation frequency>jet configuration.The best jet control position is near the separation location,and the best jet configuration is the ‘Λ’ configuration.The higher the jet momentum coefficient and excitation frequency,the better the flow control.The wall pressure coefficientincreases by up to 127.8%,and the outlet steady pressure distortion index decreases by 9.15%.The control mechanism is the direct energy injection into the flow boundary layer through a high-speed jet and the indirect control effect of the induced streamwise vortex.On the one hand,the PSJ suppresses flow separation by improving the ability of the boundary layer to resist the inverse pressure gradient.On the other hand,it reduces pressure distortion by decreasing the intensity of the secondary flow and weakening the backflow.This study thus provides a new technology for the active control of the flow-field characteristics in an S-duct and has significance for guiding the application of synthetic jet technology in S-ducts.
Key words: S-duct;Flow control;Plasma synthetic jet(PSJ);Flow separation;Pressure distortion
1 Introduction
The S-duct,a type of intake duct,improves the operating cost and fuel efficiency and reduces the noise and radar stealth characteristics of modern aircraft engines.S-ducts have been used as intakes for several commercial and military airplanes (engines),such as the Boeing 727 (P&W JT8D),Lockheed Tristar L-1011 (RR-RB211),General Dynamics F-16 (P&W F100),and McDonell-Douglas F-18 (GE F404),with the engine buried in the fuselage.In particular,it is anintegral component in the design of modern combat aircraft because it blocks radar signals (Wojewodka et al.,2018).However,the geometry of the duct causes flow separation and lateral secondary flow at the curves.The former is primarily caused by the large reverse pressure gradient in the expansion of the S-shaped pipe along the flow direction.Further,it is difficult for the airflow to stay attached to the curved pipe wall.When the airflow passes through the two bends of the S-duct in different directions,under the action of centrifugal force,the high-and low-pressure areas of the bends are distributed in opposite directions,producing a lateral reverse pressure gradient in the circumferential direction (Chen and Wang,2012).Thus,the lateral secondary flow is separated.Under the combined effect of flow separation and secondary flow,a unique vortex structure is produced at the exit of the duct that causes severe pressure loss and airflow distortion at the outlet.This significantly degrades the engine performance.
To improve the flow-field characteristics of the S-duct,engineers suppress flow separation in the duct using active and passive flow-control technologies(Wojewodka et al.,2018).A common passive control technology is the vortex generator (Wojewodka et al.,2018).Principally,it generates a streamwise vortex,increasing the mixing of the outer high-and low-energy fluids in the boundary layer (BL) and improving the ability of the BL to resist the reverse pressure gradi-ent.Thus,the boundary-layer separation is delayed(Chen and Wang,2012;Liet al.,2012).However,the parameters of the generator cannot be adapted to the working conditions and therefore it has a limited control effect.Active control technology overcomes this limitation as it facilitates tuning the control parameters,providing an alternative for improving the performance of the duct(Wojewodka et al.,2018).A few examples of this technology include surface layer suction (Lin and Guo,1989)or blowing(Ball,1985;Debiasiet al.,2008;Sahniet al.,2009;Harrison et al.,2013),microjets (Delot et al.,2011;Huang et al.,2013),constant blowing/inhalation (Ng et al.,2011;Vaccaro et al.,2015),unsteady air blowing (Garnier et al.,2012),jet vortex generators (Ng et al.,2011),oscillating jets(Meng et al.,2016),and adjustable guide vanes(Weng and Guo,1992).All these can control flow separationin the S-duct and suppress flow distortion.However,these devices require high-pressure gas sources or vacuum pumps,pipelines,and other components,which add weight to the aircraft and reduce its fuel efficiency.Therefore,they have limited practical applications.
In contrast,the synthetic jet does not require aux-iliary air-supply systems to function.This makes the device producing the jet simple and compact,and it is lightweight,inexpensive,and maintainable.It has broad application prospects in the field of flow control(Mathis et al.,2008;Chen and Wang,2012;Liet al.,2012;Pan,2014;He and Dong,2015).Therefore,some scholars used synthetic jet technology for flow separation control of S-shaped inlets innovatively.Amitay et al.(2002) and Jenkins et al.(2002) used synthetic jets to control the flow separation in the S-duct earlier.In their research on piezoelectric synthetic jets,Jenkins et al.(2002) suggested that the jet velocity must be sufficiently high to allow the effective control of flow separation.Amitay et al.(2002)placed a piezoelectric synthetic jet array in the separation area of a duct diffuser along the flow direction,which precisely controlled flow separation.The flow could be completely reattached at a Mach number of less than 0.2,and partially at 0.2-0.3.Mathis et al.(2008) showed that a synthetic jet array arranged at the point of separation can precisely control the 2D duct-separation bubble.Liet al.(2012) placed a microphone-powered synthetic jet in front of the separation point,which inhibited flow separation andincreased the total pressure recovery coefficient by 0.37%.Pan(2014)installed a piston-type synthetic jetin front of the separation point and found that a higher jet velocity improved the control effect,especially with the Λ-shaped outlet.Additionally,several numer-ical simulations have been conducted.Chen and Wang(2012) found that the jet had a better flow-control effect in the midpoint of the span direction.He and Dong (2015) controlled the flow more efficiently by arranging jet slits along the flow direction.Gissen et al.(2014) deployed hybrid actuators comprising tandem configurations of vanes and synthetic jets to control the separated flow in the boundary layer interactioninlet;they were able to reduce the overall distortion by 35%at the designed flow condition.
In summary,the current synthetic jet excitation methods are piezoelectric,microphone-induced,and piston-based.However,these methods have low exci-tation intensity and frequency,and consequently low jet energy and working frequency.The flow can be controlled at various points along the duct,including before the separation point,near the separation point,and in the separation area.However,the optimal posi-tion control has not been identified,control parameters have been studied independently,and key parameters are unknown.Most researchers measured the total pressure distortion and static pressure changes along the flow path.However,the mechanism of the synthetic jet influence on the flow structure along the path and at the outlet has not been explained.These challenges have hindered the application of synthetic jets to the flow separation control of an S-duct in actual aircraft.
To increase the energy and working frequency of the synthetic jet and enhance flow control,researchers have used the high-temperature plasma generated by gas spark discharge as the aerodynamic excitation source.Thus,the plasma synthetic jet (PSJ) was invented.Grossman et al.(2003) first proposed a PSJ actuator for flow control.Because it has an instantaneous speed above 100 m/s,the PSJ can help control the flow at high flow velocities and has gained research interest worldwide (Sary et al.,2014;Zong et al.,2018;Shin et al.,2021;Zhou et al.,2022).
Fig.1 illustrates the structure and operation cycle of the PSJ actuator(Cybyk et al.,2006).The actuator is composed of an insulated closed cavity with an ejection orifice,a cathode,and an anode.The operation cycle is divided into three stages:energy deposi-tion,jet ejection,and recovery.Spark discharge generates a large amount of heat,increasing the temperature of the air in the cavity and causing it to expand abruptly.The air is ejected from the orifice to form a jet;subsequently,the ambient air is refilled to prepare for the next discharge.
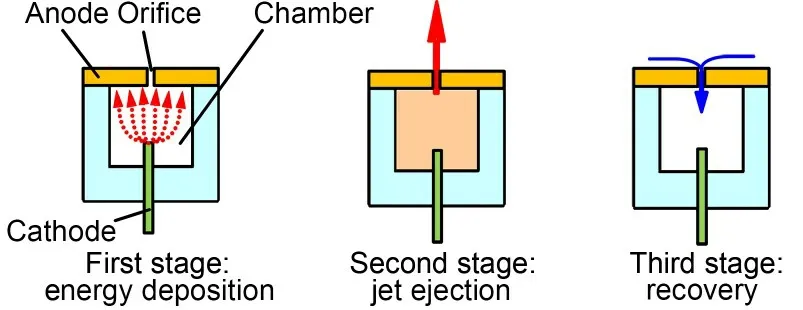
Fig.1 Structure and operation cycle of a plasma synthetic jet(PSJ)actuator
Research has demonstrated the engineering application of PSJs in low subsonic(Chedevergne et al.,2015;Liu et al.,2015;Sun et al.,2019)and supersonic(Emerick et al.,2014;Tang et al.,2018;Wang et al.,2018;Wang and Shen,2019;Zhou et al.,2019) wind tunnels.The application objects included wings (Liu et al.,2015),nozzles (Chedevergne et al.,2015),fly-ing wings (Sun et al.,2019),flat plates (Emerick et al.,2014;Wang et al.,2018),diagonal splits (Tang et al.,2018;Zhou et al.,2018;Jiang et al.,2020),bluff bodies (Tang et al.,2018),and transport aircraft rear bodies (Gu et al.,2018).However,few reports have been published on its application to the flow-field control of S-ducts.
Therefore,this study proposes the use of PSJ actuators to suppress flow separation and reduce the pressure distortion of an S-duct.The influences of jet control position,jet configuration,jet momentum coefficient,and excitation frequency on the flow control effect were systematically explored,and an orthogonal method was used to determine the primary and secondary orders of those influence parameters.Parti-cle image velocimetry (PIV) was used to measure the streamwise flow field and that at the outlet crosssection of the duct,revealing the flow control mechanism of the PSJ.
2 Experimental setup
An S-duct for wind tunnel testing was designed based on the available design data of S-duct models and the present experimental requirements.Other experimental equipment includes a pressure scanning valve,a PIV,a high-voltage pulse power supply,and a high-speed Schlieren system.
2.1 S-duct test section and wind tunnel
The S-duct wind tunnel test apparatus mainly included a low-speed blow-down wind tunnel,an S-duct,an outlet pressure measurement section,and a diffusion section (Fig.2).The wind tunnel had a contraction section exit of 200 mm×200 mm and a contraction ratio of 20.25 (Fig.2b).It had a maximum wind speed of 45 m/s and a turbulence degree of less than 0.5%.The experimental wind speed was 25 m/s,and the Reynolds numberReDbased on the inlet crosssection sizeD(200 mm)was 3.55×10⁵,which is close to that used in the literature (Amitay et al.,2002;Chen and Wang,2012;Liet al.,2012;Pan,2014;He and Dong,2015).
The RAE2129 intake profile (Anderson and Gibb,1992) was used for the S-duct (Fig.2a).The profile had an overall lengthLof 600 mm,an inletto-outlet offset ΔZof 367 mm,and a flow turning angle of 37°.The inlet and outlet dimensions were 200 mm×200 mm(D)and 236.6 mm×236.6 mm(D0),respectively.
The S-duct model included the main structure and a mounting plate (Fig.2b).The main structure was composed of the four walls of the duct,which were machined from transparent acrylic material for easy PIV flow field measurement.The mounting plate was used to fix the actuator discharge cavity and to be an actuator plate.Square channels for installing the actuator were machined at equal intervals on both sides of the plate.Four pairs of jet orifices were openedin each channel,and the diameters of each pair were 1.0 mm and 1.5 mm,respectively(Fig.2c).The mount-ing plate was attached to the near-side wall(x/L=0.033-0.400) (Fig.2b),where the flow separation region was in the S-duct(Wojewodka et al.,2018).The mounting plate material is a high-temperature-resistant polyphenylene sulfide (PPS) engineering plastic to prevent high-temperature dissolution during discharge.

Fig.2 S-duct test setup (unit: mm): (a) general dimensions of the S-duct;(b) S-duct model for the wind tunnel test;(c)orifice position on the mounting plate;(d)photograph of the S-duct test setup
2.2 Plasma synthetic jet system
The PSJ actuator included a discharge cavity,discharge electrode,and cover plate (Fig.3).The discharge cavity was rectangular and machined from an alumina ceramic,with electrode orifices on the lower wall of the cavity.The discharge electrode was made of a galvanized silicone copper wire which was inserted inside the cavity through the electrode orifice.The cover plate is mainly used for the actuator flowfield measurement and was machined from the alumi-na ceramic,with the same thickness as the mounting plate.The cover plate and the cavity were sealed with silicone.The structural parameters of the actuator are listed in Table S1 in the electronic supplementary materials(ESM).
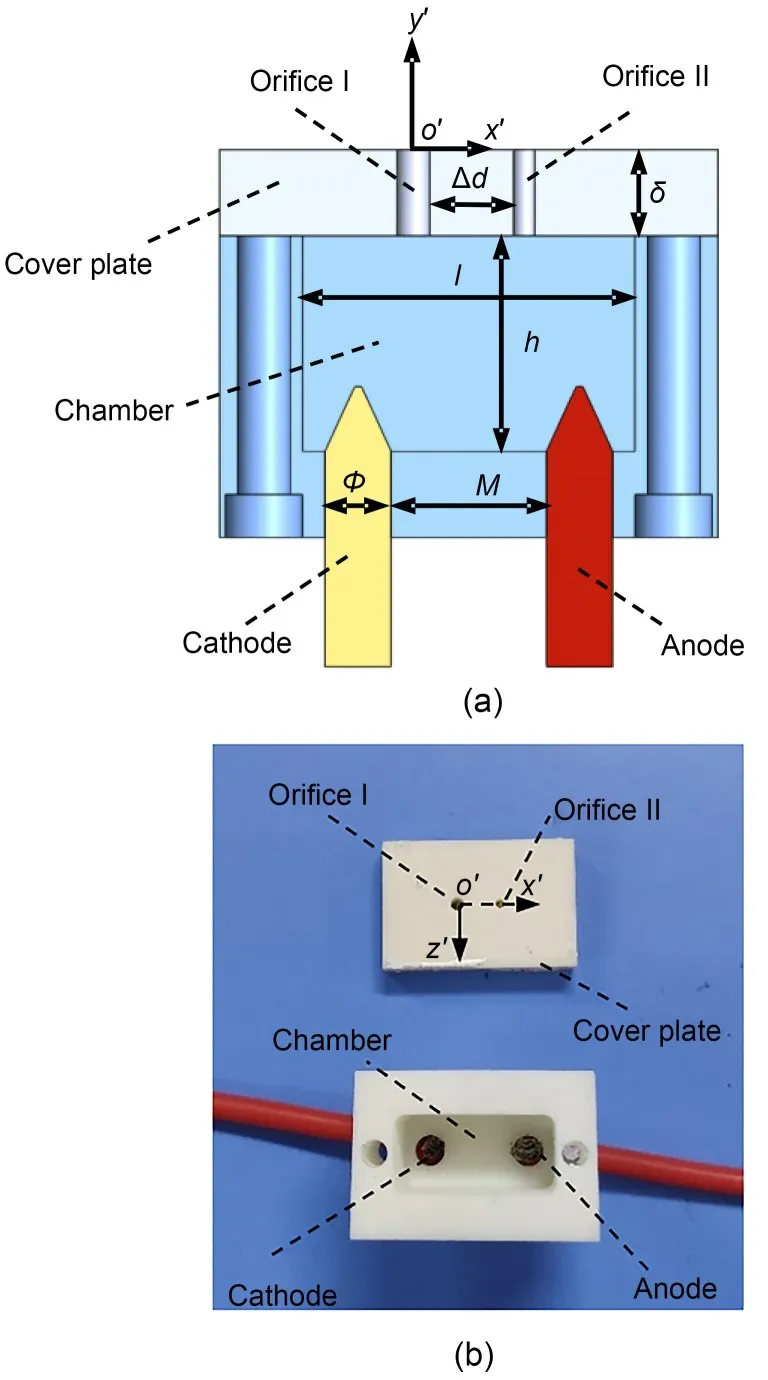
Fig.3 PSJ actuator: (a) structural diagram;(b) image. h is the cavity height,l is the cavity length,δ is the thickness of cover plate,Δd is the distance between orifices I and II,Φ is the diameter of electrode,and M is the distance between cathode and anode
A self-developed four-channel high-voltage pulse power supply(model:XMU-PTLA-DY-02)was used.The discharge frequency and duty cycle of the supply were modulated using a computer program,with an output voltage(V)of 0-40 kV,a duty cycle(τ)of 5%-50%,and a frequencyfof 20-5000 Hz for each channel.The serial discharge form proposed by Zong and Kotsonis (2017b) and Zhou et al.(2018) was used.Four channels (CH1-CH4) excited eight actuators si-multaneously with a single channel connected in series with two PSJ actuators(Fig.4)to achieve a largescale flow control in the duct.To measure the actuator discharge characteristics,the total voltage(P1)and intermediate electrode voltage(P2)were measured using two Tektronix P6015A high-voltage probes (bandwidth of direct current (DC) to 75 MHz,peak input voltage of 40 kV,and rise time of 4 ns).The discharge current(P3)was measured using a Tektronix TCP0150 current probe (bandwidth of DC to 20 MHz,selectable range control for 25-and 150-A measurement ranges,and a rise time of ≤17.5 ns).The probe signals were collected simultaneously using a Tektronix oscilloscope TBS2014 (four analog channels,bandwidth of 100 MHz,and sampling rate of 2×10⁹sample/s)(Fig.4).
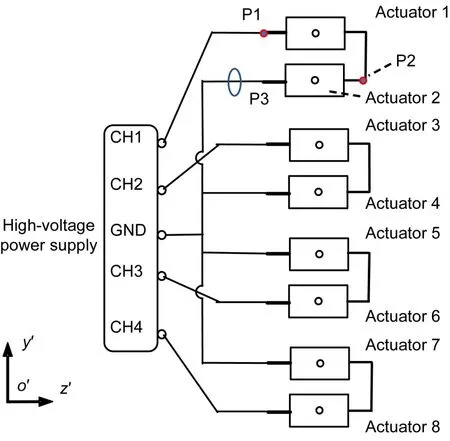
Fig.4 Power supply.P1 and P2 indicate the measurement stations of the discharge voltage on Actuators 1 and 2,respectively.P3 indicates the measurement station of the discharge current.GND is the ground of power supply
2.3 Pressure measurement
The pressure measured in the experiment includes the wall pressure distribution at the near-and far-side walls and the total pressure distribution at the outlet.To measure the wall pressure distributionCp,a row of 29 pressure taps was located at mid height of the nearand far-side walls(Fig.2).The total pressure distribution lossand steady distortion indexwere measured using a pressure rake(Fig.S1 in the ESM).The pressure rake consisted of 16 pressure probes with a 13.9-mm spacing.It reciprocated 8 mm 27 times from left to right to complete the measurement of the total pressure distribution.All pressure signals were collected by a PSI 9116 pressure scanning valve (with a range of 0-34.473 kPa and an accuracy of ±0.05%),with a sampling frequency of 50 Hz and a sampling time of 15 s.The definitions ofCp,,andare given in the ESM.
2.4 Flow-field measurements
To investigate the PSJ control mechanism on the flow characteristics of the duct,we used a 2D PIV(China Beijing MicroVec Ltd.SM3-4M200) to measure the streamwise flow field and that at the outlet cross section.The PIV camera had a resolution of 2048×2048 pixels and a maximum acquisition frame rate of 20 frames per second(frame/s).The PIV system used a Nd:YAG double-pulse laser with a wavelength of 532 nm,an energy of up to 200 mJ,and a repeti-tion frequency of 1-15 Hz.Tracer particles were generated by heating glycerol using a Svnscomg smoke generator.The measurement error provided by the PIV system suppliers is less than 1%,which is less than the measurement error under the experimental conditions in this study.With the PIV parameters and flow field measurement results in this experiment,the measurement error of the velocity measurement was less than 8%.Fig.5a illustrates the flow-field measurement scheme applied at the upstream curved section.The laser sheet was placed 50 mm above the mid height of the side wall to avoid the influence of pressure taps.The camera was placed below the duct model to capture the flow field.Fig.5b shows the flow-field measurement scheme applied at the outlet section.The laser sheet was 50 mm away from the outlet of the duct,the same position as the total pressure rake measurement.The camera was placed at the outlet.
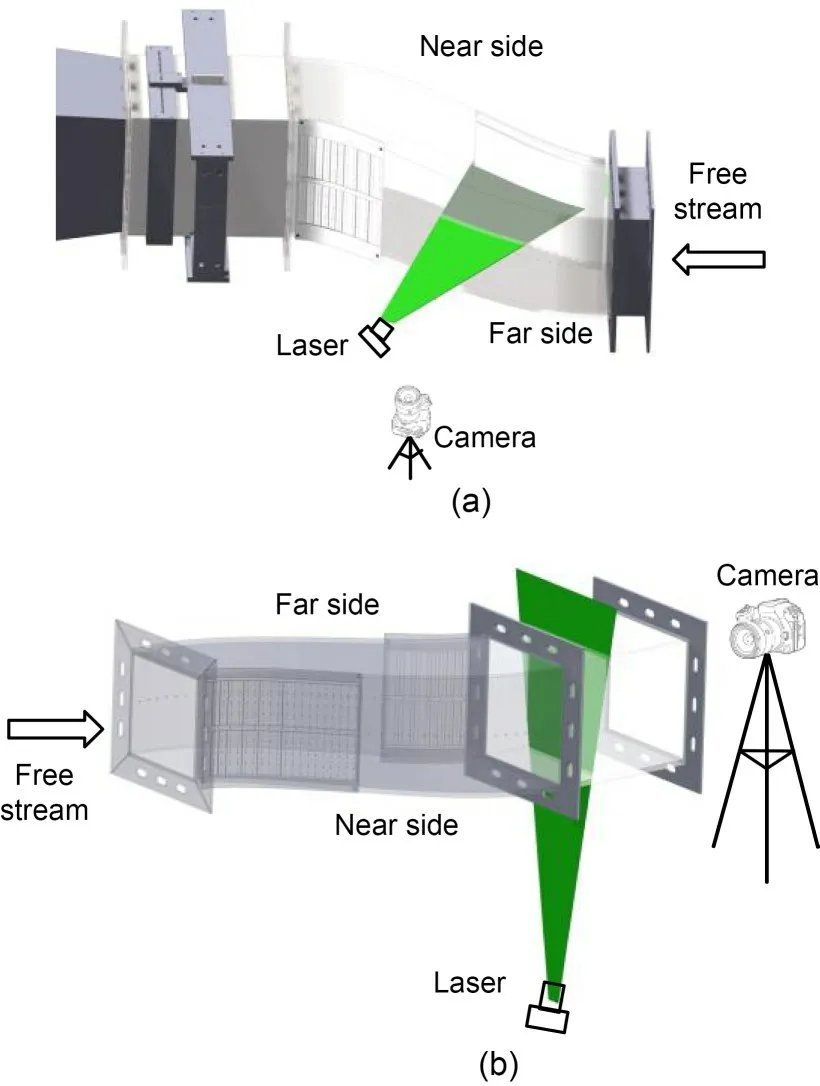
Fig.5 Layout diagram of the PIV flow field test: (a) flow field along the flow direction;(b) flow field at the duct exit plane
2.5 High-speed Schlieren system
The flow field of the PSJ actuator was measured using a high-speed Schlieren system,as described in(Liu et al.,2021).A PHOTRON SA-Z high-speed camera (Japan Photron Ltd.) was set with a frame rate of 100000 frame/s,an exposure time of 159 ns,and animage resolution of 640×280 pixels.The image had a spatial resolution of 0.17 mm/pixel and a minimumimage resolution of 0.5 pixels.The time interval between two images was 10 μs.Therefore,the measurement error of the PSJ front movement speed was±8.5 m/s,which corresponds to a 0.5-pixel distance(0.085 mm)divided by 10 μs.
3 Results and discussion
3.1 S-duct flow-field control by plasma synthetic jet
To investigate the flow control effect of the PSJ on the S-duct flow field,this study systematically stud-ied the effects of the jet control position,jet configuration,jet momentum,and excitation frequency on flow control.The discharge and flow-field characteristics of the PSJ actuator are discussed in the ESM.
3.1.1 Jet control position
The jet control position is crucial to the PSJ application in the S-duct.Three jet control positions are discussed in the literature,one before the separation point(Liet al.,2012;Pan,2014),one near the separation point (Mathis et al.,2008;He and Dong,2015),and one in the separation region(Amitay et al.,2002).However,the best control position has not been determined.Therefore,the influence of the above positions on the flow-field control effect are first discussed in this section.
3.1.1.1 Flow separation point location determination
To determine the three jet control positions,we first require an accurate separation point location.This location was determined by measuring the wall pressure distributions of the near-side wall and the streamwise flow field at the curved section.
The pressure coefficientCpdistributions of the near-and far-side walls exhibit a typical S-shaped bending pipe flow characteristic (Fig.6).According to theCpdistribution of the near-side wall,the separation point was located nearx/L≈0.27.At the near-side wall,the airflow entering the first bend was affected by the centrifugal force.The wall pressure declined rapidly,andCpreached its lowest value atA(x/L≈0.067).With the gradual expansion of the S-duct and under the influence of the radial pressure gradient,the wall pressure gradually recovered,andCpcontinued to increase.AtB(x/L≈0.27),the recovery of the wall pressure was hindered,and a pressure recovery inflection region appeared.This indicated flow separation.With the flow downstream,the near-side wallCpcontinued to recover during the expansion of the duct.At the far-side wall,Cpincreased as the flow was blocked by the near-side-wall S-bend,and the peak was reached atC(x/L≈0.23).Subsequently,because of the change in the radial pressure gradient due to the streamwise expansion of the duct,Cpcontinued to decrease.UntilD(x/L≈0.93),the wall pressure increased owing to the gradual recovery of the curvature.
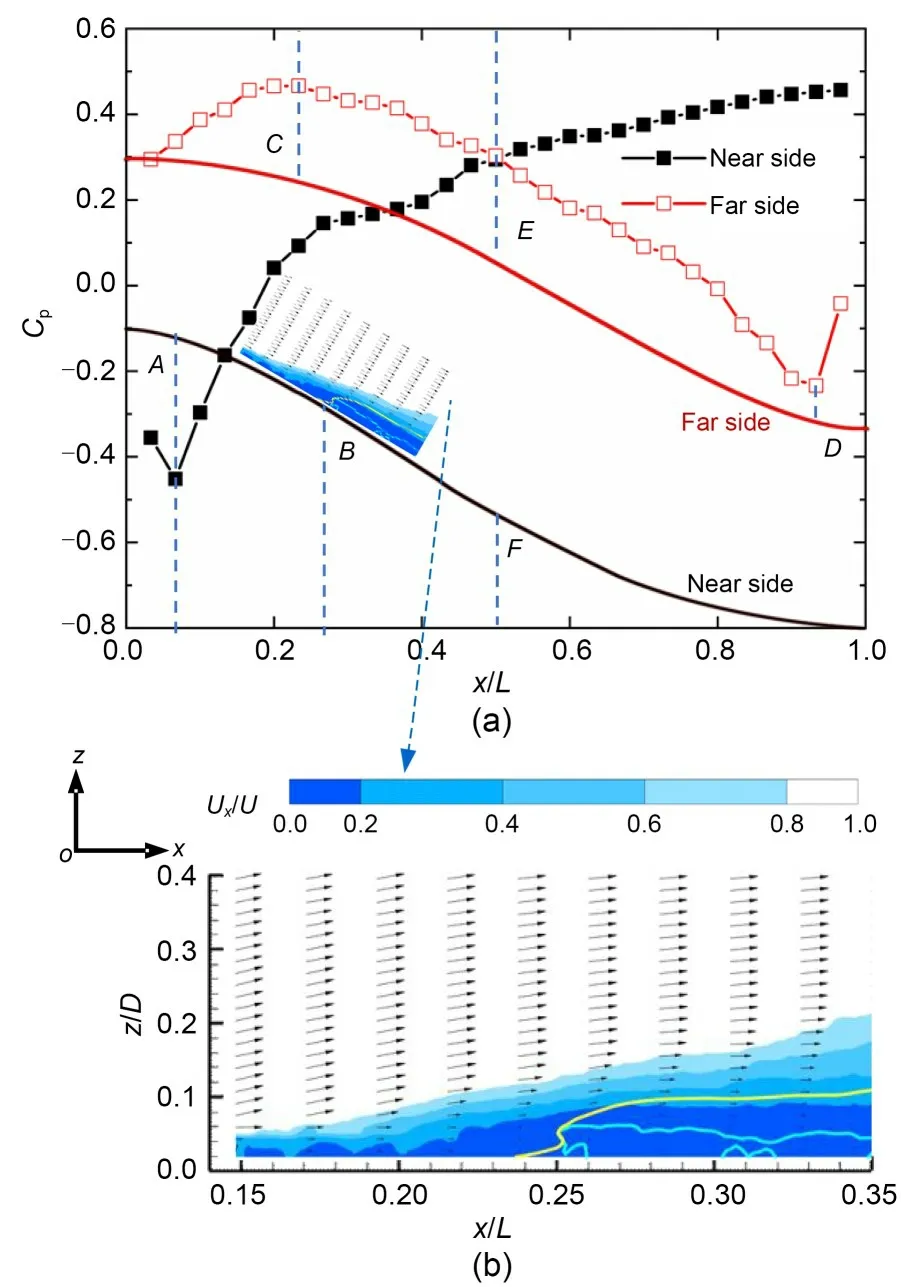
Fig.6 Pressure distribution(a)and flow regime(b)on the symmetry plane.The lateral component of the in-plane velocity U(denoted as Ux)is shown as contours.Black line:near-side wall duct shape;red line: far-side wall duct shape;black arrows: velocity profiles at selected streamwise locations;yellow solid line: dividing streamline;blue lines: contours of Ux=0 m/s (hereinafter referred to as zero-velocity lines).References to color refer to the online version of this figure
Comparing the near-and far-sideCpcurves(Fig.6),when airflow entered the duct,Cpreached a minimum value atAon the near-side wall (x/L≈0.067)and a maximum value atCon the far-side wall (x/L≈0.27).This is becauseAandCcorrespond to the nearand far-side walls,respectively,where the maximum curvature values occur.This region is largely affected by the centrifugal force.The curvature decreased subsequently.TheCpcurves of the near-and far-side walls have contrasting distribution trends.After the air flow moved to theE-Fsection,it gradually entered the second bend,and the near-side wall pressure,influenced by the centrifugal force,continued to rise and formed a strong reverse pressure gradient.The wall pressure distribution is similar to that reported in the literature(Ng et al.,2011;Liet al.,2012;Pan,2014;He and Dong,2015;Ning et al.,2017).
To confirm the flow separation locations,the streamwise flow field (Fig.6b) at the near-side wall(x/L=0.13-0.37)was measured via PIV(Fig.5a).The S-duct had a distinct low-velocity region at the nearside wall.Flow separation began fromx/L≈0.24 to theinlet.The flow separation point was nearx/L≈0.24 and matched the position (x/L≈0.27) in Fig.6a.This result was used as the basis for exploring the effect of the PSJ control position on the S-duct flow-field characteristics.
3.1.1.2 Flow control position of the PSJ
According to the flow separation location determined in the previous section,the control position of the PSJ actuators at the near-side wall is upstream of the separation location (x/L=0.03-0.14),near the separation location (x/L=0.20-0.30),and downstream of it (x/L=0.30-0.40) (Fig.7).Previous results showed that it is better to apply a 3D synthetic jet in an S-duct (Chen and Wang,2012).Therefore,we arranged eight PSJ actuators in the middle span of three determined streamwise positions (Pan,2014) and explored the effects of PSJs on the wall pressure recovery coefficientCp(Eq.(S1))and the steady distortion index(Eq.(S3)).The relative change of(%)is defined as(%).To achieve a better flow control effect,we chose a jet of 1-mm-diameter ori-fice,which has the highest jet speed(Table S2).
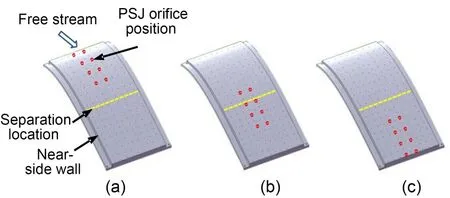
Fig.7 PSJ actuator control position diagram: (a) upstream of the separation location (x/L=0.03-0.14);(b) near the separation location (x/L=0.20-0.30);(c) downstream of the separation location(x/L=0.30-0.40)
The PSJ actuator,arranged in the three positions shown in Fig.7,can improve theCp(Fig.8) of the near-side wall and reduce(Table 1).The layout near the separation location had the best control effect withCpincreased by up to 68.8%(x/L=0.33).Even at the exit (x/L=0.97),Cpstill shows an increase of 18.6%.is reduced by up to 6.44%by jets near the separation location.The control effect of the jet arranged at the other two locations is less than that of the jet near the separation location.

Table 1 Steady distortion index at different PSJ control positions
Table 2 Steady pressure distortion index for different jet configurations

Table 2 Steady pressure distortion index for different jet configurations
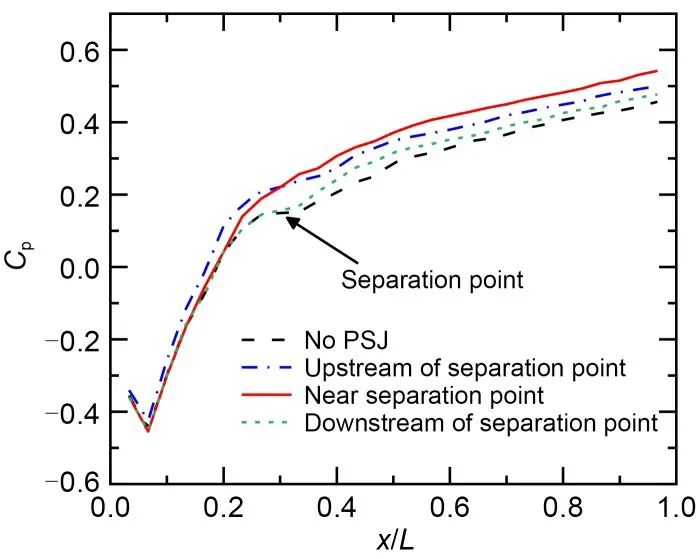
Fig.8 Surface pressure distributions on the near-side wall of the S-duct test section for different flow control positions
Notably,the jets at the three control positions had a significantly different effect onCp.The jets placed upstream of the separation location increasedCpfrom that position,but a small amount of flow still separated.As the flow developed toward the exit,theimprovement ofCpbecame weaker than that with jets placed near the separation location.This is because the jet energy was prematurely injected into the mainstream and the effective range was limited.Installing the jets near the separation location can suppress flow separation,eliminating the inflection region ofCpdistribution.As the flow develops toward the outlet,Cpstill maintains a considerable growth rate.Meanwhile,the jets installed downstream of the separation location were in the low-speed region of flow separation and have the weakest control effect.Therefore,arrang-ing the jets near the separation location is the most di-rect and effective method for injecting energy into the BL.This control position leverages the limited jet energy and plays the role that “a small amount of force can control the flow effectively”of active flow control.This is consistent with the control effect of steady blowing obtained in a previous study (Delot et al.,2011).The detailed control mechanism is discussed in Section 3.2.2.
3.1.2 Jet configuration
In addition to the streamwise jet control position,the spanwise jet configuration must be considered.Because the flow in the duct has a significant 3D characteristic,different jet configurations produce different control effects.In the previous section,we determined that the jet has the most efficient control over the flow near the separation location on the near-side wall.This section explores the effect of jet configuration on flow separation control near the separation location(x/L=0.20-0.30).
According to numerical simulations in the literature (Chen and Wang,2012;He and Dong,2015),flow control was better at intermediate positions than at the ends,and the streamwise jet slot had a better control effect than that in the spanwise.Combining these two layout methods,we designed a ‘Λ’ jet configuration (Fig.9).The control effects of these three jet configurations are discussed next.
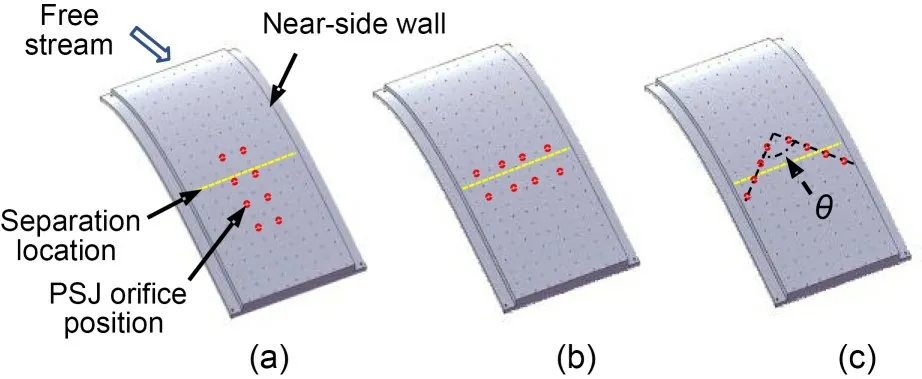
Fig.9 PSJ actuator configurations and jet schematic diagrams: (a) streamwise configuration;(b) spanwise configuration;(c)‘Λ’configuration
The PSJ of the three jet configurations canimprove the wall pressure recovery coefficientCp(Fig.10) of the near-side-wall surface and reduce the steady pressure distortion index(Table 2).In particular,the jet control effect of the ‘Λ’ configurationis the most significant.Cpincreased to 101.8% (x/L=0.33) and maintained an improvement of 24.5% even at the outlet (x/L=0.97).decreased by 7.19%.The jet control effect of the spanwise and streamwise configurations was the second.Compared with the streamwise one,the spanwise configuration jets perform better when they are in the middle of the duct.This is consistent with the numerical results from Chen and Wang (2012).When the PSJs were arranged streamwise,the wall pressure distribution was relatively uniform.The jets of the ‘Λ’ configuration integrate the control advantages of the spanwise and streamwise configurations,yielding the best control effect.This control effect is similar to that of the synthetic jet with an Λ-shaped outlet in a previous study (Pan,2014).The streamwise vortex generated by such a jet configuration had a stronger control effect than the other configurations.
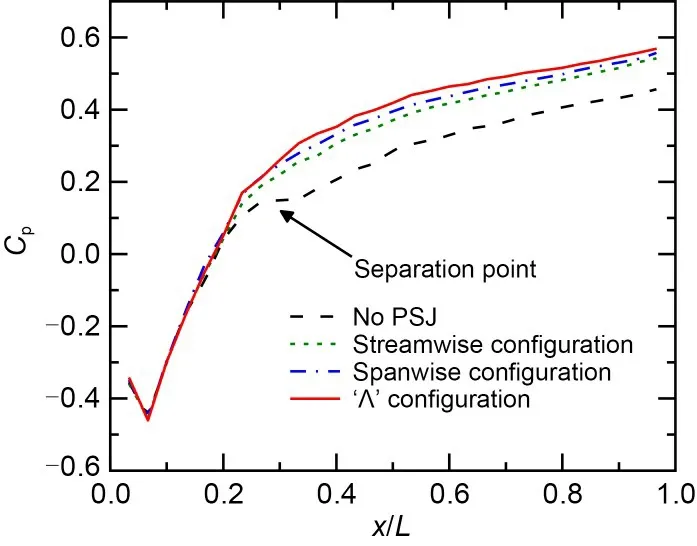
Fig.10 Surface pressure distributions on the near-sidewall of the S-duct for different jet configurations
The control effect (Fig.10 and Table 2) varies according to the angleθbetween the two branches of the ‘Λ’ configuration (Fig.9c).Asθapproaches 0°,control approaches that of the streamwise configuration;likewise,asθapproaches 180°,it approaches that of the spanwise configuration.An angle of approximately 100°provided the best results in our test-ing,although further research is needed to find the angle which provides optimal control.
3.1.3 Jet momentum
The momentum of the PSJ critically affects the flow control effect (Liet al.,2012;Pan,2014).Because the best control position and form of the actuators have been obtained,the effect of the jet momentum can be explored.According to the discussion in Section S2.2 of the ESM,jets with different orifices produce different speeds.The jet momentum was adjusted by varying the orifice sets with constant load-ing electrical parameters.
The PSJ actuator can improve the pressure recovery coefficientCp(Fig.11) and reduce the steady pressure distortionat the outlet(Table 3)under all jet orifice sets.In particular,when the double jet ori-fices were opened simultaneously,the wall pressure recovered most.The maximum increase in recovery was 127.8%(x/L=0.33),even though the last measurement point (x/L=0.97) ofCpincreased by 29.7%,anddecreased by 9.15%.Notably,the improvementsinCpandwere negatively correlated with the jet average speed (Table S2).This is because changing the jet orifices of the actuator not only changes the jet speed but also the jet flow rate.The energy of the PSJ should be characterized by a dimensionless parameter: the jet momentum coefficientCμ(He and Dong,2015).The calculation results showed that the larger the jet orifice is,the smaller is the average speed of the jet;however,the jet momentum coefficient increases(Table 3).This indicates that the control scope of the PSJ is enlarged with an increase in the orifice dimensions and the jet gains more energy.Therefore,opening the double jet orifices had the best flow control effect.This result is similar to those obtained by Ng et al.(2011)using steady jets.
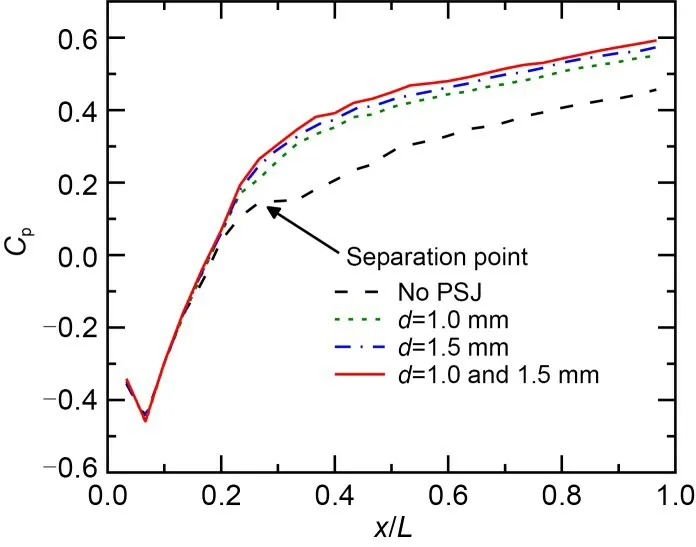
Fig.11 Surface pressure distributions on the near-side wall of the S-duct test section for different PSJ orifices. d is the jet orifice diameter
Table 3 Steady pressure distortion index Δ under different sets of jet orifices

Table 3 Steady pressure distortion index Δ under different sets of jet orifices
3.1.4 Excitation frequency
The excitation frequency of the jet is also an important factor that affects the flow control effect(Garnier et al.,2012;Harrison et al.,2013;Vaccaro et al.,2015).Utilizing these optimal parameter states (layout near the separation location,‘Λ’ configuration,and double jet orifices),the flow-field control effects of PSJs with different excitation frequenciesf(100-250 Hz)were explored.
The excitation frequency affects the total energy efficiency of the PSJ.The discharge powerPdof the PSJ under different excitation frequenciesfwas measured according to the measurement method of the total energy efficiencyηof the PSJ reported by Liu et al.(2021),andηwas calculated(Table 4).The results show that with the increase of excitation frequencyf(100-250 Hz),the discharge powerPdgradually decreases,and the total energy efficiencyηgradually increases.The total energy efficiency is close to the result obtained by Zong and Kotsonis(2018),but with the opposite relationship betweenηandf: Zong and Kotsonis (2018) reported that the total efficiency of the jet decreases gradually with theincrease of excitation frequency (50-200 Hz).The main reason for this difference is that Zong and Kotsonis (2018) employed capacitive discharge,whereas this experiment involved inductive discharge.For inductive discharge,the average jet velocityvarises with increasing frequency,while the discharge power decreases gradually.Therefore,the total energy effi-ciency increases.In the case of capacitive discharge(Zong and Kotsonis,2018),the jet energy gradually decreases with increasing frequency,while the total discharge energy remains unchanged,so the total energy efficiency gradually decreases.
Table 4 Steady pressure distortion index at different excitation frequencies
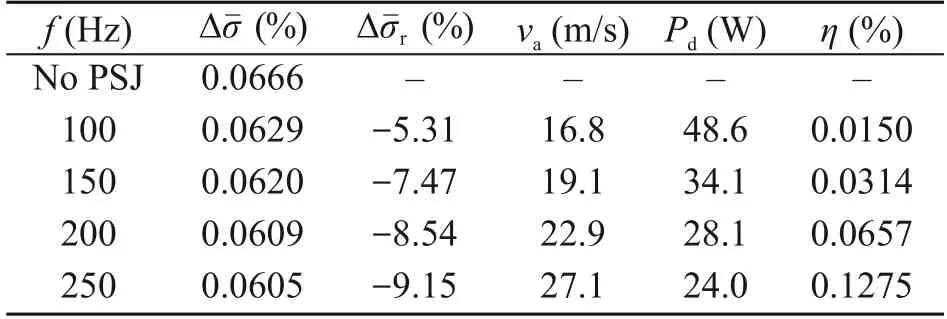
Table 4 Steady pressure distortion index at different excitation frequencies
Asfincreases,Cpincreases linearly (Fig.12),and the steady pressure distortion indexdecreases gradually (Table 4).Whenf=250 Hz,the maximumincrease inCpwas 127.8% (x/L=0.33),even though the increment ofCpat the last measured point (x/L=0.97)reached 29.7%,and the reduction inreached 9.15%.This is because when the excitation frequencyincreased,the jet average speedvaand jet average momentum increased.Thus,more energy was injectedinto the BL.The ability of the PSJ to restrain the flow separation became stronger.In the experiment,owing to the limitation of the stable operating frequency of the actuator,the frequency could not be further increased to the flow separation vortex shedding frequency to produce a better control effect.Accordingly,the actuator should be optimized to improve its work-ing frequency,and the influence law of the excitation frequency should be further studied.
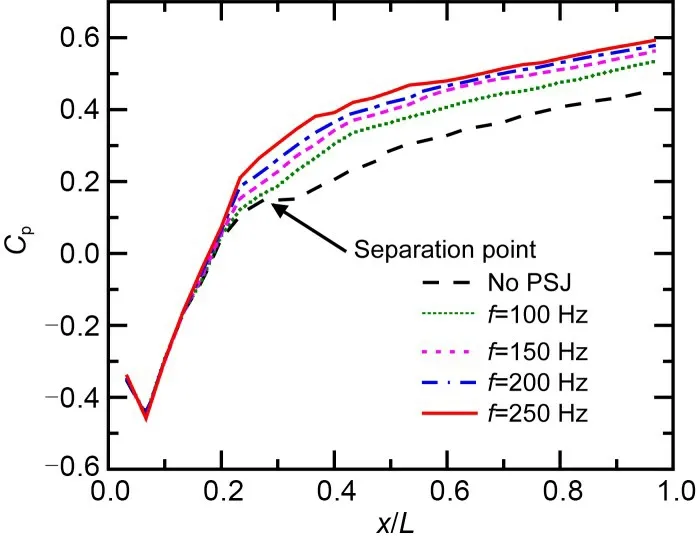
Fig.12 Wall pressure distributions for different excitation frequencies
3.1.5 Orthogonal experiment on the influencing parameters of the PSJ control effect
We experimentally confirmed that the main parameters influencing the PSJ control effect were the jet control position,jet configuration,jet momentum,and excitation frequency.This raised an important question:what are the primary and secondary orders of these parameters? If these parameters were changedindividually,it would lead to surplus experimental groups and a massive workload.Therefore,the orthogonal experiment method was used to determine the primary and secondary orders of the influencing parameters to obtain the optimal parameter set,provid-ing quick guidance for flow control applications.
According to the orthogonal experiment method,the relative steady pressure distortion coefficientwas taken as the evaluation index.Jet control posi-tion,jet configuration,excitation frequencyf,and jet momentum coefficientCμwere chosen as the influenc-ing factors.Three levels were considered for eachinfluencing factor (Table S3).We considered four factors and a three-level orthogonal experiment table(L9 (43));the table design and corresponding experi-mental results are listed in Table S4.
The results showed that the primary and secondary orders of the influencing factors were A(jet control position)>D(jet momentum coefficient)>C(exci-tation frequency)>B (jet configuration) (Table S4).The optimal parameter combination (A2B3C3D3) was applied to the ‘Λ’ configuration of the PSJ actuator near the separation location on the near-side wall surface (excitation frequencyf=250 Hz,jet momentum coefficient=2.35×10⁻³,and double orifices open simultaneously).Therefore,the jet control position and momentum coefficient should be considered in flow control applications.This is also consistent with the numer-ical calculation results for a steady jet in(Huang et al.,2013).
Jia et al.(2022)used a nanosecond dielectric barrier discharge plasma actuator to control the flow separation of an S-shaped inlet.Although the plasma excitation form is different from the plasma synthetic jet used in this paper,there are some similarities in the control effect.With respect to actuator layout,we find that the spanwise configuration is superior to the streamwise configuration,which is consistent with results obtained in the literature (Jia et al.,2022),wherein the spanwise array layout is reported to further improve the control effect.Because the excitation frequency of stable work cannot be further improved,the optimal control frequency cannot be obtained.It is reported in the literature that the control effect is best when the dimensionless frequencyF+=0.5(200 Hz).
3.2 Flow control mechanism of duct flow-field performance by PSJ
According to Section 3.1,when the excitation frequency wasf=250 Hz,and the double jet orifices were opened simultaneously,the PSJ actuator with the‘Λ’ configuration near the separation location (x/L=0.20-0.27) exhibited the best flow control effect.However,the flow control mechanism remains unclear.Only by clarifying the effect of the PSJ on the flow mechanism inside the duct can the control effect of the jet be further improved.Therefore,in this section,PIV(Fig.5) is used to measure the flow field in the streamwise and outlet cross-sections,and the active flow-field control mechanism is studied.
3.2.1 Flow-field analysis
The outlet pressure distortion is caused by the flow separation and secondary flow in the duct.The PSJ’s effect was also reflected in the control of the flow separation and secondary flow.The relationship between the effect of the PSJ on duct flow separation,outlet secondary flow,and outlet pressure distortion was analyzed to reveal its control mechanism.
3.2.1.1 Streamwise flow-field characteristics
Compared with the streamwise flow field near the side wall,the PSJ plays an important role in suppressing the flow separation.The range of the lowenergy region caused by the flow separation at the bend was significantly reduced,and the flow separation point was slightly delayed(Fig.13).Without PSJ control(Fig.13a),the flow separation point was located nearx/L=0.24.Separation regions occurred below the yellow dividing streamline,whereas the area surrounded by the green solid line was the backflow area,occupying most of the wall area (approximately 0.17L).When PSJ was applied(Fig.13b),the separation point was delayed by 4.2% ofL.The size of the separation area was reduced by 40.2% (the red solid line represents the dividing streamline in the control state,and the size of the separation area refers to the area surrounded by the dividing streamline,right sideline,and lower sideline).The backflow area was significantly reduced (up to 60.5%;the purple solid line represents the zero velocity line in the control state,and the backflow area is surrounded by the zero velocity line and the sideline).The backflow area changed from a wide range without control to a small separation bubble (approximately 0.07L).The flow-field measurement results were similar to those of Garnier et al.(2012),with distinct separation zones.
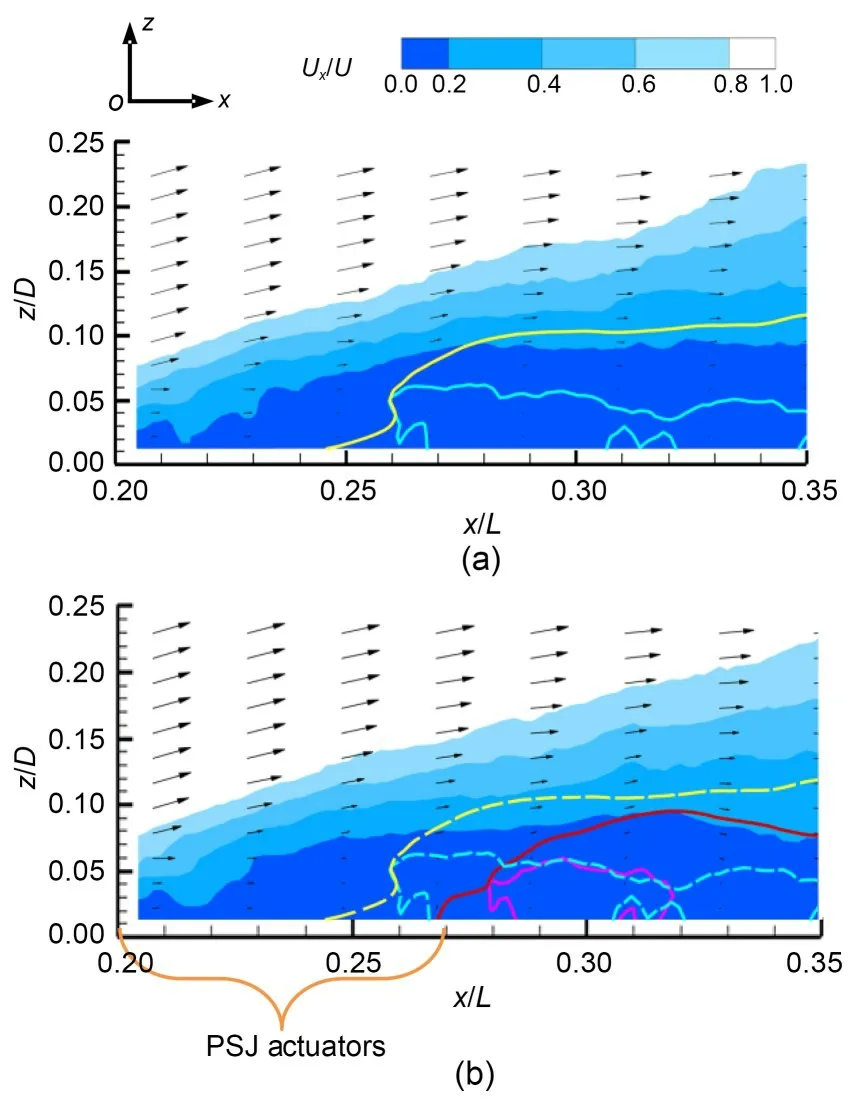
Fig.13 Streamwise time-averaged velocity fields: (a) without control;(b) with control.The velocity profiles at select streamwise locations are indicated by thin black arrows.For the baseline case in (a),the yellow solid line is the dividing streamline,whereas the blue lines are the contour lines of Ux=0 m/s.For the control case in (b),the red solid line is the dividing streamline,whereas the purple line is the contour line of Ux=0 m/s.The dashed yellow line is the dividing streamline in the baseline case.The dashed blue lines are contour lines of Ux=0 m/s in the baseline case.The PSJ actuator location is denoted by orange braces.References to color refer to the online version of this figure
Flow separation was directly related to the veloc-ity profile of the BL.We qualitatively analyzed the velocity profiles at different streamwise positions with and without PSJ control(Fig.14).The PSJ had a certain control effect near the control position(region T1,x/L=0.24-0.29)and downstream(region T2,x/L=0.32-0.37).The velocity profile became fuller,indicating that it had a stronger ability to resist the reverse pressure gradient.
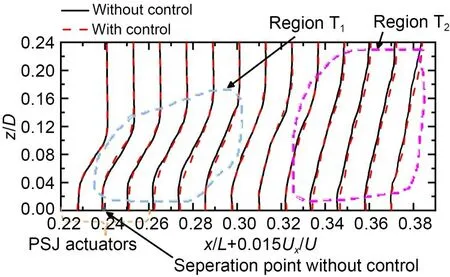
Fig.14 Chordwise variation in the BL velocity profiles
In addition to the above qualitative analysis,the shape factorHquantitatively characterizes the fullness of the BL velocity profile.It is defined as the ratio of the displacement thickness of the BLδ*and momentum thicknessθ(Eq.(S4) (Schlichting and Gersten,2017).Usrepresents the velocity component parallel to the wall in the BL.δ*andθare integrated from the wallzwto the maximum value ofUs(zref)along the normal direction of the wall.His one of the bases for assessing the effect of PSJ on flow separation control.The smaller the value ofH,the fuller the velocity profile is,and the easier it is to prevent flow separation under the reverse pressure gradient.Therefore,it is also an important index for evaluating the stability of the BL velocity profile(Dong et al.,2016).
A comparison of the shape factors of the BL with and without control (Fig.15) revealed that the PSJs significantly reducedH,retarded its growth rate,and played a key role in suppressing flow separation.Hwas approximately 4.3 atx/L=0.24(flow separation point) without control.After flow separation,Hincreased sharply and reached its maximum atx/L=0.27(approximately 6.7).With PSJ control,Hdecreased significantly,and its growth rate after separation became gentler.Hdecreased most significantly near the control position,with a maximum reduction of 31.0% (x/L=0.27),which is consistent with the changein the velocity profile of region T1shown in Fig.14.More importantly,His also decreased by over 13.0%downstream of the jet location,which is consistent with the change in the velocity profile of region T2shown in Fig.14.
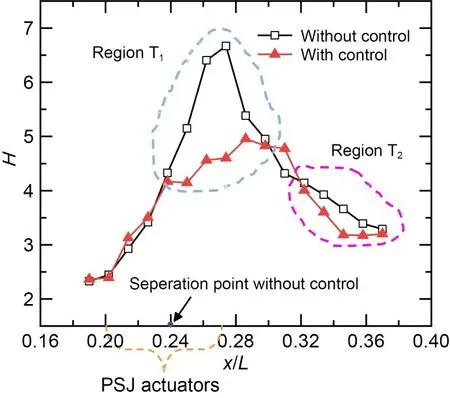
Fig.15 Chordwise variation in the BL shape factor(H)
When the jet suppressed the flow separation,the wall pressure increased.This can also reflect different effects of the jet.The relative wall pressure coeffi-cient variations ΔCp(Fig.S6) with and without control were calculated from theCpdistribution in Section 3.1.4 (Fig.12).With PSJ control,Cpincreased,especially near the jet control position.The ΔCpof this area remained above 80%,and the maximumincrement was 127.8% (x/L=0.33).This is consistent with the variation of the boundary-layer velocity profile in Fig.14 and the BL shape factor in Fig.15.As the flow moved away from the jet control position,the increase in ΔCpgradually narrowed.Downstream(x/L=0.5),ΔCpremained at approximately 40%on average.This shows that the streamwise vortex generated by the jet can control the downstream flow and improve the wall pressure.
3.2.1.2 Flow-field characteristics of the outlet cross-section
The flow field at the outlet cross-section was analyzed (Figs.S7-S10).Without PSJ control,distinct secondary flows appear at the outlet section(Fig.S7).The flow direction was from the central high-pressure area to the low-pressure area on the near-and far-side walls,respectively.Owing to the flow separation on the near-side wall,a significant amount of air flow returns to the near-side wall of the outlet section,and backflow occurs at the bottom of the outlet section.The vorticity of the backflow area was relatively high.This demonstrates a secondary swirl induced by the flow separation and secondary flow on the near-side wall of the S-duct (Fig.S7a).The indirect effect of the streamwise vortex generated by the PSJ reduced the secondary flow intensity,and the backflow near the side and bottom of the outlet section was weakened (Fig.S7b).The measured results were similar to those reported in(Pan,2014).
To further explore the control mechanism of the PSJ on the secondary flow,the distributions of the transverse velocityUz(Fig.S8) and longitudinal velocityUy(Fig.S9) of the outlet cross-section were compared with the cloud diagram of the total pressure recovery coefficient at the outlet(Fig.S10).The indi-rect effect of the streamwise vortex produced by the jet significantly suppressed the transverse and longitudinal movement of the secondary flow.Therefore,the pressure distortion was relatively suppressed.For the transverse velocityUzdistribution (Fig.S8),the jet significantly reduced the size of Regions B1,E1,and F1with a large transverse velocity and increased the total pressure recovery coefficient corresponding to Regions B,E,and F,as shown in Fig.S10.Consider-ing the longitudinal velocityUydistribution (Fig.S9),the jet significantly reduced the sizes of Regions D1and C1with a large longitudinal velocity and increased the total pressure recovery coefficient corresponding to Regions D and C in Fig.S10.Therefore,the area of the middle Region A with a high total pressure ratio significantly increased,and the pressure distortion of the outlet section decreased.
We also observed pressure distortion in Region Fin the cloud diagram of the average total pressure recovery coefficient (Fig.S10).Flow-field measurements demonstrated a flow acceleration region near the far-side wall of the outlet,which reduced the pressure in that region,resulting in a pressure distortion.The indirect control of jets from the near-side wall also suppressed it weakly.Future studies should consider arranging the jet actuators at the far-side wall outlet to actively control the flow.
3.2.2 Discussion on the control mechanism
3.2.2.1 Flow separation control
The comparative analysis of the flow field revealed that the control mechanism of the PSJ on the BL separation was mainly reflected in two aspects(Fig.16)(Zong and Kotsonis,2017a).
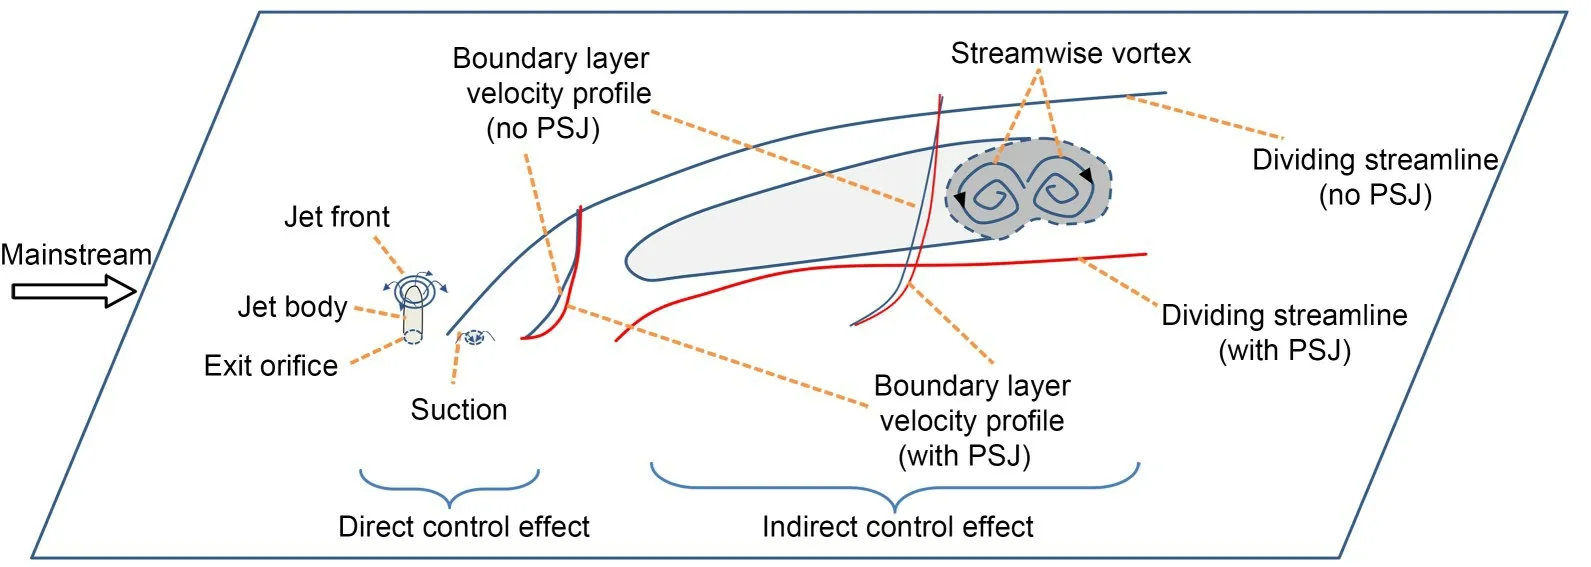
Fig.16 Conceptual model of the PSJ control flow separation mechanism in the S-duct
On the one hand,the jet momentum was injectedinto the low-energy fluid at the wall BL during blow-ing,and the low-energy fluid mass in the BL was vacuumed during suction.This effect is called the direct control effect and is reflected in the position of Region T1in Fig.14.The jet acts directly in this area.The energy of the jet was directly injected into the BL,significantly making the velocity profile fuller and reducing the shape factor of the BL (Fig.15).Therefore,the flow separation points were successively delayed,and the flow separation area was significantly reduced (Fig.13).The wall pressure of the near-side wall was significantly increased(Figs.8 and 10-12).The direct control effect was limited by the small energy of the jet and action area concentrated near the jet orifice.
On the other hand,the PSJ induced a streamwise vortex and other coherent flow structures.These streamwise vortices forced the high-energy fluid outside the low-energy BL into the BL,produced a mixing effect,enhanced the momentum exchange between the two,and delayed or inhibited the flow separation of the BL.This effect is called the indirect control effect,which is reflected in Region T2in Fig.14.Region T2is relatively far from the jet control position,where the direct control effect of the jet is weak mainly due to itsindirect control effect.Under this indirect effect,the velocity profile of the BL also became fuller(Fig.14),andHmarginally decreased (Fig.15).Therefore,the flow separation zone also decreased (Fig.13),and the wall pressure of the near-side wall maintained a significant increase (Figs.8 and 10-12).The streamwise vortex induced by the jet propagates downstream with the mainstream,with a greater influence range.Therefore,the indirect control effect is pivotal to flow separation control(He and Dong,2015;Meng et al.,2016).
3.2.2.2 Flow distortion control
Through comparative analysis of streamwise flow fields and at the outlet cross-section,the mechanism by which PSJ improves the flow distortion at the outletis also reflected in two aspects.
On the one hand,the high-speed jet ejected by the PSJ produces the combined control effect of direct and indirect flow control as discussed (Fig.16).PSJinjects energy into the BL and enhances the mixing effect between the BL and the mainstream.The ability of the BL to resist the reverse pressure gradient wasimproved.The flow separation point was delayed.The flow separation area was reduced and the flow separation intensity was restrained.
On the other hand,the high-speed jet plays a rolein controlling the secondary flow,which had both transverse and longitudinal motions.The PSJ reduced the secondary flow velocity and minimized the area with the higher transverse and longitudinal velocities(Figs.S8 and S9)(Chen and Wang,2012).
Under these two control mechanisms,the wall pressure was significantly increased (Figs.8 and 10-12),the flow distortion of the outlet cross-section was significantly reduced (Fig.S10),and the steady pressure distortion coefficient decreased(Tables 1-4 and S4).
3.2.2.3 Jet control position
The above control mechanisms can be used to explain the effect of the PSJ control positions on the flow separation and secondary flow (Section 3.1.1.2).When the PSJ actuators are arranged near the separation location(Table 1),the reduction in the steady pressure distortion coefficient at the outlet is the largest and the corresponding increase in the wall pressure recovery coefficient is also the largest (Fig.8).This demonstrates that the control effect of the PSJ near the separation point is the strongest and its overall control efficiency reaches a maximum.When the PSJ actuators are placed upstream of the separation location,the jets have a certain effect on the wall pressure recovery.However,the energy is injectedin advance and the control effect is weakened as the jet reaches the separation location.The wall pressure coefficient is less than that excited near the separation location.When the PSJ actuators are positioned downstream of the separation location,the jets workin a wide range of low-speed flow in the separation area,where they barely control the flow.In summary,the jet control position near the separation location is optimal and contributes most significantly to flow control when the same excitation energy is used.Besides,changing the jet configuration,jet momentum,and excitation frequency in the above experiments also regulated the effect of the PSJ on flow separation and secondary flow control.
The above discussion on the mechanism is mainly based on the measurement results of a 2D flow field.The mechanism should be further studied,e.g.the interaction process between the streamwise vortex generated by the jet and the separated flow of the BL,and the evolution of the 3D flow structure in the duct.In the future,3D PIV technology will be considered in the investigation of the streamwise flow field variations with different cross-sections to obtain a more refined and comprehensive internal flowfield evolution.
4 Conclusions
In this study,serial discharge PSJs were used to actively control the flow-field characteristics of an S-duct.The effects of the jet control position,jet configuration,jet momentum,and excitation frequency of the PSJ on the flow-field characteristics of the duct were systematically explored.The primary and secondary orders of the four parameters were determined via an orthogonal experiment,and the best control parameter set was obtained.Finally,the mechanism for controlling the flow-field characteristics of the PSJ was discussed.The main results and conclusions of this study are as follows:
(1) The PSJ can significantly improve the wall pressure recovery coefficient,suppress the flow separation of the S-duct,and improve the outlet pressure distortion.The jet control position is optimal near the separation location.We adopt the‘Λ’jet configuration,which is demonstrably better than the streamwise and spanwise jet configurations.In this experiment,the higher the jet momentum coefficient and excitation frequency,the better the control effect.The maximumincrease in the wall pressure coefficient was 127.8%(x/L=0.33).
(2) The primary and secondary orders of the influencing factors of the duct outlet pressure distortion control effect were determined via the orthogonal method as follows: jet control position>jet momentum coefficient>excitation frequency>jet configuration.The best control parameters are an excitation frequency off=250 Hz,double jet orifices (the jet momentum coefficient is the largest),a control position near the separation location,and the ‘Λ’ configuration.Accordingly,the steady pressure distortion index of the outlet decreased by 9.15%.
(3) The mechanism by which the PSJ improves the flow distortion at the duct outlet is that the highspeed jet directly injects energy into the BL and induces a streamwise vortex,indirectly controlling the BL.These two control effects make the BL velocity profile fuller and reduce the BL shape factor.Thus,the PSJ improves the ability of the BL to resist adverse pressure gradients,delays flow separation,and reduces the flow-separation area.Moreover,the highspeed jet reduces the secondary flow velocity includ-ing the range of high transverse and longitudinal velocities.It also reduces the vorticity and backflow at the outlet cross-section,and effectively reduces theintensity of the secondary flow.Finally,the wall pressure increases significantly,and the flow distortion and steady pressure distortion coefficient decrease remarkably.
This study provides a new technology for the control of flow-field characteristics of S-ducts and hasimportant guiding significance for the application of synthetic jet technology to ducts.Several aspects should be further investigated in future work.For example,the jet configuration should be further opti-mized.The actuator design should be optimized toimprove the stable excitation frequency and explore the best excitation frequency.Furthermore,3D PIV should be used to measure the flow field and elucidate the control mechanism.
Acknowledgments
We would like to thank Associate Professor Jian-feng ZHU and PhD candidate Ting ZHAO of Professor Yan-cheng YOU’s research group,Xiamen University for their supportin conducting the pressure measurements.
This work is supported by the Fundamental Research Funds for the Central Universities of China(No.20720210050);the National Natural Science Foundation of China (No.51707169);the Natural Science Foundation of Fujian Prov-ince,China (No.2019J01042);the Aeronautical Power Fund Project,China(No.6141B09050390);the Project on the Integration of Industry,Education and Research of Aero Engine Corporation of China (No.HFZL2018CXY009);the Xiamen University Training Program of Innovation and Entrepreneurship for Undergraduates(No.202110384082).
Author contributions
Xiao-yin MEI,Ru-bing LIU,Zhe-zhe SU,and QiLIN designed the research.Xiao-yin MEI,Ru-bing LIU,Yu-wen LU,and Sheng-huiXUE processed the corresponding data.Ru-bing LIU and Xiao-yin MEI wrote the first draft of the manuscript.Sheng-huiXUE helped to organize the manuscript.Ru-bing LIU revised and edited the final version.
Conflict of interest
Ru-bing LIU,Xiao-yin MEI,Sheng-huiXUE,Yu-wen LU,Zhe-zhe SU,and QiLIN declare that they have no conflict of interest.
 Journal of Zhejiang University-Science A(Applied Physics & Engineering)2022年8期
- Journal of Zhejiang University-Science A(Applied Physics & Engineering)的其它文章
- Copyright Information
- Activeflow co ntrol of S-duct by plasma synthhetic jet
- Experimental study of the bearing capacity of a drainage pipe pile under vacuum consolidation
- How fast is it to city centers?The average travel speed as an indicator of road traffic accessibility potential
- Effects of moisture content and dry bulk density on the thermal conductivity of compacted backfill soil
- Flow control characteristics of the digital and mechanical redundancy control electric modulation valve
