Reconstruction of fission events in heavy ion reactions with the compact spectrometer for heavy ion experiment
Xin-Yue Diao· Fen-Hai Guan· Yi-Jie Wang · Yu-Hao Qin ·Zhi Qin · Dong Guo · Qiang-Hua Wu · Da-Wei Si · Xuan Zhao ·Sheng Xiao · Yao-Peng Zhang · Xiang-Lun Wei · Hai-Chuan Zou ·He-Run Yang · Peng Ma · Rong-Jiang Hu · Li-Min Duan· Artur Dobrowolski ·Krzysztof Pomorski · Zhi-Gang Xiao
Abstract We report a reconstruction method for fast-fission events in 25 MeV/u 86Kr + 208Pb reactions at the Compact Spectrometer for Heavy Ion Experiment(CSHINE).The fission fragments(FFs)are measured using three large-area parallel-plate avalanche counters, which can deliver the position and arrival timing information of the fragments. The start timing information is provided by the radio frequency of the cyclotron. Fission events were reconstructed using the velocities of the two FFs. The broadening of both the velocity distribution and azimuthal difference of the FFs decreases with the folding angle, in accordance with the picture that fast fission occurs. The anisotropic angular distribution of the fission axis also consistently reveals the dynamic features of fission events.
Keywords Fast fission · Heavy ion reactions · Parallelplate avalanche counter · CSHINE
1 Introduction
One of the purposes of studying heavy ion reactions(HIRs) is to infer the properties of the nuclear equation of state, which is an essential input for modeling and computing the evolution and properties of neutron stars and their merging [1–3]. The isovector sector of the nuclear equation of state, namely, the density behavior of the symmetry energy Esym(ρ), has been a long-standing open question in nuclear physics. At Fermi energies, some observables have been identified to constrain Esym(ρ) near normal density, including isospin diffusion, dipole polarizability, and particle emissions [4–10]. Very recently,neutron skin thickness has been reported from the PREX II experiment, which yields a stiff Esym(ρ) in relation to previously existing constraints[11,12].At supra-saturation densities, many experiments have been conducted to measure the charged pion ratios or collective flow in heavy-ion collisions to probe Esym(ρ)[13,14].An externaltarget experiment (the Heavy Ion Research Facility in Lanzhou CSR External-target Experiment) is under construction in this direction [15, 16].
Nuclear fission is a large-amplitude collective motion mode that involves hundreds of nucleons.Recently,studies on nuclear fission have been revived for their significance in both nuclear physics and astrophysics. In a stellar environment, the abundance of nuclides in the A ≈160 region is significantly influenced by the recycling of fission products[17–19].Theoretically,statistical fission has been well described by microscopic theories and various phenomenological approaches [20–32]. When the excitation energy or angular momentum becomes much higher, as achieved in HIRs well above the Coulomb barrier, the fission barrier tends to vanish. Consequently, the fission time scale becomes shorter by a factor of 10–100, and the variance of the mass asymmetry η increases significantly(where η of the two fragments can be >0.6), compared to that of statistical fission [33–37]. In this case, the dynamic feature of the fission process is significant, and transport models have been successfully applied to describe the fastfission process [38–46]. Time-dependent Hartree–Fock theory can also provide an excellent description of fast fission, starting with large deformations [47]. Fast fission,which is usually termed dynamic fission because of its vanishing fission barrier and short time scale, has been investigated in various systems in the past three decades[48–54].
The topic of fast fission with simultaneous emission of light particles deserves further investigation because the fissioning system provides an appropriate laboratory for probing Esym(ρ). The connection between the studies of fast fission and Esym(ρ) has recently been established by simulations with improved quantum molecular dynamics(ImQMD) [55, 56]. It has been suggested that the fastfission process following an HIR carries the effect of Esym(ρ) and provides sensitive probes because of the formation of a low-density and neutron-rich neck and the larger surface of two fragments compared to the non-fission process [56, 57]. The isospin content of light particles emitted from fast-fission events has been used to probe Esym(ρ) experimentally [10].
To conduct experimental studies on fast fission and coincident emission of light charged particles (LCPs) and intermediate-mass fragments (IMFs), the Compact Spectrometer for Heavy Ion Experiment (CSHINE) has been developed [58, 59]. While the LCPs and IMFs are measured using silicon strip detector telescopes (SSDTs)[60, 61], the fission fragments (FFs) are measured using parallel-plate avalanche counters (PPACs) [62].
In this study,we present the measurement of fast fission in86Kr +208Pb reactions with CSHINE in the second phase. After a brief introduction to the phase-II setup of CSHINE in Sect. 2,the reconstruction of the FF velocity is introduced in Sect. 3, and the dynamic features of fast fission are presented in Sect. 4. Section 5 provides a summary of this study.
2 CSHINE detector system and the experimental setup
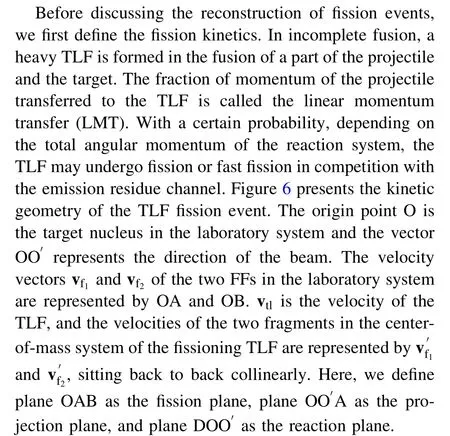
The beam experiment was conducted on Radioactive Ion Beam Line I(RIBLL1)at the Heavy Ion Research Facility in Lanzhou, China. The208Pb target with an areal density of 1 mg/cm2was bombarded with a 25 MeV/u86Kr beam.The charged reaction products were measured using CSHINE,which was installed in a large scattering chamber located at the final focal plane of RIBLL1. In this experiment, three PPACs were installed for FF measurements to reconstruct the reaction geometry.In addition,four SSDTs were installed for LCPs covering the polar angle range of 10°<θlab<60°. The SSDTs are three-layer detectors with a single-sided SSD for ΔE1as layer 1,a double-sided SSD for ΔE2as layer 2, and a 3×3 CsI (Tl) array for residual energy measurements as layer 3. Both single- and doublesided SSDs are BB7 types(with a 2 mm strip width and 32 strips on each side)from Micron Semiconductor Ltd.Each CsI (Tl) crystal is a square pyramid with dimensions of 23×23 mm2on the front side, 27×27 mm2on the rear side, and 50 mm in height. A photodiode (Hamamatsu S3204)was used to read out the signal from the CsI.Fig.1 presents the detector setup of CSHINE in the experiment that can measure FFs and coincident LCPs simultaneously.Details and performance of CSHINE can be found in[58,59].Table 1 presents the distance d from the center of each detector to the target, polar angle θ, azimuthal angle φ, and sensitive area S of the SSDTs and PPACs in the experiment. The thicknesses of ΔE1and ΔE2for each SSDT are also listed.
The FF detector(PPAC)is a type of multiwire chamber working in the region of limited proportionality. The signals induced by the incident fragments on an individual wire in the anode plane, either X or Y, were transferred through a delay line to both ends.The time delay of the two signals X1and X2(Y1and Y2) with respect to the signal collected on the cathode plane, which delivers the timing information, provides the X (Y) position of the hit in the sensitive area. Fig. 2 presents a schematic view of the mechanics of the PPAC.The total thickness of the sensitive gas layer was ~2 cm. The PPACs were operated with 4.5 mbar isobutane at a voltage of 465 V.Under this condition,FFs can be recorded with an efficiency of >95%, but the LCPs and IMFs are suppressed.
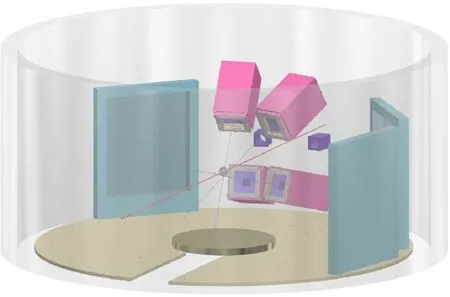
Fig. 1 (Color online) Schematic view of CSHINE phase II

Table 1 Geometric parameters of PPACs and SSDTs
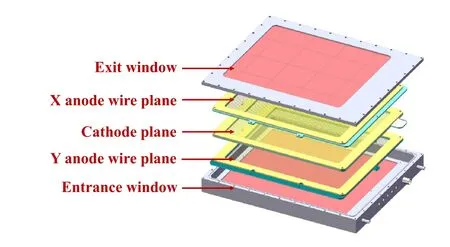
Fig. 2 (Color online) Schematic view of PPAC as the FF detector
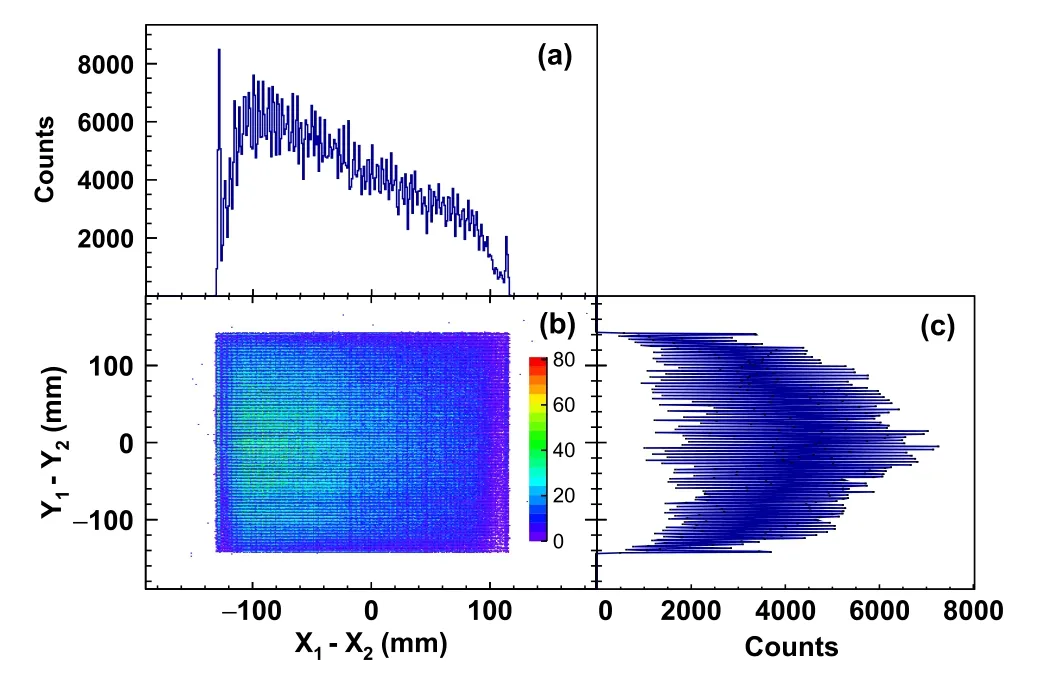
Fig. 3 (Color online) Scattering plots of Y1-Y2 versus X1-X2 of PPAC1. Panels a and c show the projections of the two-dimensional plot of X–Y in panel b
Figure 3b shows a two-dimensional histogram of Y1-Y2versus X1-X2for PPAC1 as an example. The projections to X and Y directions are plotted in Fig. 3a and c,respectively. Good timing performance, corresponding to good position resolution, manifests itself in the sharp boundary for the two-dimensional distribution and the well-separated individual peaks on the projections. The distance of the neighboring wires is 4 mm,and there are 61 and 71 peaks in Fig. 3a and c, respectively. A time resolution of σT=300 ps and a position resolution of σr=1.35 mm can be derived from the data. The overall performance of the PPACs can be found in [62].
The SSDTs were used to measure the LCPs and IMFs in coincidence with the FFs. To reduce the total number of electronic components, every two neighboring strips were merged into one channel, and correspondingly, the granularity was reduced. Multi-tracks can fire each SSDT.To reconstruct the tracks in the SSDTs, a novel algorithm was developed with a special focus on the charging sharing effect.More than 80%of the hits in all layers of the SSDTs can be recognized and assigned to certain tracks.For more details, refer to [60].
The CSHINE trigger system was designed for both the beam experiment and calibration. The timing signals of PPACs were discriminated by a Constant-Fraction Discriminator CF8000 and logically calculated using a Quad 4-Input Logic Units CO4020 to generate PPAC inclusive signals and PPAC two-body coincidence signals.The logic hit signals of the SSDTs were extracted by the front side of the double-sided SSD (ΔE2) with the discrimination of MSCF-16, which generates an analog multitrigger signal proportional to the number of fired strips in the same module (16 channels). Both inclusive and exclusive logic signals can be generated by discriminating multi-trigger signals at different threshold settings. In the beam experiment, the trigger signal contained SSD two-body events,PPAC two-body events,and the coincidence of PPAC twobody with SSD one-body events. In addition, an inclusive trigger for every individual detector was also constructed and optionally turned on for detector calibration before or after beam data acquisition.For more details,refer to[60].
3 Reconstruction of the velocity
We concentrated on the reconstruction of fission events.The flight path of FFs can be determined by PPACs delivering good position information. The velocity of each FF is derived from the timing information. In previous experiments, because the absolute flight time of fragments was not measured, we could obtain only the difference of flight time between fragments. Therefore, we could not directly obtain the velocity of the fragments [63, 64]. It is notable that the starting time information was recorded in this experiment provided by the radio frequency (RF) of the accelerator. The RF signal, usually in sinusoidal form,was discriminated by the CF8000 module and input to the time-to-digital converter (TDC). Generally, for a particle firing a given detector,the time of flight(TOF)is written as
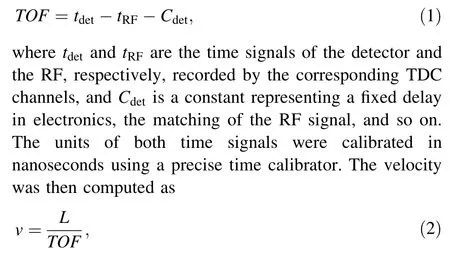
where L is the length of the flight path from the target to the hit position where the fragment fires on the detector.
To verify the validity of the above method for measuring the TOF, we use calibrated α particles, where the velocity is alternatively derived from the energy measured in SSDT3. Fig. 4a presents the correlation between the α energy and the TOF derived by Eq. (1). The theoretical curve fitting of the E–TOF profile applies a constant Cdet=431.8 ns. Fig. 4b presents the difference between the TOF measured by the TDC and the value L/v(Eα), where v is derived from the energy Eαand L is the distance from the target to the hit position in SSDT3. A width of 1.3 ns is obtained by Gaussian fitting. By subtracting the contribution of the energy uncertainty, a TOF resolution of ~1.0 ns was obtained for the SSDT. For the FF measured in PPACs, the TOF resolution is comparable because the timing resolution of PPACs is 300 ps,which is much better than that of the SSDT.
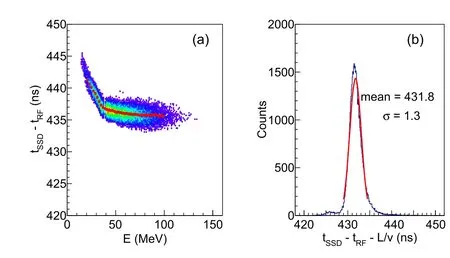
Fig.4 (Color online)a Correlation of the TOF signal and the energy of α particles recorded by SSDT3. b Distribution of the time difference between the TDC measurement and the calculated value from the calibrated energy
With the validity of Eq. (1), we can discuss the TOF of the FFs.Because PPACs cannot identify the charge or mass of the FFs, nor the total kinetic energy, one relies on the determination of the velocities, which requires TOF information and the length of the flight path, L. In Eq. (1),the relative difference in the delay constants,Cppac1-Cppac2,between the two PPACs can be adjusted to zero using a pulser prior to the experiment, and the systematic uncertainty can be well controlled within ±2 ns.However,the absolute value of Cppacof each PPAC cannot be determined, as in the SSDT, because the particle type and total energy are unknown.To overcome this difficulty,we use Viola systematics in which the relative velocity of the FFs is on average 2.4 cm/ns[65].Hence,by tuning the constant Cppac, one can optimize the value of<vFF>=2.4 cm/ns. Figure 5 presents the distribution of vFFvalues at different delay constants. It can be observed that the peak position of vFFmoves significantly by varying the delay constant by 2 ns. In our experiment,Cppac=115.5 ns was optimized, and the corresponding distribution of vFFvalues is plotted in Fig.5b.The variation of <vFF>is 0.1 cm/ns based on transport model calculations and a 2 ns systematic uncertainty of the TOF of FFs is estimated, which will not change the conclusion of the following analysis. We recall that the coincident events recorded by PPAC1 with PPAC2 (marked by PPAC1×2)or with PPAC3 (marked by PPAC1×3) are the FFs because the high voltage(HV)condition is set such that the response of PPAC to energetic LCPs and IMFs is completely suppressed, given that the energy loss of these particles is less than that of FFs by more than an order of magnitude. In addition, the correlation between a heavy projectile-like fragment and a target-like fragment(TLF)is beyond the current geometrical coverage.
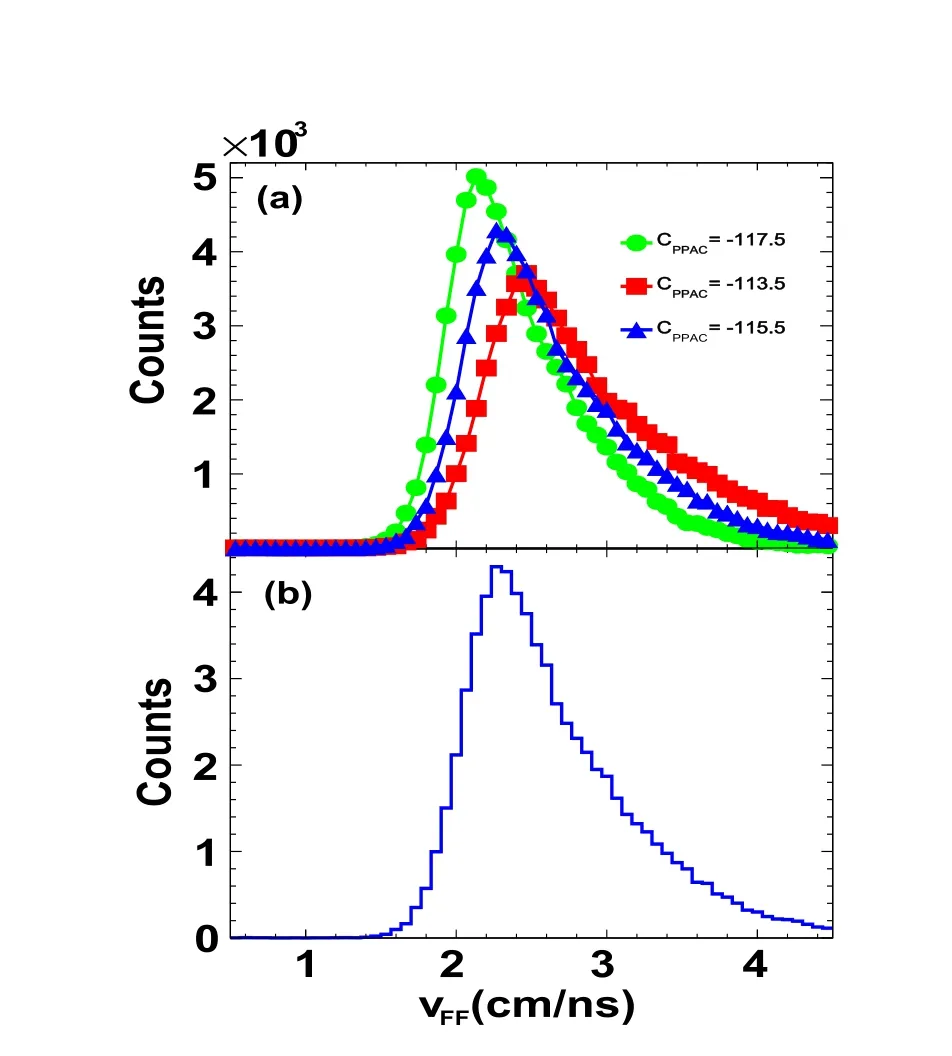
Fig.5 (Color online)Relative velocity distribution vFF of the two FFs with different parameter settings of CPPAC
4 Results and discussion
Once TOF is determined,the velocity of the FFs can be computed event by event using the hit positions of the FFs in the PPACs.Subsequently,the entire fission event can be reconstructed. Figure 7 presents the velocity distributions of the FFs in PPAC1×2 and PPAC1×3 events,respectively.Here,vf1is the FF recorded in PPAC1 and vf2is the FF in PPAC2(PPAC3)in PPAC1×2 (PPAC1×3)events.The figure shows that the distributions of vf1and vf2are very similar for PPAC1×2 events, because the two PPACs are nearly symmetric with respect to the beam.Meanwhile, a high-velocity tail is evident in PPAC1×2 events, and the velocity spectra are wider than those in PPAC1×3 events. This component is mainly due to events with smaller folding angles,corresponding to larger LMTs, as will be discussed below.
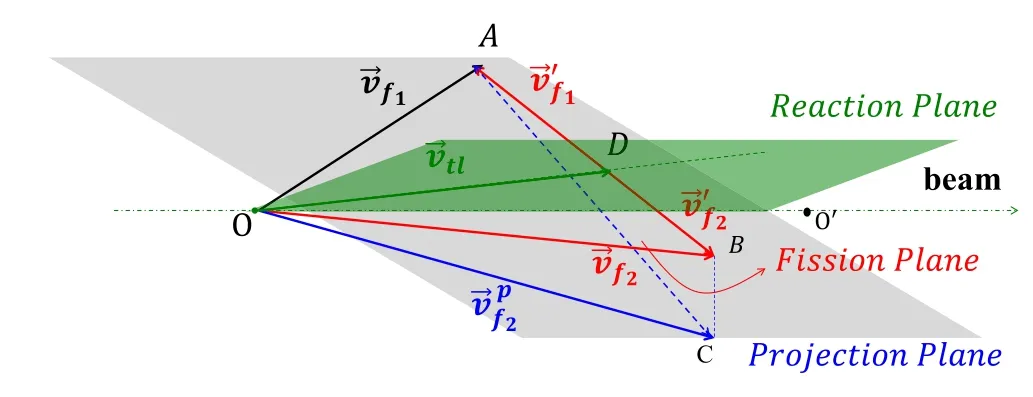
Fig.6 (Color online)Geometric diagram of the velocities of the two FFs from the TLF
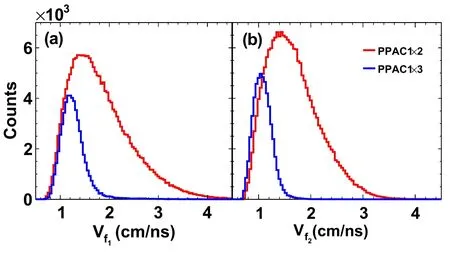
Fig. 7 (Color online) Velocity distribution of the two FFs in PPAC1×2 and PPAC1×3 events
After the velocities of the two FFs are determined, the folding angle method is applied to calculate the LMT of the reaction. By recalling the definitions in Fig. 6, the folding angle ΘFFis defined as the angle ∠AOC, spanned by the projection of the velocity vectors of the FFs on the projection plane [66]. Given velocities vf1and vf2, the folding angle depends on the velocity of the TLF, vtl; that is, the larger the value of vtl, the smaller ΘFFwill be.Figure 8 presents the distribution of the folding angle ΘFF.The coincident events of PPAC1×2 are distributed in the range of 70°-120°with a peak situated at ~95°, corresponding to a larger LMT(red),whereas the PPAC1×3 events sit in the range of 120°–170°, corresponding to a smaller LMT (blue). The valley between the two components is simply due to the deficiency caused by the gap between PPAC2 and PPAC3, and the efficiency arising from incomplete azimuthal coverage is not corrected in the plot.
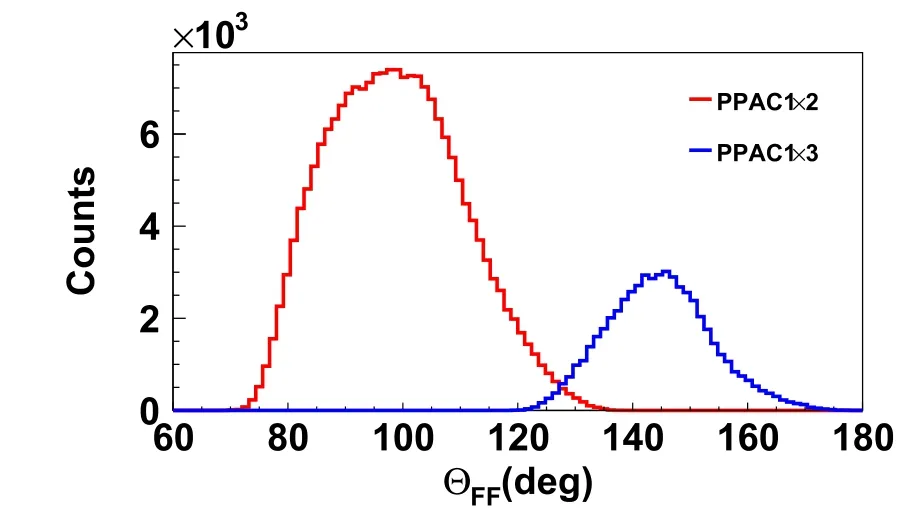
Fig. 8 (Color online) Folding angle distribution
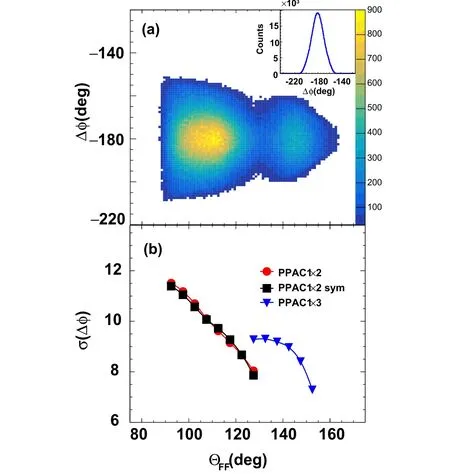
Fig.9 (Color online)a Azimuthal angle difference Δφ as a function of the folding angle ΘFF of the FFs. The inset shows the projection distribution of Δφ. b σ(Δφ) as a function of ΘFF
As the fission geometry is determined by the two velocity vectors,it is of interest to examine the planarity of fission events.Figure 9a presents the azimuth correlation of the two FFs by a scattering plot between the azimuthal angle difference Δφ and the folding angle ΘFF. It is clear that,for the FFs from both central and peripheral reactions,the most probable value is Δφ=180°, following the situation in which the system undergoes a binary decay.Here,we note that Δφ is a directly measurable quantity that relies on no assumptions. The inset shows the projection distribution of Δφ, and a standard deviation of σ(Δφ)≈10°was derived.This broadening suggests that the emission of LCPs or IMFs may change the flight direction of the FF and smear the back-to-back feature of the fission event.To investigate its evolution with the violence of the reaction,we plotted in Fig. 9b the standard deviation of the azimuthal angle, σ(Δφ), as a function of the folding angle ΘFF.The figure shows that σ(Δφ)decreases with ΘFFover the entire range, except for ΘFF≈130°, where a discontinuity appears owing to the gap between PPAC2 and PPAC3. To exclude the possible reason that this trend originates from the asymmetry of the geometrical locations of the PPACs,we restrict further analysis of the events with the two FFs flying symmetrically in the beam direction,that is, with the condition of θ1=θ2, where θiis the polar angle of the ith fragment.The results are depicted by black squares, where the bin width of each ΘFFis ±2.5°. This condition is applicable only for PPAC1×2 fission events because these two PPACs are placed in an approximate left–right symmetry with respect to the beam line. It is evident that the data points with the symmetry condition are sitting on top of those without the condition,suggesting that the decreasing trend of σ(Δφ) as a function of ΘFFis truly due to reaction violence. Because the post-scission particle emission changes the velocity of the FF owing to the recoil effect, the trend suggests that, in the fission following the intermediate-energy HIRs, there is sufficient excitation energy left at the scission point depending on the LMT. In the reactions with a larger LMT, more excitation energy is left and released through particle emission in the post-scission stage. This is consistent with fast fission,instead of statistical fission in which the excitation energy is nearly depleted at the scission point.
The dynamic features of fast fission can be further explored based on the velocity distribution of the FFs.Figure 10a presents the average of the velocities of the FFs recorded in the PPACs as a function of folding angle.From Fig. 10a, one can observe that the average velocity value<vf>decreases with the folding angle. Figure 10b presents the standard deviation of the velocity,σ(vf).It is also clear that the broadening of the velocity of the FFs decreases with the folding angle. This result is consistent with the trend in σ(Δφ) in Fig. 9. The scission point is reached early when the excitation energy of the fissioning TLF is still high; thus, the statistical fluctuation (corresponding to the left excitation energy) enhances the variance in the velocity of the FF. This is consistent with earlier experimental observations of Ar+209Bi reactions at 25 MeV/u [67–69].
Finally, the dynamic features of fast fission may also cause anisotropy in the angular distribution of the fission axis. Here, the fission axis is defined as the vector of the relative velocity, vFF, from f2to f1, where f1and f2are fragments. ΛFFis the angle of the fission axis with respect to the beam axis as defined in [55]. Usually, the experimental measurement of the distribution of ΛFFrequires fine correction of the geometric efficiency; hence, it is more feasible to use a 4π detection system.
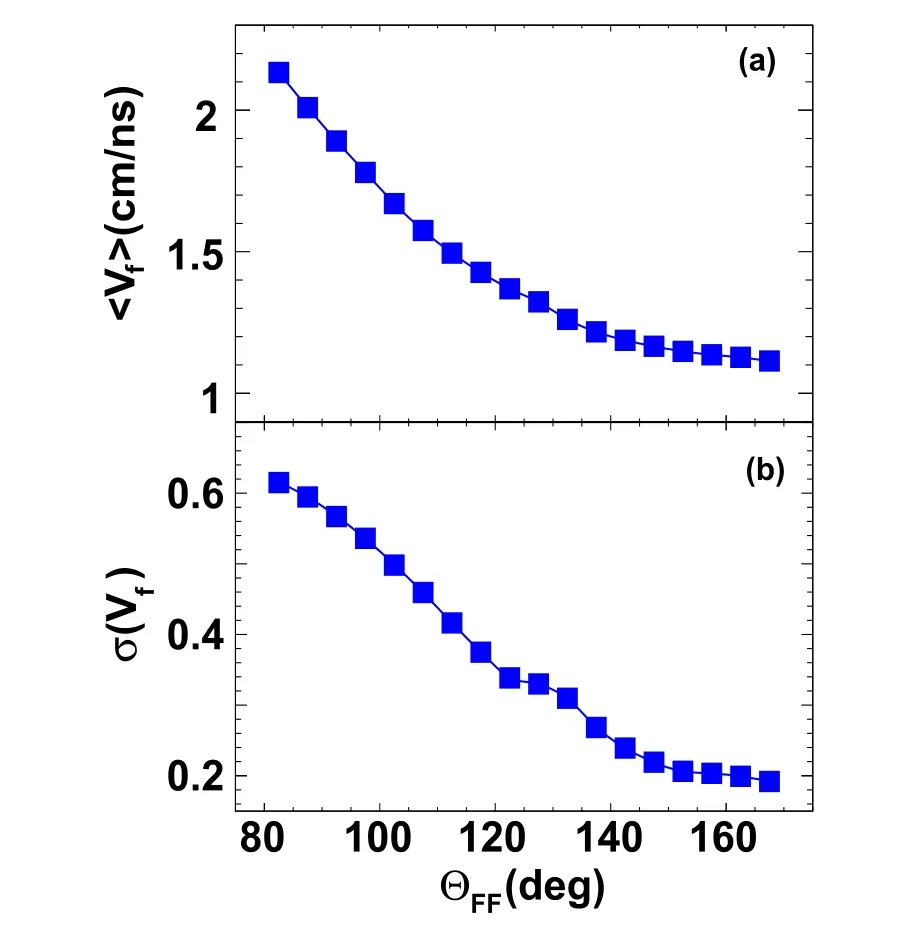
Fig. 10 (Color online) a Average value of velocity and b standard deviation of the velocity distribution as a function of folding angle
In our experiment, PPACs cover only part of the entire space, and we fix the direction of the first FF in PPAC1 to introduce less ambiguity to the geometry efficiency correction.In this case,we only need to correct the efficiency of the second FF on PPAC2 and PPAC3, and the trend of the angular fission axis can be inferred. Figure 11 presents correlation plots of the parallel and transverse velocities of the FFs. Here, the transverse velocity of the FFs recorded in PPAC1 is defined as positive and that in the other two PPACs is defined as negative. It is clear that there was a dead area of 20°between PPAC2 and PPAC3. The dashed lines define a narrow range of 40°<θf(wàn)1<45°, which was fixed in the investigation of the distribution properties of the fission axis as described in the following.
The distribution of dσ/d cos(ΛFF) is shown in Fig. 12.The geometric efficiency arising from the incomplete azimuth coverage of PPAC2 and PPAC3 is corrected for each ΛFFbin. The events of PPAC1×2 and PPAC1×3 are represented by symbols, whereas the curve represents the sum.The figure clearly shows that the deficiency in the gap between PPAC2 and PPAC3 causes a kink in a wide range of 63°<ΛFF<80°. Regardless of the kink area and the uncovered region within ΛFF<50°, the distribution of dN/d cos(ΛFF) increases steadily with cos(ΛFF) and tends to peak at a forward angle, which is at variance with the expectation of an isotropic distribution for statistical fission.This trend is in qualitative agreement with previously reported experimental results for HIRs at Fermi energies[48, 49].
5 Summary
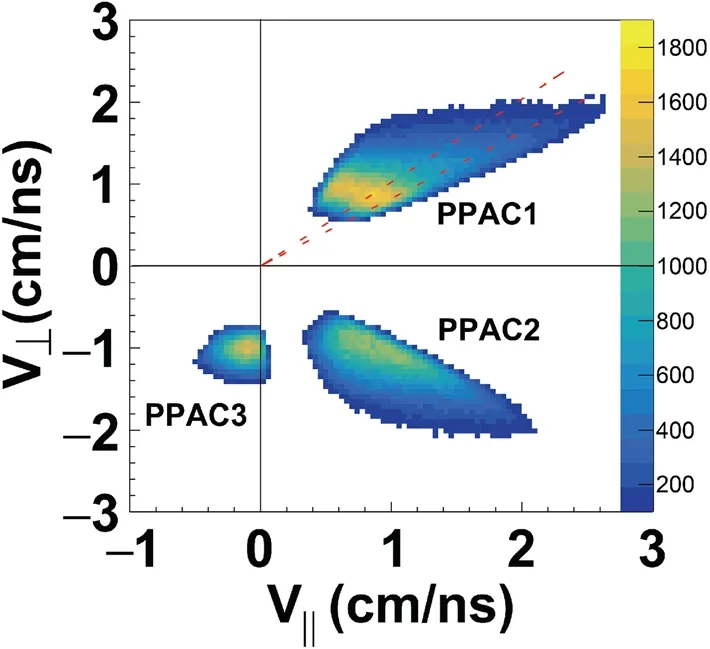
Fig. 11 (Color online) Transverse and parallel velocity distribution of the FFs
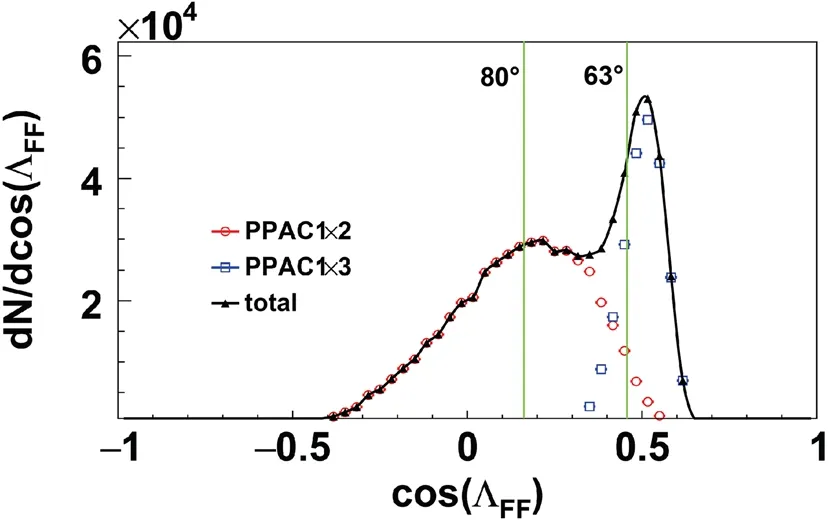
Fig. 12 (Color online) Angular distribution dN/d cos(ΛFF) of the fission axis with respect to the beam
In summary, FFs in 25 MeV/u86Kr +208Pb reactions were measured using the CSHINE detection system.In the current phase,three PPACs and four SSDTs were mounted to measure the FFs and coincident LCPs and IMFs,respectively. Using the timing and position signals of the PPACs and the start timing from the RF of the accelerator,we can measure the velocities of the FFs and reconstruct the fission events, where LMT can be derived from the folding angle. It is shown that the width of the azimuthal angle difference, the mean value, and the width of the velocity distribution of the FFs all decrease with the folding angle.An anisotropic angular distribution of the fission axis is observed. These results are consistent with the situation in which fast fission occurs. Prospectively, with the ability of reconstructing the fission events, CSHINE provides opportunities to study isospin dynamics and nuclear symmetry energy by further counting the coincident isotope-resolved LCPs and IMFs.
AcknowledgementsWe acknowledge the crystal group from IMP and CAS for providing the CsI detectors, the RIBLL group for offering local help in the experiment, and the machine staff for delivering the krypton beam.
 Nuclear Science and Techniques2022年4期
- Nuclear Science and Techniques的其它文章
- Correction to: Research on tune feedback of the Hefei Light Source II based on machine learning
- Energy and centrality dependence of light nuclei production in relativistic heavy-ion collisions
- High-brightness photo-injector with standing-wave buncher-based ballistic bunching scheme for inverse Compton scattering light source
- Neutronic study on the effect of first wall material thickness on tritium production and material damage in a fusion reactor
- Nuclear mass based on the multi-task learning neural network method
- Signal modeling and impulse response shaping for semiconductor detectors
