
Effect of Polycyclic Aromatic Hydrocarbons on the Stability of Hydrogenation Catalyst for Producing Ultra-Low Sulfur Diesel
2022-04-14 05:55:26DingShiGePanzhuZhangRuiXiYuanbingZhangLeLiDadongNieHong
中國煉油與石油化工 2022年1期
Ding Shi; Ge Panzhu; Zhang Rui; Xi Yuanbing; Zhang Le; Li Dadong; Nie Hong
(SINOPEC Research Institute of Petroleum Processing, Beijing 100083)
Abstract: The effect of polycyclic aromatic hydrocarbons (PAHs) on the stability of the hydrogenation catalyst for production of ultra-low sulfur diesel was studied in a pilot plant using Ni-Mo-W/γ-Al2O3 catalyst. The mechanisms of catalyst deactivation were analyzed by the methods of elemental analysis, nitrogen adsorption-desorption,thermogravimetry-mass spectrometry (TG-MS) technology, X-ray photoelectron spectroscopy (XPS) and high resolution transmission electron microscopy (HRTEM). The results demonstrated that PAHs had little effect on the activity of catalyst at the beginning of operation, during which the reaction temperature was increased by only 1 - 4 °C. However, the existence of PAHs significantly accelerated the deactivation of catalyst and weakened the stability of catalyst. This phenomenon could be explained by the reason that the catalyst deactivation is not only related to the formation of carbon deposit, but is also closely related to the loss of pore volume and the decrease of Ni-W-S phase ratio after adding PAHs.
Key words: ultra-low sulfur diesel; catalyst deactivation; polycyclic aromatic hydrocarbons
1 Introduction
Due to the the increasingly inferior quality of crude oil and the increasingly strict environmental laws and regulations, the production of ultra-low sulfur diesel(ULSD) has become the focus of current researches[1-3].The polycyclic aromatic hydrocarbons (PAHs) are high density components in diesel, and also the main components of particulate matter discharged during diesel engine operation. The PAHs in the exhaust gas emitted by diesel engines can also cause environmental pollution and directly threaten the health of humans and animals.
In order to effectively reduce the emission of harmful substances from diesel engines, in recent years, many countries have stipulated high quality standards for vehicle diesel fuel, especially for sulfur content and PAHs content. At present, most studies are mainly focused on the development of highly active catalysts. However, the problem of catalyst deactivation is particularly important, when the inferior crude oil is processed at the refinery. With the increase of sulfur content, nitrogen content and polycyclic aromatic hydrocarbon content in feedstock, the deactivation of catalyst becomes particularly crucial for the production of ultra-low sulfur diesel. Most studies show that the life of catalyst will be shortened obviously with the increase of PAHs content in the feedstock[4-6]. Wiwel, et al.[7]found that there is a fairly good correlation between the amount of coke and the amount of PAHs in the feedstock. Tailleur, et al.[8]studied the formation process of carbon deposition on the catalyst surface after mixing LCO, and found that the carbon deposition sites of catalyst were mainly related to the metal active sites and acid sites. However, the effects of PAHs on the catalyst deactivation have not been systematically reported during different running stages.
Therefore, a mixture consisting of 80% of straight-run diesel and 20% of FCC light cycle oil (LCO) is used as the common diesel in this paper. The effect of PAHs on the operating stability of catalyst was investigated by adding PAHs to common diesel in a pilot plant for ultralow sulfur diesel production. The mechanisms of catalyst deactivation were discussed to provide some technical guidance information for predicting the industrial operation and the development of highly stable catalysts.
2 Experimental
2.1 Catalysts and feedstocks
A commercial Ni-Mo-W/Al2O3catalyst was used for the production of ultra-low sulfur diesel. The composition and physical properties of catalysts are shown in Table 1.

Table 1 Composition and physical properties of Ni-Mo-W/Al2O3 catalyst
The feedstock containing 80% of straight-run diesel fraction and 20% of LCO was named the feedstock oil A.The raw material containing 50% of straight-run diesel fraction and 50% of LCO was named the feedstock oil B.The properties of feedstock oil A and B are shown in Table 2. According to the comparison between feedstock oil A and B, the content of PAHs and nitrogen in feedstock oil B was significantly higher due to the higher proportion of LCO. In order to further investigate whether the rapid deactivation of catalyst is related to PAHs, the feedstock oil A+PAH was obtained by adding 3% of naphthalene, 12%of 1-methylnaphthalene and 1.2% of phenanthrene into the feedstock oil A, where naphthalene, 1-methyl naphthalene,and phenanthrene were analytically pure products provided by the Sinopharm Chemical Reagents Co., Ltd.
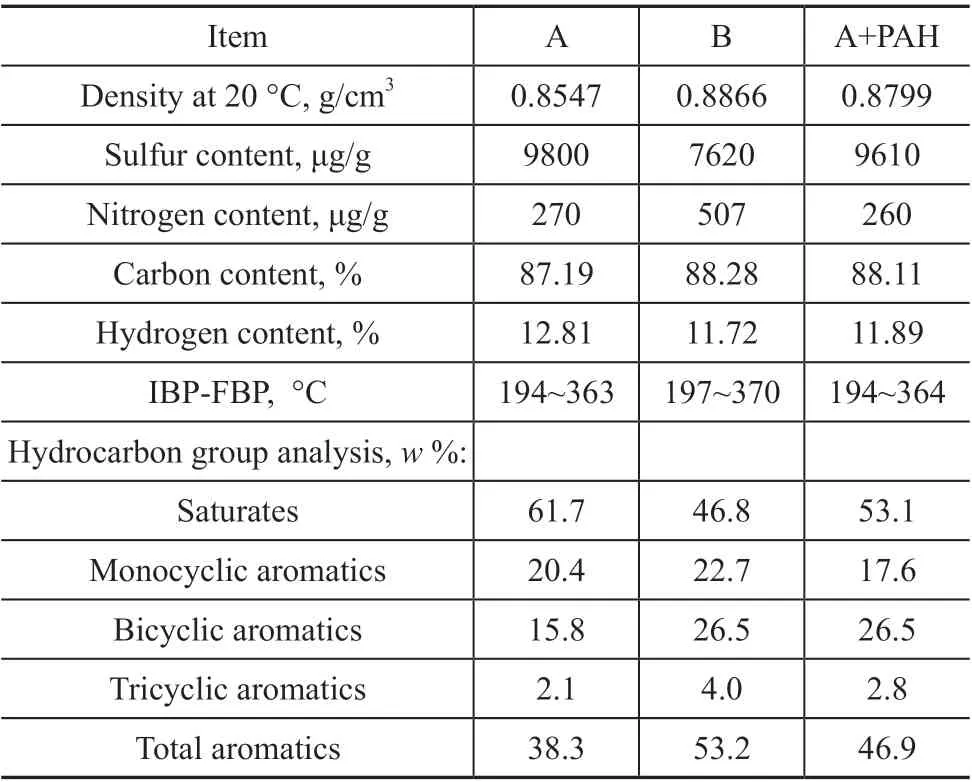
Table 2 Properties of feedstocks
2.2 Experiment condition
This experiment was conducted in a medium fixedbed hydrogenation reactor. Prior to being used in the reaction, the catalyst was subjected to presulfurization in the presence of a straight-run gas oil containing 2%of CS2, operating at a specified temperature, a hydrogen partial pressure of 6.4 MPa, a LHSV of 1.5 h-1and a H2/oil volume ratio of 300. And then the presulfurized catalyst was passivated with light diesel for 48 h to prevent an excessively high initial activity under the conditions covering a temperature of 320 °C, a hydrogen partial pressure of 6.4 MPa, a LHSV of 1.5 h-1, and a H2/oil volume ratio of 300. In this work, the beginning of passivation was regarded as the start of run (SOR).
After passivation, the feedstock began to enter the reactor operating under conditions covering a hydrogen partial pressure 6.4 MPa, a LHSV of 2.0 h-1, and a H2/oil volume ratio of 300. The temperature was adjusted continuously according to the target for production of ULSD. Catalysts of different operating time including 48 h, 248 h, 448 h,and 1048 h, respectively, were selected as the research object.
2.3 Characterization of catalysts
Before characterization, the catalysts were washed with toluene in a Soxhlet apparatus to remove adsorbed oil in the catalyst surface and pores, and were then dried for 4 h at 80 °C.
The amount of coke and sulfur deposited on the deactivated catalysts was measured by an EMIA-320-V carbon and sulfur analyzer.
The nitrogen content of catalyst was determined by an Antek 9000 total nitrogen analyzer.
The pore structure of catalyst was measured by an Autosorb-6B surface area and pore size analyzer.
The properties of coke were characterized by a Netzsch-STA 409PC-QMS403C thermal gravimetric analyzer.The air flow rate was 100 mL/min, and a heating rate of 10 °C/min in the temperature range of between 30 °C and 800 °C was used throughout the test.
The chemical states and types of active components on the surface of catalyst were determined by an ESCALAB 250 X-ray photoelectron spectrometer[9-10]. By analyzing the Ni2p, Mo3d and W4f spectra of catalysts, the degree of sulfurization of Mo(n(Mo4+)/n(Mo)), the degree of sulfurization of (n(W4+)/n(W)) and the ratio of Ni-W(Mo)-S phase (n(Ni-Mo(W)-S)/n(Ni)) of sulfurized hydrogenation catalyst could be obtained[11-12]. As for the Ni-Mo-W catalyst used in our experiments, the ratio of Ni-W(Mo)-S phase can reflect the change of the number of active centers.
The morphology of catalyst active phase was analyzed by a FEI Tecnai G2 F20 S-Twin transmission electron microscope. Due to the high content of W in hydrogenation catalyst, the test assumes that all the wafers are WS2wafers. At least 20 pictures of each sample were taken from different observation areas. The average length of WS2wafers and the average number of stacked layers are calculated according to Equations (1)and (2), respectively,

whereLiandNiare the length and layer number of thei-th grain, respectively, andnis the total number of WS2grains in the statistical area.
Since the hydrogenation reaction is mainly carried out at the edge of active site in the active phase, the ratio of edge W content to total W content, namelyfw, is used to reflect the change of the number of active centers, andfwis usually calculated according to Equations 1.3 and 1.4[13-15], as

whereWedgeis the number of W atoms at the edge;Wtotalis the total number of W atoms;tiis the number of W atoms on the edge of waferi.
3 Results and Discussion
3.1 Deactivation rate of catalysts
During the experiment, the reaction temperature was constantly regulated to produce ultra-low-sulfur diesel.Figure 1 shows the changes of the reaction temperature,when the feedstock oils A and A+PAH, respectively, were processed. It can be seen from Figure 1 that the reaction temperature increased with the operating time in order to produce the ultra-low-sulfur diesel.
According to the increase of reaction temperature, the running time within 48 - 248 h was defined as the initial stage of operation, the running time within 248 - 448 h was defined as the early stage of operation and the running time within 448 - 1048 h was defined as the middle stage of operation. The data of each stage in Figure 1 show the deactivation rate of catalyst.

Figure 1 Effect of PAHs on the running stability of catalyst
It can be seen from Figure 1 that PAHs had little effect on the initial activity of catalyst, and the reaction temperature is increased by 1 - 4 °C. However, PAHs significantly accelerated the deactivation of catalyst, and the deactivation rate of catalyst was 5 times that of catalyst for processing feedstock oil A. When the feedstock oil A+PAH was processed, the reaction temperature had reached 390 °C after 848 h. By comparing the deactivation rate of the catalyst at different running stages, it can be seen that PAHs may be the main reason for the rapid deactivation of catalyst.
3.2 Elemental analysis
Table 3 shows the amount of C element contained in the catalyst of this study.
According to Table 3, the amount of carbon deposited on the catalyst increased significantly with the extension of running time. At the same running time, the amount of carbon deposits increased obviously when processing the feedstock oil A+PAH. The competitive adsorption of
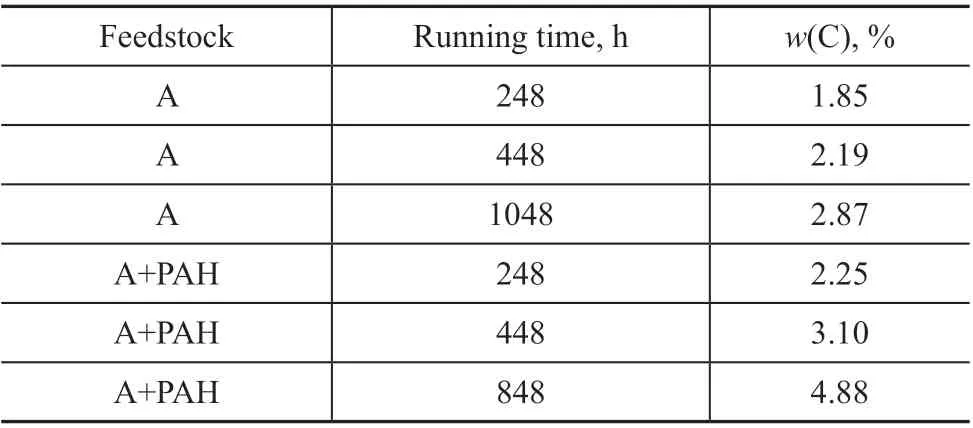
Table 3 Amount of C element contained in the catalyst
PAHs on the catalyst surface leads to the rise of reaction temperature. However, the saturation of PAHs is a highly exothermic reaction. High operating temperature will accelerate the polymerization of PAHs into carbon deposits[16].
The relationship between reaction temperature and carbon deposit with operating time is shown in Figure 2. It can be seen from Figure 2 that no matter whether the feedstock oils A or A+PAH are processed, the change of reaction temperature shows an obvious correlation with the change in catalyst carbon deposit. It shows that the deactivation of catalyst is closely related to the formation of carbon deposits.

Figure 2 Relationship between catalyst activity and carbon deposits
3.3 BET analysis
The catalyst surface, the pore volume and the average pore diameter were investigated. The results are shown in Table 4.
It can be seen from Table 4 that when processing feedstock oil A, the catalyst surface area and pore volume decreased gradually with an increasing running time.However, when processing feedstock oil A+PAH thecatalyst surface area and pore volume already decreased significantly in the middle stage (448 - 848 h).

Table 4 BET analysis of different running time catalysts
This might be due to the low reaction temperature in the early stage, and the increase of PAHs content in the feedstock has little influence on the structure of catalyst.When the reaction temperature increases, the PAHs will undergo dehydrogenation or polycondensation reactions to form more carbon deposits. This part of carbon deposits may grow up rapidly in the three-dimensional space and block the pores of catalyst[17]. Fernando, et al.[18]have showed that the thickness of MoS2wafer is generally 0.615 nm and the lateral size is 1.0 - 1.5 nm. When the amount of carbon deposit is small, the thickness of carbon deposition is less than 0.5 nm, and the pore structure of catalyst would not be greatly affected.However, when the amount of carbon deposit continues to increase, the thickness of carbon deposition is above 0.7 nm. When the catalyst surface area and pore volume decrease significantly, the deactivation of catalyst would take place.
3.4 TG-MS analysis
The thermogravimetric (TG) curves of catalyst obtained after different operating times are shown in Figure 3, and the mass spectra (MS) of catalysts are shown in Figure 4.According to Figure 3, there are three distinct zones in the TG curve obtained after different running time[19-20]. The first zone, which covers the initial temperature to 200 °C,is mainly caused by the volatilization of a small amount of water and a relatively low molecular weight residue on the catalyst. The second zone is in the range of 200°C <T< 350 °C, and this area might contain amorphous carbon. The third zone is in the range of 350 °C <T<700 °C, and this area might contain carbon compounds with higher condensation degree.

Figure 3 TG curves for the catalysts obtained after different running time

Figure 4 Mass spectral fitting curves of catalyst in different time on stream(a)H2O; (b)CO2; (c)SO2; (d)NO2
According to Figure 4, no matter whether processing feedstock oil A or A+PAH, there is little difference in the position of H2O spectral peak. The spectral peaks of CO2, SO2and NO2in the high temperature region were identified at around 510 °C.
To accurately determine the peak position of CO2mass spectra, the method of fitting peak process was adopted to deal with CO2mass spectra. By taking the catalyst for processing feedstock oil A after having run for 248 h as an example, the specific fitting position is shown in Figure 5. The specific data of CO2spectral peaks are shown in Table 5.
According to Figure 5, the CO2mass spectra show three characteristic peaks at 280 °C (Type 1), at 420 °C (Type 2) and at 510 - 520 °C (Type 3), respectively. Combined with the mass spectral peak of H2O in Figure 4, it can be seen that the mass spectral peak area of H2O is relatively high at about 280 °C, indicating that the H/C mole ratio of type 1 carbon deposit is relatively high and the degree of condensation of carbon deposit is relatively low. At the same time, compared with the mass spectral peak of SO2in Figure 4, it can be seen that there is also an obvious spectral peak of SO2at about 280 °C. This peak may be caused by the oxidation of the active metal sulfide[21].Therefore, the type 1 carbon deposit may be the carbon deposit associated with catalytic activity. Similarly,through the analysis of carbon deposits of type 2 and type 3, it can be seen that the condensation degree of carbon deposition of type 2 is slightly higher than that of type 1,and the condensation degree of carbon deposition of type 3 is the highest. In addition, upon combining with the mass spectral peak of SO2, it can be seen that there is also an obvious spectral peak of SO2at around 510 °C, which may be mainly formed by the pyrolysis of organic sulfide in high-temperature carbon deposit. Matsushita, et al.[22]also showed that the high temperature spectrum peak of SO2was mainly formed by the combustion of organic sulfide contained in the carbon deposit.
According to Table 5, the increase of PAHs mainly promoted the formation of the type 3 high-temperature carbon deposit. The peak positions of each type of carbon deposit are basically the same for different catalysts,indicating that the types of carbon deposits are consistent.As for different catalysts, the peak area and carbon amount of the type 1 and type 2 carbon deposits have little change. The peak area and carbon amount of the type 3 carbon deposit increase gradually with an increasing running time. Besides, the increase of PAHs mainly promoted the formation of the type 3 high-temperature carbon deposit.
In order to further analyze the relationship between catalyst deactivation and types of carbon deposits, the relationship between the reaction temperature and the carbon deposit is shown in Figure 6.

Figure 5 CO2 mass spectra fitting curve of catalysts after having operated for 248 h
According to Figure 6, the changes of reaction temperature were significantly correlated with the changes of the type 3 carbon deposit. These facts indicate that deactivation of catalyst was related to the type 3 hightemperature carbon deposit. The accumulation of type 3 carbon deposit not only can significantly cover the edge of the active phase structure of Ni-W(Mo)-S, but also may block the pores of catalyst, which eventually can lead to the rapid deactivation of catalyst[23-25].
3.5 XPS analysis
The chemical states of Ni and W elements on the surface of the catalyst were analyzed. By taking the catalyst for processing feedstock oil A after having run for 248 h as an example, the peak fitting of W and Ni species on the catalyst is shown in Figure 7. In this paper,n(W4+)/n(Al)andn(Ni-W(Mo)-S)/n(Al) were used to representthe dispersion of the active metals. The characterization results of catalyst XPS are shown in Table 6.It can be seen from Table 6 that the sulfurization degree of W, the proportion of Ni-W(Mo)-S phase and the dispersion of active metals all decreased gradually.However, when the feedstock oil A+PAH was processed,the sulfurization degree of W, the proportion of Ni-W(Mo)-S phase decreased significantly in the operating period of 448 - 848 h.

Table 5 CO2 peaks position and proportion of catalysts after having operated for different time
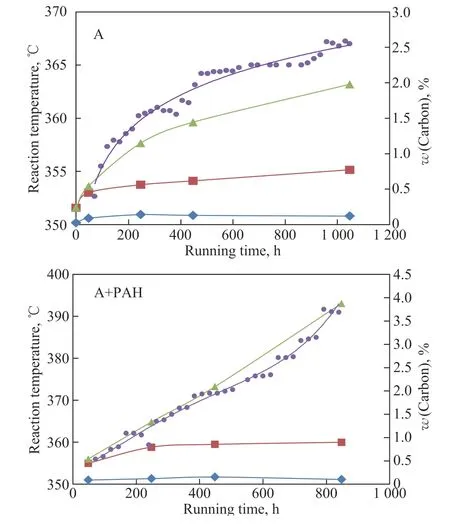
Figure 6 Relationship between reaction temperature and carbon deposit

Table 6 XPS characterization results for different catalyst operation time

Figure 7 High-resolution XPS spectra of W4+and NiW(Mo)S regions
This may be due to the obvious increase of reaction temperature and catalyst carbon deposition in this period.The layered structure of the active phase is subjected to strong adsorption of hydrocarbon species on the surface of catalyst, and the formation of low active Ni species(Ni2+or NixSy), which all will lead to the decrease of the sulfurization degree of W and the proportion of Ni-W(Mo)-S phase[26-27].
3.6 HRTEM analysis
HRTEM can be used to observe the morphology of the active phase of hydrogenation catalyst from the microscopic point of view, and provide intuitive information such as the grain size, quantity, and stacking situation of WS2. The average number of wafer stacking layers and average wafer length are usually used to describe the morphology of the active phase.The average number of wafer stacked layers affects the adsorption state of reactants on the active site, and the average length of wafer affects the number of side sites.Twenty pictures of each sample were taken, and then the images were automatically identified by the Pipeline Pilot software for statistics. Figure 8 shows typical HRTEM example images of catalysts obtained after different running times. Table 7 shows the changes of average stacked layers, average length of WS2wafer and the values offw.As shown in Table 7, when the feedstock oil A was processed, the average stacked layers of WS2wafers gradually decreases, the average length gradually increases, and the values offwgradually decreases with the extension of running time. When the feedstock oil A+PAH was processed, the changes are more obvious.This may be due to the fact that the WS2multilayer wafers formed by the van der Waals force are influenced by temperature and carbon deposits. With the increase of running time, the amount of carbon deposit increases and the reaction temperature rises. WS2multilayer wafers will eventually tend to stabilize in a monolayer structure.At the same time, the wafer length increases and the proportion of edge W decreases.

Figure 8 HRTEM images of catalysts at different running time

Table 7 The statistical results of observed WS2 stripes on catalyst
3.7 Comprehensive analysis
Combined with the previous analysis, the changes of deactivation rate, carbon deposition rate, pore volume loss rate, edge W ratio reduction rate and Ni-W-S phase ratio loss rate in different running stages were statistically analyzed. In order to find the main mechanisms leading to catalyst deactivation, the software of SPSS statistics was used to conduct partial correlation analysis. The specific data are shown in Table 8. Partial correlation analysis is the study of the correlation of two variables under the control of other variables. The results of partial correlation analysis include partial correlation coefficient and non-correlation probabilityP. Partial correlation coefficient represents the linear correlation of two variables. The closer the value is close to 1, the higher the degree of linear correlation is. The closer thePvalue of the uncorrelated probability is close to 0, the higher the degree of correlation exists between the two variables[28].
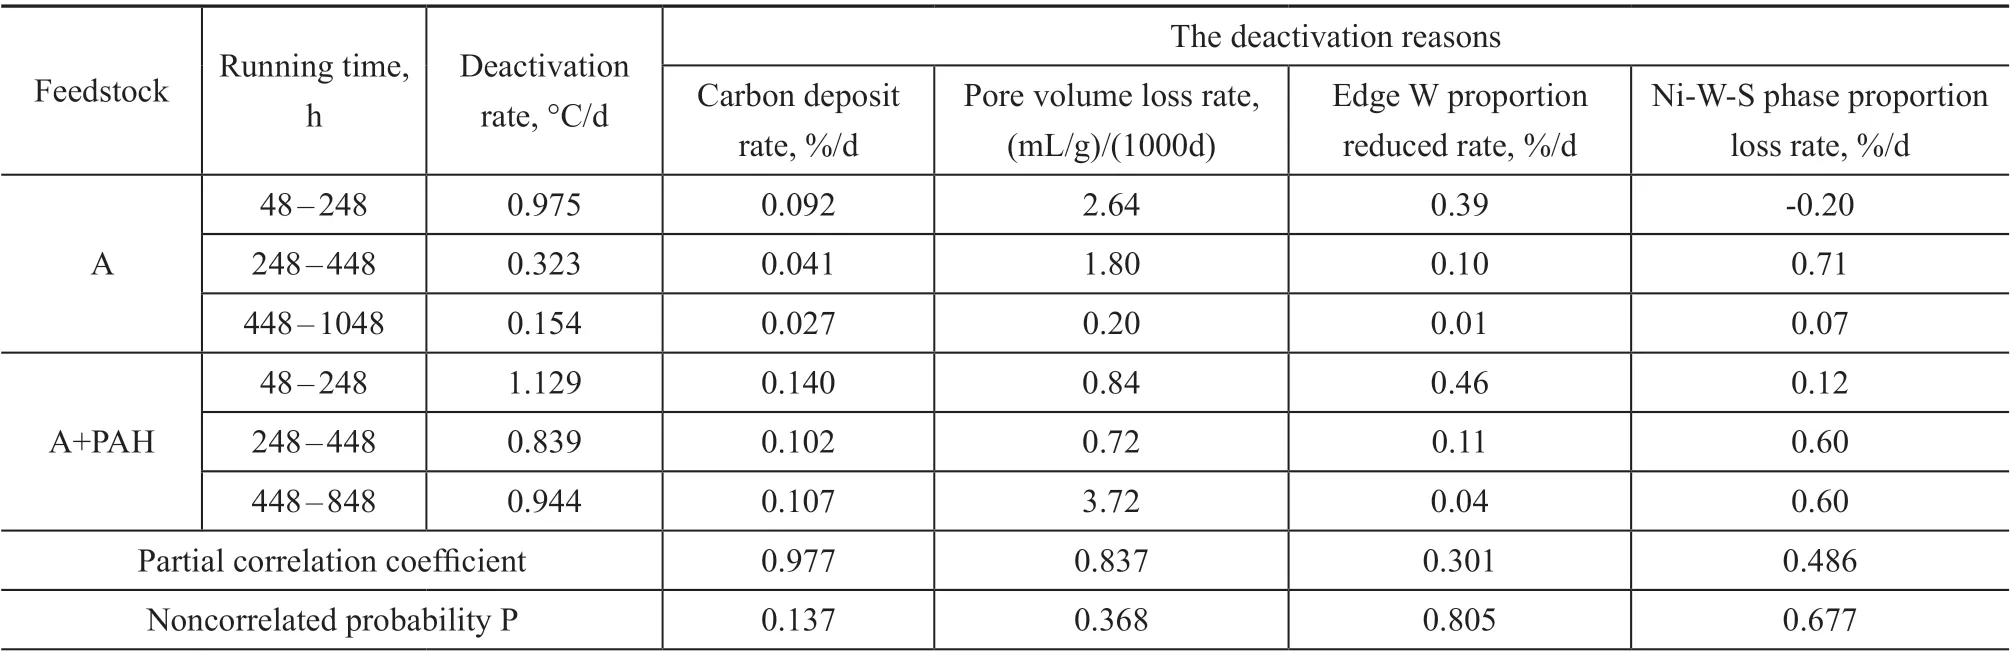
Table 8 The factors of catalyst deactivation at different running time
According to Table 8, the partial correlation coefficient between catalyst deactivation rate and carbon deposition rate is 0.977, and thePvalue is 0.137. The partial correlation coefficient between catalyst deactivation rate and pore volume loss rate is 0.837, and thePvalue is 0.368. However, the partial correlation coefficient of edge W proportion reduction rate and Ni-W-S phase proportion loss rate are relatively low, and thePvalue is relatively high, indicating that there is no significant correlation between the two factors and the catalyst deactivation rate.According to the above analysis, the formation of carbon deposits on the catalyst and the loss of pore volume may be the main reasons of catalyst deactivation.
4 Conclusions
Based on the above experimental results and discussion,the following conclusions can be drawn:
(1) During processing of the commonly used diesel fuel, the deactivation rate of catalyst is the fastest at the beginning of operation, and then the catalyst gradually enters into stable deactivation in the middle stage of operating cycle.
(2) When the amount of PAHs increased, the deactivation rate of catalyst was also more obvious in the initial stage of operation. However, the increase of PAHs significantly accelerated the deactivation of catalyst in the middle stage of operation.
3)The carbon deposits on the deactivated catalyst can be divided into three types and the catalyst deactivation was largely determined by the amount of high-temperature carbon deposits.
4)According to the analysis of catalyst deactivation, the catalyst deactivation is mainly related to the formation of carbon deposition and the loss of pore volume.Acknowledgement: This work was financially supported by the Hydrogenation Process and Hydrogenation Catalyst Laboratory (RIPP, SINOPEC). All of the staff in our laboratory had provided a lot of support in the analysis of oil samples and catalyst characterization.
- 中國煉油與石油化工的其它文章
- Photocatalysts for Photocatalytic CO2 Reduction: A Review
- A Novel MIL-101(Cr) Acidified by Silicotungstic Acid and Its Catalytic Performance for Isomerization of n-Heptane
- Assembling Fe2O3/BiOCl Composite for Highly Effective Degradation of Water Pollutants under Visible-Light Irradiation
- Role of Heating Condition in Polyethylene Behaviors under Nitrogen and Air Atmosphere
- Hydrodynamic Instability Analysis of the Axial Flow Pump in an Ethylene Polymerization Loop Reactor
- Analysis of Influence Factors for FCC Slurry Separation by Mixed Solvent Extraction