Magnetic probe diagnostics of nonlinear standing waves and bulk ohmic electron power absorption in capacitive discharges
Kai ZHAO (趙凱), Yo ngxin LIU (劉永新), Quanzhi ZHANG (張權(quán)治),Demetre J ECONOMOUand Younian WANG,?
1 Key Laboratory of Materials Modification by Laser, Ion, and Electron Beams (Ministry of Education),School of Physics, Dalian University of Technology, Dalian 116024, People?s Republic of China
2 Plasma Processing Laboratory, William A.Brookshire Department of Chemical and Biomolecular Engineering, University of Houston, Houston, Texas 77204-4004, United States of America
Abstract It is recognized that standing wave effects appearing in large-area, very-high-frequency capacitively coupled plasma (CCP) reactors cause center-high plasma non-uniformity.Using a high-frequency magnetic probe, we present a direct experimental diagnostic of the nonlinear standing waves and bulk ohmic electron power absorption dynamics in low pressure CCP discharges for different driving frequencies of 13.56, 30, and 60 MHz.The design, principle,calibration,and validation of the probe are described in detail.Spatial structures of the harmonics of the magnetic field,determined by the magnetic probe,were used to calculate the distributions of the harmonic current and the corresponding ohmic electron power deposition, providing insights into the behavior of nonlinear harmonics.At a low driving frequency, i.e.13.56 MHz,no remarkable nonlinear standing waves were identified and the bulk ohmic electron power absorption was observed to be negligible.The harmonic magnetic field/current was found to increase dramatically with the driving frequency, due to decreased sheath reactance and more remarkable nonlinear standing waves at a higher driving frequency,leading to the enhancements of the ohmic heating and the plasma density in the bulk,specifically at the electrode center.At a high driving frequency, i.e.60 MHz, the high-order harmonic current density and the corresponding ohmic electron power absorption exhibited a similar node structure,with the main peak on axis, and one or more minor peaks between the electrode center and the edge,contributing to the center-high profile of the plasma density.
Keywords: capacitively coupled plasmas, magnetic probe, nonlinear standing waves, ohmic heating
1.Introduction
The magnetic field distribution is of importance in various fields such as space plasmas, astrophysics, particle accelerators, and laboratory radio frequency (rf) plasmas.The socalled magnetic probe has proven to be a workhorse in magnetic diagnostics across these fields [1–25].Specifically,in inductively coupled plasmas, magnetic diagnostics are crucial,since it is the time-varying magnetic field that induces an electric field sustaining the discharge.Measurements of the magnetic field allow derivation of the current density,electric field and power deposition, providing insights into important physics [6–16].The magnetic probe was also employed to investigate fast transients in exploding plasmas [17, 18],plasma acceleration in Hall thrusters[19,20],and the toroidal and poloidal structures of different magnetohydrodynamic modes in magnetically confined fusion plasmas [21–25].
In spite of the vast body of literature on magnetic probes,reports on magnetic field measurements in capacitively coupled plasmas (CCP) remain sparse.This could be due to the fact that the magnetic field is inherently weak in these discharges.More importantly, the strong plasma potential fluctuations in CCP can cause serious capacitive interference on the magnetic probe,making the magnetic field measurements very challenging.
Currently, large-scale CCP reactors driven at excitation frequencies higher than the conventional 13.56 MHz have received growing attention, especially in the semiconductor and display industries[26–48].Larger reactors are required to accommodate larger substrates, and higher excitation frequencies can produce enhanced plasma density (improving throughput) with reduced ion bombardment energy (minimizing substrate damage) [26–29].However, when the reactor dimensions become comparable to the in-plasma wavelength of the excitation source,electromagnetic standing wave effects (SWE) come into play and cause center-high plasma non-uniformity, severely limiting the use of largerarea reactors and higher excitation frequencies [30–42].In these and other studies,researchers focused on the role of the fundamental frequency on the SWE.Nevertheless, the selfexcitation of higher harmonics enhanced by the plasma series resonance (PSR) [49, 50] and the effect of these nonlinear harmonics on the bulk electron power absorption dynamics were not taken into account.Recently, a close relationship between the harmonic excitations and center-high plasma non-uniformity was demonstrated by experiments [51–53].Subsequently, the excitation of nonlinear standing waves enhanced by PSR was predicted by theory [54, 55], and demonstrated by experiment[56].While a good agreement in the spatial structure of the harmonic magnetic field between experiment and simulation was shown in [56], experimental measurement of radial distributions of the harmonic current and the electron power absorption was not presented there.More recently, it was predicted that at a high excitation frequency, the interaction between the nonlinear higher harmonics and the plasma would lead to enhanced electron heating in the bulk plasma, significantly affecting the local plasma parameters such as the electron density and electron energy distribution function, even at relatively low pressures[44, 47, 48, 57].In order to gain insights into the fundamentals of the nonlinear interaction of electromagnetic waves with the plasma,a magnetic probe is a superb diagnostic tool to measure the harmonic magnetic field/current density,thereby determining the corresponding electron power deposition.
Efficient capacitive pickup rejection and high bandwidth are two basic requirements of the magnetic probe for accurately measuring the harmonic magnetic fields in CCPs.While the magnetic sensitivity is proportional to the crosssectional area of the probe coil, a small size probe coil is preferred in order to minimize plasma disturbance by the probe, and also decrease the probe capacitive pickup caused by the plasma potential oscillations.Furthermore, a smaller probe coil provides improved spatial resolution and better high-frequency response.Generally, one can connect a coaxial cable in series with the probe to suppress the capacitive pickup [58].An alternative method is to introduce a center-tapped transformer which, however, limits the probe bandwidth [59–61].
In this work,we present an experimental investigation of the nonlinear standing waves and the bulk ohmic electron power absorption in low pressure capacitive discharges by using a high-frequency magnetic probe.Based upon the measured spatial structures of the harmonic magnetic fields,spatial distributions of the harmonic current and the corresponding bulk ohmic electron power absorption were deduced using Ampere’s law.Specifically,the dependence of the bulk ohmic electron power absorption on the driving frequency was examined.It was found that at a low driving frequency (i.e.13.56 MHz), the nonlinear standing wave excitation was quite weak and the bulk ohmic electron power absorption played a negligible role.By contrast, remarkable nonlinear standing waves were identified at a higher driving frequency (i.e.60 MHz), leading to the enhancements of the ohmic heating and the plasma density in the bulk,specifically at the electrode center.The radial profiles of the bulk ohmic electron power absorption for the first six harmonics of each driving frequency were presented and discussed.
2.Experimental
2.1.Experimental setup
A schematic diagram of the experimental setup is illustrated in figure 1.The plasma was sustained between two parallel plate circular electrodes (each 30 cm in diameter), with a separation of 4 cm.Argon working gas was injected through the showerhead top electrode into the chamber, with a 30 standard cubic centimeters per minute (sccm) flow rate.A turbomolecular pump was used to evacuate the chamber with a base pressure below<10?3Pa.The total pressure was kept at 3 Pa for all experiments.Asignal,generated by a function generator (Tektronix AFG31252),was amplified by a broadband power amplifier (AR, Model 1000A225)and then delivered through a matching network to the top electrode.The bottom electrode and the chamber wall were grounded.Note that while the two electrodes were equal in diameter,the discharges were expected to be geometrically asymmetric since the presence of the grounded sidewall essentially increased the effective area of the grounded electrode.A magnetic probe (described in section 2.2) and a hairpin probe [41, 62, 63] were mounted on separate translational stages (see figure 1) for the measurements of the magnetic field and the electron(plasma)density,respectively.
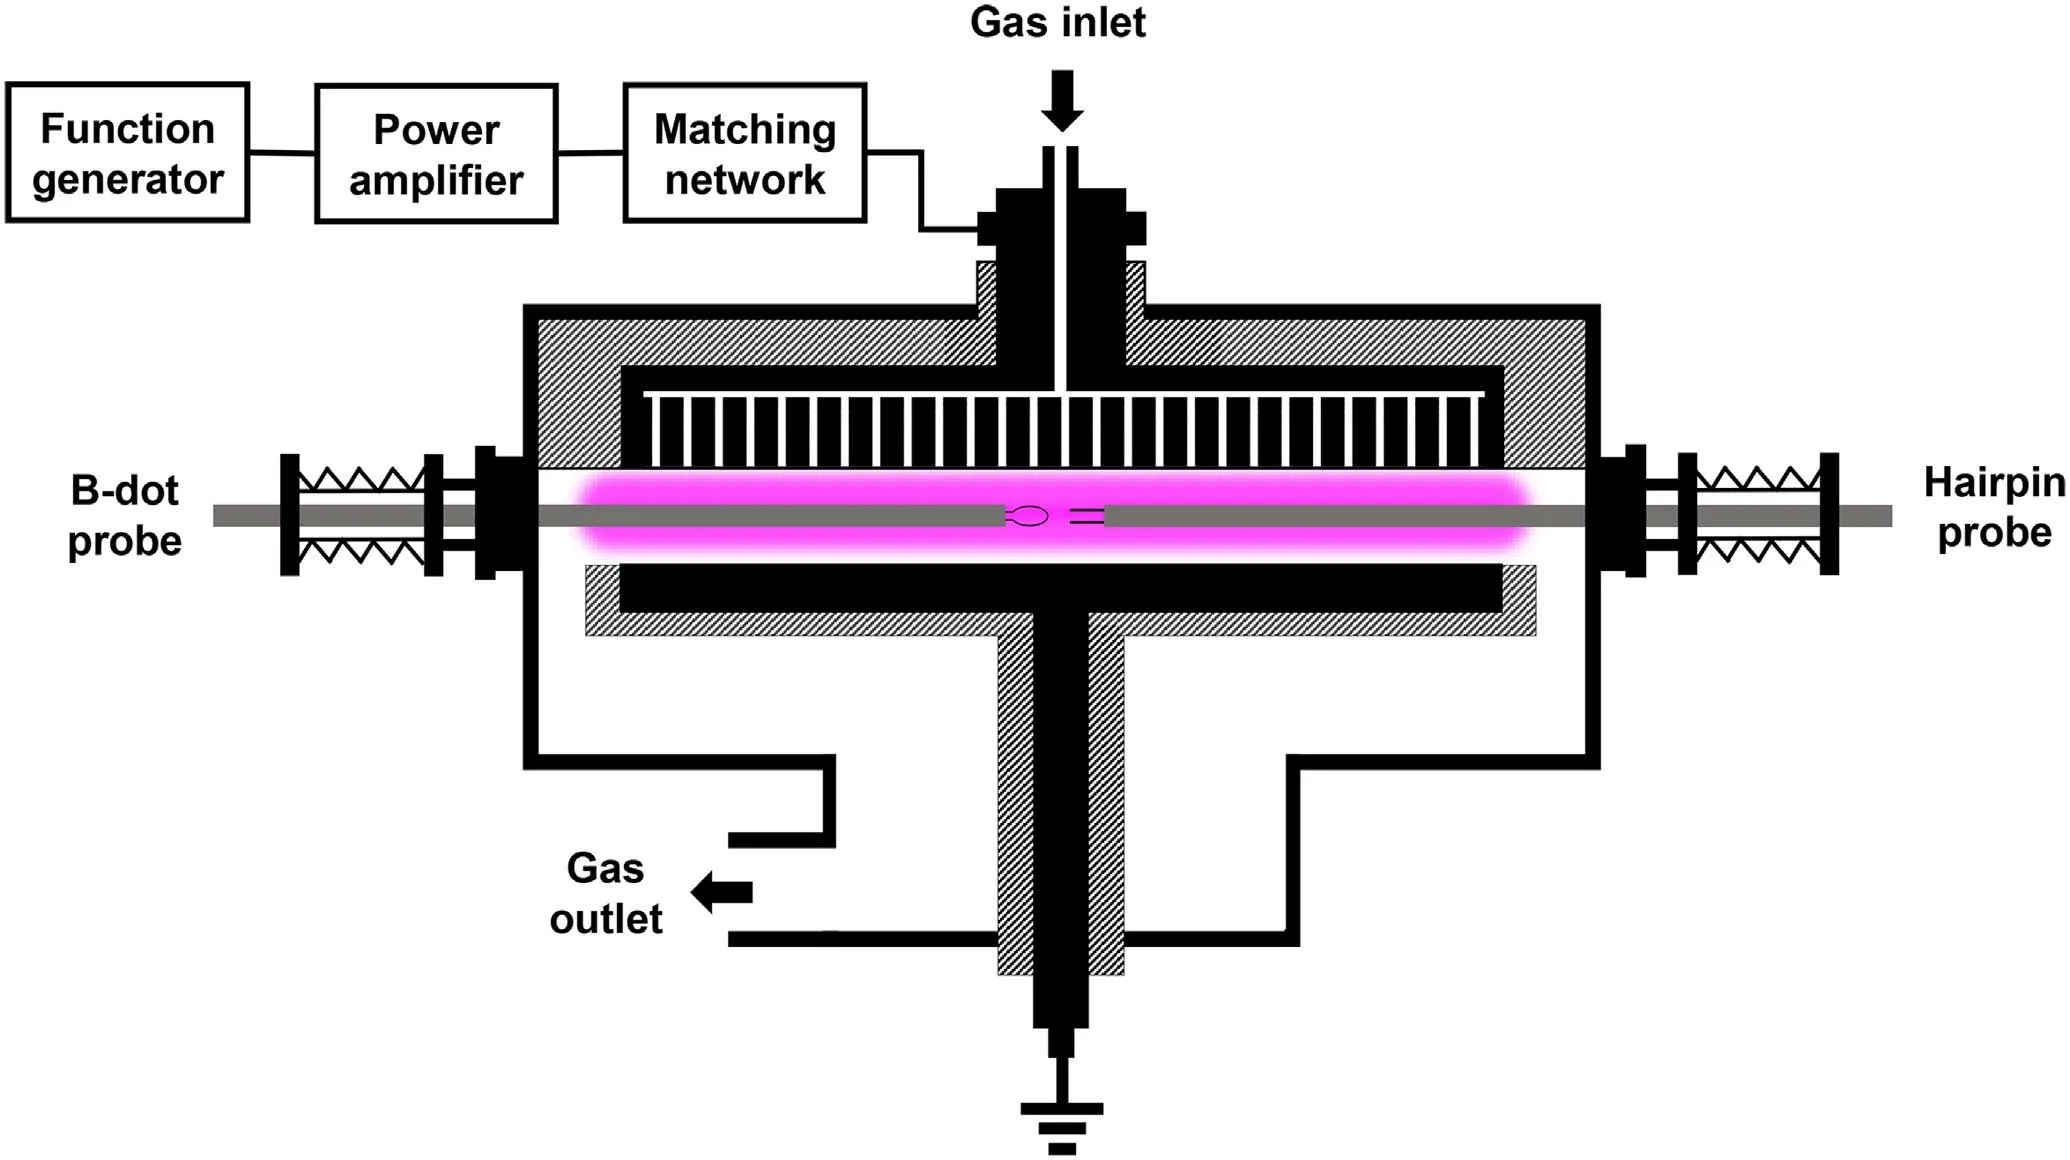
Figure 1.A schematic of the experimental setup.
2.2.Design, principle, calibration, and validation of the magnetic probe
In this subsection, we present a detailed description on the design, principle, calibration, and validation of the magnetic probe.The magnetic probe used in this work is schematically illustrated in figure 2.The probe was fabricated using a thin semirigid coaxial cable (SFT50-1), 1.19 mm in outer diameter.At the middle point of the cable,the outer conductor was peeled off, leaving a small gap with an approximate length of 2 mm.The cable was bent back upon itself at the middle point, around which an elliptical loop was formed.The height (5 mm) of the probe coil was much smaller than the electrode separation (40 mm), to reduce the capacitive interference by the axial non-uniformities of the electric field/plasma potential on the probe coil.The probe coil was long enough (10 mm) to increase the cross-sectional area of the coil, thus enhancing the magnetic induction signal, yet small enough to improve spatial resolution and minimize plasma perturbation.Except for the loop, the outer conductors of the two halves of the cable were soldered together,and connected to ground.Unlike previous probes[2,3,61]where almost all of the probe coils were immersed in the plasma, here only a small fraction of the coil (the peeled part) was directly coupled to the plasma.The rest of the probe coil was shielded by the outer conductor of the semirigid coaxial cable, which played a crucial role in preventing the probe from picking up contaminating signals via capacitive-coupling interference.Note that, while there was a shielding layer on the surface of the probe coil, the outer diameter of the coil was still very small (only 1.19 mm).Such a mini configuration differentiated this probe from the conventional encapsulated probe(i.e.the probe coil is entirely enclosed in a dielectric shell),for which the large dielectric shell would bring about significant distortion of the rf current path around the probe,causing considerable error in determining the magnetic field [64].
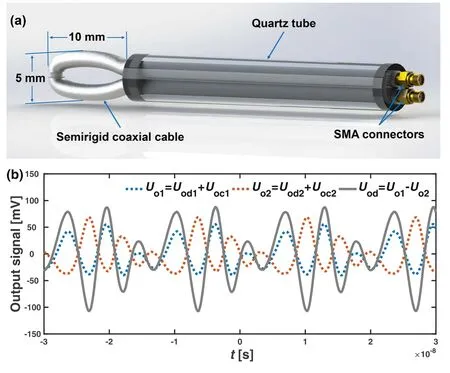
Figure 2.(a)A schematic of the high-frequency magnetic probe and(b) its output signals.In figure 2(b), based on the symmetry of the probe circuit, capacitive-coupling interference can be eliminated effectively by subtracting the signals Uo1 (the blue dotted line) and Uo2 (the red dotted line)at two output ends,yielding a virtually pure inductive signal Uod (the gray solid line).
The semirigid coaxial cable was inserted into a supporting quartz tube, which was also used to prevent intimate contact with the plasma.The two ends of the semirigid coaxial cable were terminated with SMA connectors, which were in turn connected to the input channels of a digital oscilloscope (Tektronix MSO56, 2 GHz bandwidth).Note that a high bandwidth of the instrument is quite crucial for sensitively detecting the high-order harmonics of the magnetic field.A MATLAB Instrument Control Toolbox was employed to communicate with the oscilloscope, enabling online data collection and analysis.The time-domain signal provided by the magnetic probe was converted into the frequency domain via fast Fourier transform (FFT), and calibrated by a Helmholtz coil,giving the absolute amplitudes of all harmonic magnetic fields.
Generally, the magnetic probe output contains both (i) a differential-mode (DM) inductive signal due to the time derivative of the magnetic flux, and (ii) a common-mode(CM) capacitive signal caused by the coupling between the probe coil and the plasma.Two distinct circuit models were proposed to elucidate the working principle of the magnetic probe,as shown in figure 3.For the DM case(figure 3(a)),the voltage induced in the probe coil was equivalent to a voltage sourceUid(t).The characteristic impedances of two cables were Z1= Z2= Z0, and the input impedances of the two channels of the oscilloscope wereZin1=Zin2=Zin0.The induced current in the probe coil,Iid(t),flowed down throughZ1→Zin1→Zin2→Z2and then went back to the source.According to the transmission-line theory [65], the voltage drop across the load,Uod(t), can be deduced from the input terminal voltageUid(t) by

Figure 3.Equivalent circuits of the magnetic probe for (a) the DM signal and (b) the CM signal.
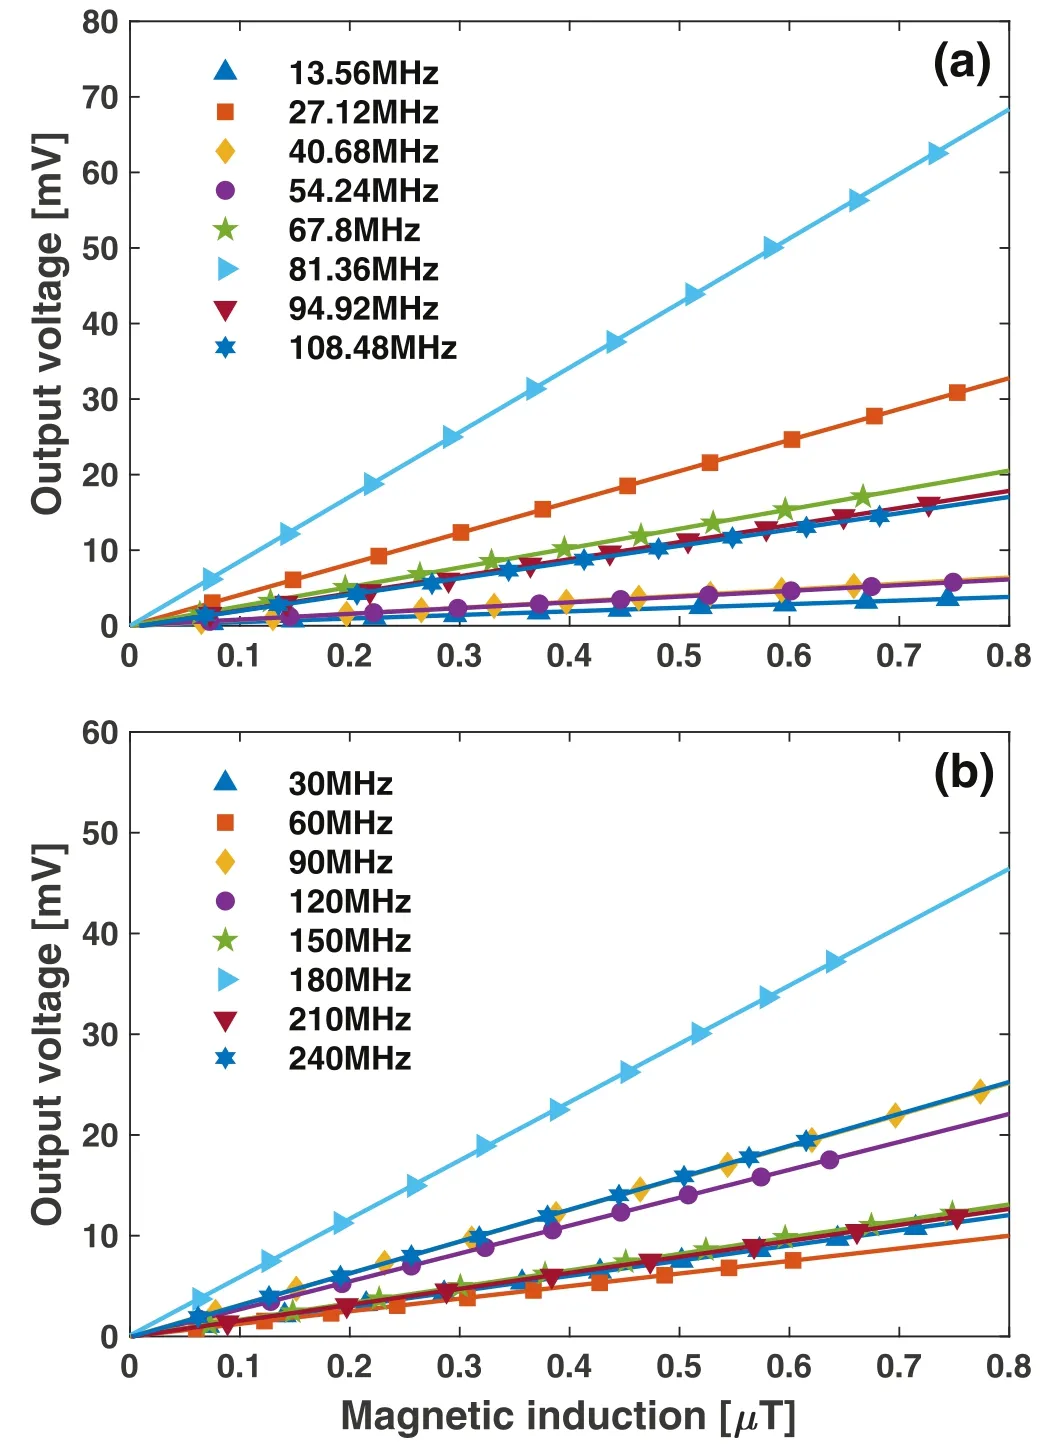
Figure 4.The probe output voltage as a function of the magnetic induction for the first eight harmonics of (a) 13.56 MHz and(b) 30 MHz.

whereUod1(t)andUod2(t)were output voltages of two coaxial cables, and γ and l were the complex propagation constant and the length of each coaxial cable, respectively.
For the CM case (figure 3(b)), the capacitive coupling between probe coil and plasma was equivalent to a voltage sourceUic(t).The current,Iic(t),flowed through two identical branches, i.e.Z1→Zin1andZ2→Zin2, and went to ground.Based on the symmetry of the circuit, i.e.Z1= Z2andZin1=Zin2, the voltages at the output ends of two coaxial cables were equal,Uoc1(t) =Uoc2(t) =Uic(t) cosh(γl)-Iic(t)Z0sinhThus, the load voltage dropUoc(t),Summing equations (1) and (2), one can see that the CM interference can be eliminated efficiently by subtracting the signals at two output ends,yielding the desired DM inductive signal (see figure 2(b)).

It should be noted that,while the use of an additional signal processing circuit, e.g.a tunable center-tapped transformer, can further increase the signal-to-noise ratio, the presence of the passive components (capacitors and inductors) in the circuit significantly decreases the probe bandwidth[58].For this reason,no signal processing circuit was employed in this magnetic probe.The frequency response of the magnetic probe was examined by a Helmholtz coil [61].The Helmholtz coil was constructed with a pair of single-turn loops with a radiusR0=35 mm, separated by 35 mm.A sinusoidal signal(13.56–240 MHz, 0–20 V), produced by a function generator(Tektronix AFG3252C),was applied to the Helmholtz coil.The currentIcoilin the Helmholtz coil was measured by a current monitor (Pearson 6585), through which the magnetic induction B0at the center of the Helmholtz coil can be determined bywhereμ0= 4π× 10-7T m A?1is the permeability in free space,and N represents the number of turns of the Helmholtz coil.Experimentally measured probe output voltage as a function of the magnetic induction, for the first eight harmonics of 13.56 MHz and 30 MHz,is displayed in figures 4(a) and (b), respectively.For each frequency tested, a linear dependence of the probe output voltage versus magnetic induction can be observed.The magnetic probe exhibited a considerable magnetic sensitivity (i.e.the ratio of the probe output voltage to the magnetic induction)over a wide frequency range and,thus,it can be suitable for sensitive measurements of high frequency magnetic fields in VHF CCP reactors.
The magnetic probe was examined in the CCP, shown in figure 1, to validate its performance.Based on azimuthal symmetry of the cylindrical CCP reactor, the magnetic field was expected to be axisymmetric and purely azimuthal.Measurements were performed for three probe orientations; i.e.φ= ±π/2 to detect the azimuthal component of the magnetic induction,φB, and φ = 0 to detect the axial component of the magnetic induction, Bz.Figures 5(a)–(c) show the measurement results for discharges driven at three different excitation frequencies(13.56,30,and 60 MHz),with a net power of 40 W and a gas pressure of 3 Pa.In each figure,the top panel shows the raw signals from the magnetic probe for the three orientations,whereas the bottom panels show the corresponding FFT spectra.For each frequency tested,the output signals forare nearly symmetric with respect to the abscissa(see figures 5(a1),(b1), and (c1)), indicating that they are out of phase with each other.Besides,for each harmonic,the amplitudes corresponding toφ= ±π/2 are essentially identical (see fgiures 5(a2)–(a3),figures 5(b2)–(b3), and figures 5(c2)–(c3)).These results coincide with the fact that by reversing the applied magnetic field,the polarity of induced voltage in the probe coil will be reversed,while the amplitude will keep unchanged.Furthermore,for each harmonic, the amplitude of the probe output at φ = 0(figures 5(a4),(b4), and(c4)) is negligible compared to those atφ= ±π/2 (figures 5(a2)–(a3), figures 5(b2)–(b3), and figures 5(c2)–(c3)) configurations, in accordance with the fact that Bz= 0 in a CCP.These results demonstrate that the magnetic probe provides reliable measurements.
2.3.Calculations of current density and ohmic power deposition

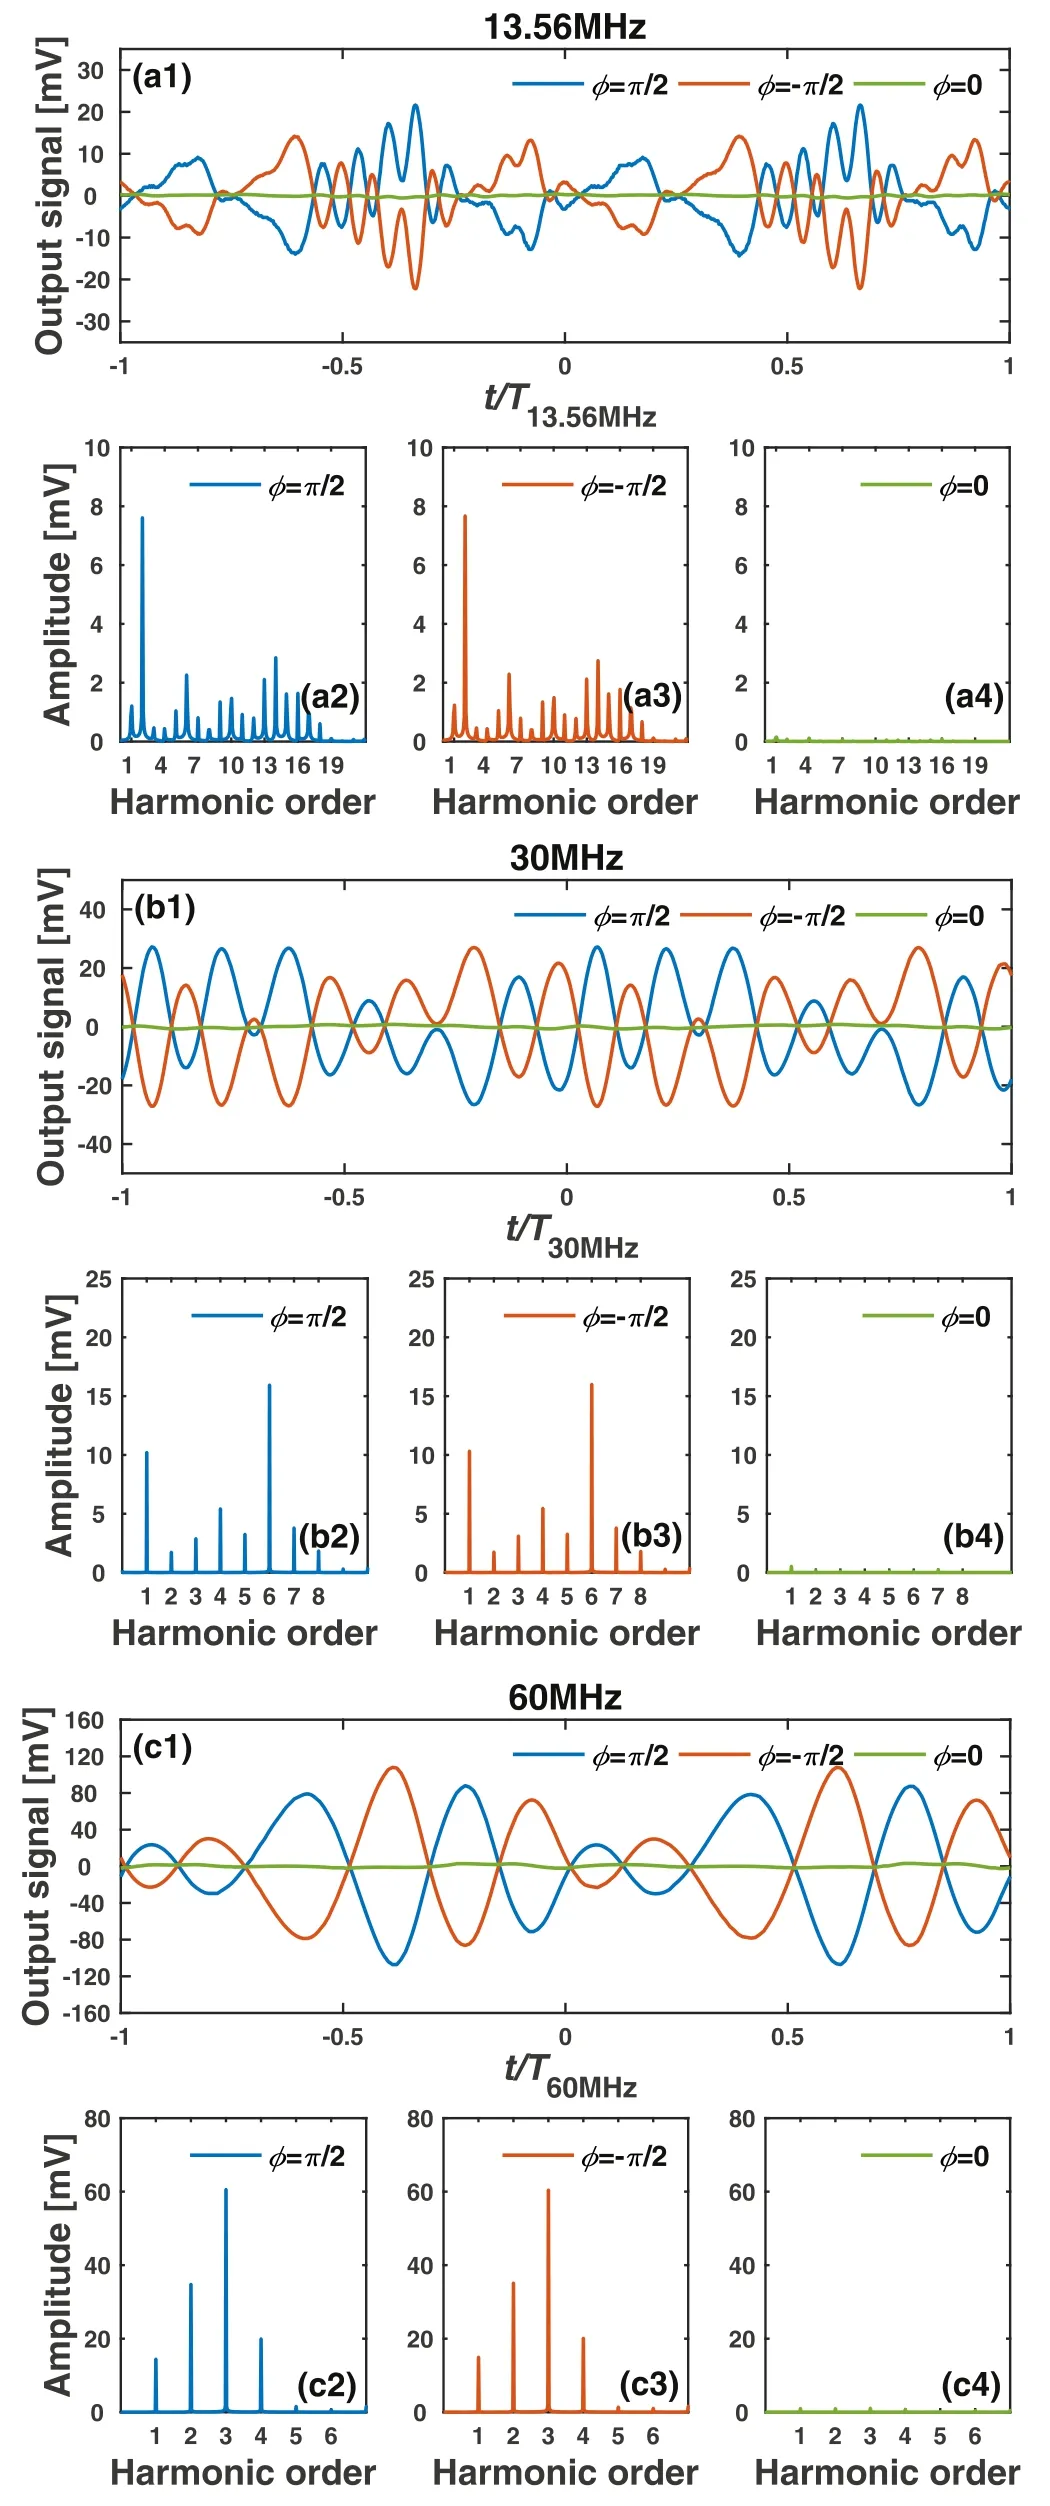
Figure 5.Raw signals from the magnetic probe (top panel), and the corresponding FFT spectra (bottom panels), for three probe orientations (φ= 0,±π/2) in a CCP reactor driven at (a)13.56 MHz, (b) 30 MHz, and (c) 60 MHz.The measurement point was located in the mid-plane of the electrodes at r = 6 cm.Discharges were operated in argon at 3 Pa and 40 W.

Assuming that the magnetic field has N harmonic components

where n is the harmonic order, and ω is the fundamental frequency.Thus, by measuring the amplitudeφB,nand phaseφB,nof the harmonic magnetic field,using the magnetic probe,one can derive the amplitudeJz,nand phaseφJ(rèn),nof the harmonic current density at all radii.Note thatφB,nandJz,nare taken from the real parts ofandrespectively.
The time-average ohmic power absorbed by the electrons is given by [66]

By measuring the radial distribution of the electron density on the mid-plane between the electrodes, using the hairpin probe, one can determineωpeat different radii.This,combined with an estimated value ofυm, allowed calculation of the radial profile ofpohm,nusing equation (6).For the discharge conditions investigated here, the electron temperature in the bulk plasma was assumed to beTe=3 eV[46, 67, 68], so that the electron-neutral momentum transfer collision frequencyυm=ngKel(Te) at 3 Pa was estimated to be about 91 MHz,wherengis the neutral gas density,andKelis the electron-neutral momentum transfer collision rate coefficient at the givenTe(see table 3.3 in [66]).
3.Further results and discussion
Experimentally measured radial distributions of the amplitudeBφ,nand phaseφB,nof the first six harmonics (n= 1 -6) of the magnetic field for three typical driving frequencies(13.56,30, and 60 MHz) are illustrated in figure 6.The harmonic magnetic field exhibits a specific radial structure depending on both the driving frequency and the harmonic order.For low-order harmonics, e.g.the first two harmonics of 13.56 MHz, the first harmonic of 30 MHz, and the first harmonic of 60 MHz,φB,nincreases almost linearly from the electrode center (r=0 cm) to the edge (r=15 cm) (see figure 6), reflecting a relatively uniform harmonic current density (see figure 7); on the other hand,φB,nis nearly constant within the electrode radius (r< 15 cm), except for an abrupt change around the electrode center corresponding to a polarity reversal of the azimuthal magnetic field there.One can observe a slight increase in the growth rate ofφB,1versus radius close to the electrode edge for 30 MHz discharges,due to the enhancement of the current density there (figures 7(a)–(b)).By contrast, an opposite trend occurs for 60 MHz discharge(figure 6(c)),corresponding to a decrease in the current density around the electrode edge (figure 7(c)).
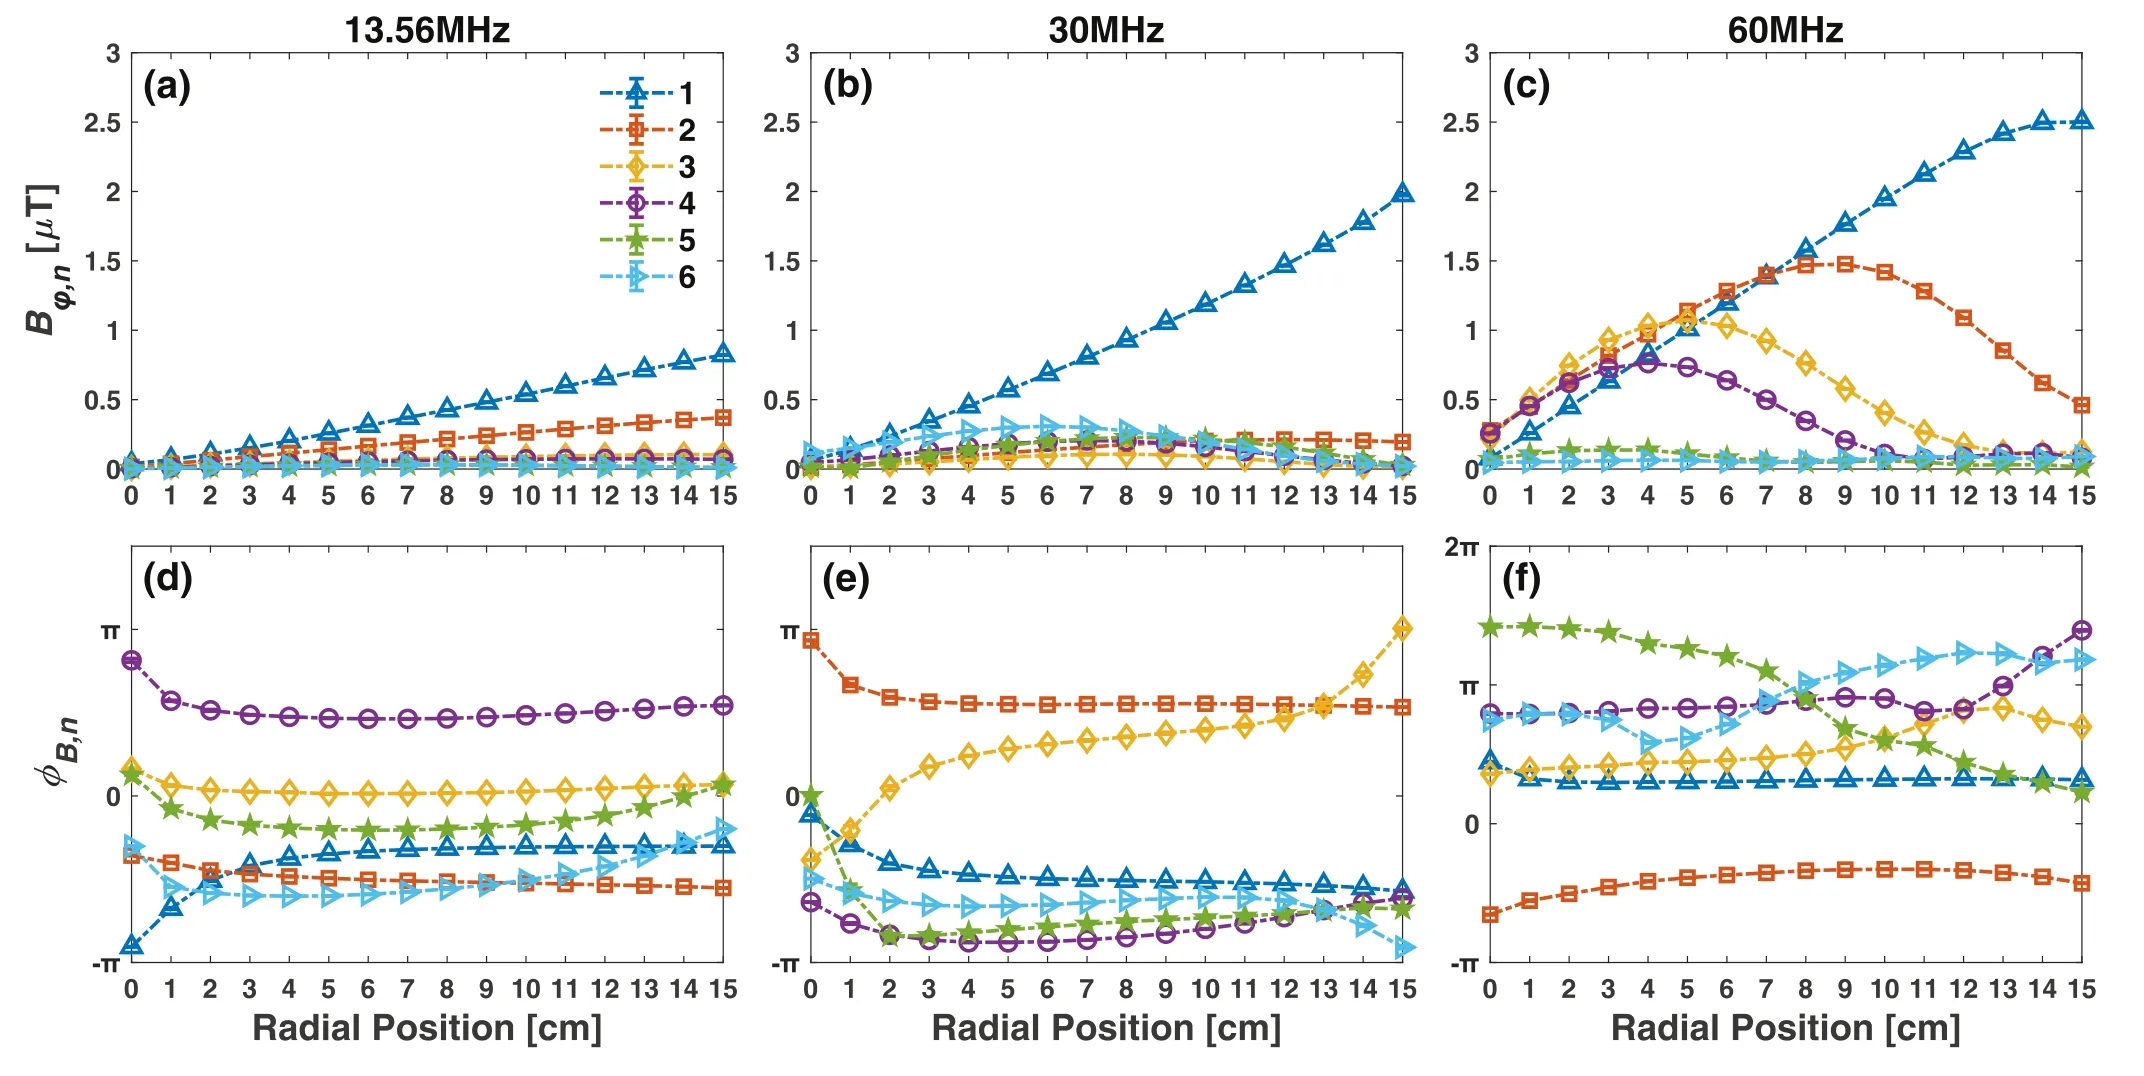
Figure 6.Radial distributions of the amplitude φB ,n (top row)and phaseφB,n (bottom row)of the first six harmonics of the magnetic field in an argon CCP for three typical driving frequencies (13.56, 30, and 60 MHz) at 3 Pa and 40 W.Note thatφB,n is defined in [?π, π], but it is adjusted at some radii in order to gain a smooth variation ofφB,n with radius.
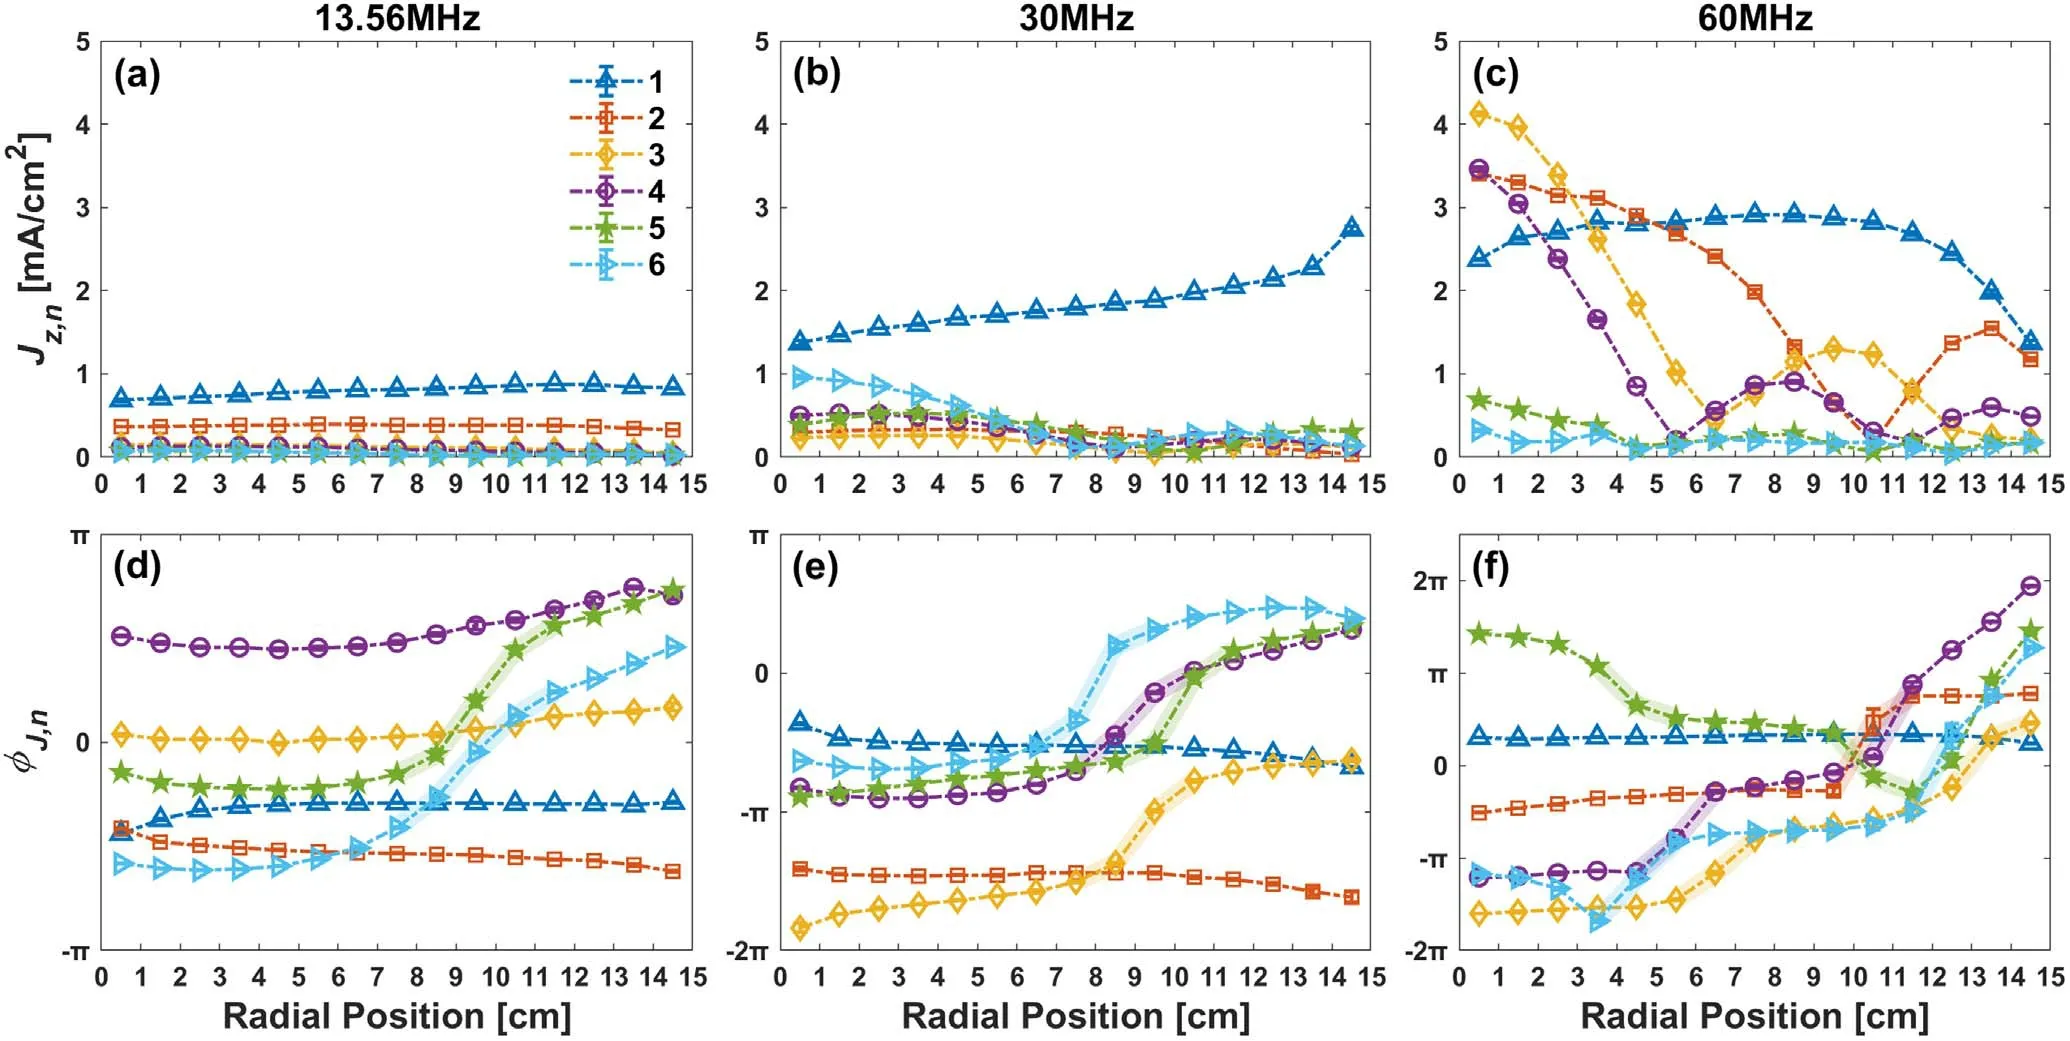
Figure 7.Radial distributions of the amplitude Jz,n (top row)and phaseφJ(rèn) ,n (bottom row)of the first six harmonics of the current density in an argon CCP for three typical driving frequencies (13.56, 30, and 60 MHz) at 3 Pa and 40 W.Note thatφJ(rèn) ,n is defined in [?π, π], but it is adjusted at some radii in order to gain a smooth variation ofφJ(rèn) ,n with radius.In figures 7(d)–(f), the abrupt jump ofφJ(rèn) ,n with radius around each current node is highlighted by colored background.
For higher harmonics of these driving frequencies,however, a maximum inφB,nappears between the electrode center and edge.Taking the 2nd harmonic of 60 MHz for example (figure 6(c)),φB,2first increases with radius.After going through a maximum,φB,2begins to decline, accompanied by a slight variation ofφB,2with radius (figure 6(f)).On the rising edge ofφB,2, the growth rate ofφB,2declines with radius,indicating a substantial reduction in the harmonic current density (figure 7(c)).On the falling edge ofφB,2, the variation ofφB,2with radius indicates the presence of a reverse current, which is the evidence of a remarkable standing wave.Similar spatial structures of the harmonic magnetic field can be identified for higher harmonics of 30 MHz and even 13.56 MHz, but their amplitudes are quite small as compared to the fundamental one.Overall, for a constant rf power,there is a general rise inφB,nas a function of the driving frequency, specifically for n = 1.As will be discussed in more detail later, this is due to the fact that a higher driving frequency can result in improved electron heating efficiency,yielding a higher harmonic current density flowing axially through the interelectrode space, which induces the azimuthal harmonic magnetic field.
Using equation (4), the corresponding radial profiles of the amplitudeJz,nand phaseφJ(rèn),nof the harmonic current density were calculated, as shown in figure 7.For low-order harmonics,e.g.the first two harmonics of 13.56 MHz,the first harmonic of 30 MHz, and the first harmonic of 60 MHz,Jz,nexhibits a relatively uniform distribution particularly atr<12 cm (figures 7(a)–(c)); meanwhile,φJ(rèn),nis almost independent of radius (figures 7(d)–(f)), implying a weak standing wave.For higher harmonics of these driving frequencies, however,Jz,nexhibits a multi-node structure, with the main peak on axis,and one or more minor peaks between the electrode edge and the center (figures 7(a)–(c)).In the vicinity of the current node, there is an abrupt jump inφJ(rèn),ncorresponding to a current reversal (figures 7(d)–(f)).The position of the node gradually moves towards the electrode center with increasing n,due to the decreasing wavelength as n increases.
The amplitude and the radial structure of the harmonic current density are sensitive to the driving frequency.As expected, for a constant rf power, the total current density increases dramatically with the driving frequency, as shown in figures 7(a)–(c).At low driving frequencies (i.e.13.56 and 30 MHz), the amplitudes of all higher harmonic current densities are much smaller or even negligible in comparison with the fundamental one, which is a consequence of a weak PSR and/or a weak spatial wave resonance (SWR) [54–56].At 13.56 MHz, for example, the second harmonic (n=2) of the current density shown in figure 7(a) is expected to be dominated by the PSR, whereas the SWR at n = 2 is quite weak.Besides, both a weak PSR and a weak SWR occur atn= 3 -4.Forn= 5 -6, the PSR is fairly weak (albeit a strong SWR might be present), also resulting in a weak harmonic excitation.As a consequence, the plasma characteristics are dominated by the fundamental frequency in 13.56 and 30 MHz discharges.Specifically, for 13.56 MHz discharge, the fundamental harmonic current density,Jz,1,slightly increases with radius due to the enhancement of electric field at the electrode edge (the so-called electrostatic edge effect), which leads to a slightly edge-high distribution in the plasma density (see the insert of figure 8(a)).For 30 MHz discharge, a similar edge-high distribution ofJz,1dominated by the electrostatic edge effect can be identified,which is superimposed on several slightly center-high distributions ofJz,n(n=3–6)dominated by weak SWE,leading to a visible bimodal distribution of the plasma density(see the insert of figure 8(b)).

Figure 8.Radial distributions of the time-averaged ohmic electron power absorption pohm,n of the first six harmonics in an argon CCP for three typical driving frequencies(13.56,30,and 60 MHz)at 3 Pa and 40 W.The insert in each panel displays the experimentally measured radial profile of the electron (plasma) density under the same conditions.
By contrast, at high driving frequency (i.e.60 MHz),remarkable harmonic excitations and nonlinear standing waves are clearly observed for n = 2–4 (figure 7(c)), significantly contributing to a center-high distribution of the plasma density, as shown in the insert of figure 8(c).In distinct contrast to the edge-high distribution of Jz,1appearing at low driving frequencies, we observe a rapid decline in Jz,1around the electrode edge for 60 MHz discharge.In agreement with previous simulation prediction[36],it appears that the SWE tends to diminish the electrostatic edge effect as the driving frequency is increased.
According to the experimentally determined harmonic current density profiles, we further calculated the ohmic electron power absorptionpohm,nusing equation (6), and the results are shown in figure 8.The corresponding radiallyaveraged ohmic electron power absorptions corresponding to each harmonic (n=1–6) for three driving frequencies are displayed in figure 9.As shown in figure 8,for each harmonic of a given driving frequency, the radial distribution ofpohm,nresembles that of Jz,n(see figures 7(a)–(c)), but exhibits a more distinct variation with the radius due to the scaling lawIt is known that argon CCPs powered at relatively low applied voltage, typically operate at the α mode,in which electrons absorb energy from the electric field mainly via ‘ohmic heating’ and/or ‘pressure heating’[69–76].The pressure heating, caused by the ambipolar electric field and the gradient of the electron temperature, is predominant at low pressures [71–74], whereas the ohmic heating, due to electron-neutral collisions, is predominant at higher pressure[75,76].At 3 Pa,the electron mean free path is expected to be less than the electrode separation (4 cm),so that collisional ohmic heating might play a crucial role in determining the plasma characteristics.In particular, the ohmic heating is found to be highly sensitive to the driving frequency.As shown in figure 9, at 13.56 MHz, the radiallyaveraged ohmic electron power absorption at the fundamental frequency,is about 43.4 W m?3, quite a small value,implying that the bulk ohmic heating is not the main source for electrons to gain energy from the electric field.First, the weak ohmic heating in the bulk region is a consequence of the low current density as shown in figure 7(a).A lower driving frequency results in a thicker sheath, and a lower sheath capacitance and, consequently, a higher sheath reactance,leading to a smaller current flowing through the electrode.Moreover, at a lower driving frequency, more power is transferred to ions rather than electrons due to a larger voltage drop across the sheath, which leads to a decreased power deposition in the bulk.It should be noted that in many cases the maximum of ohmic heating occurs near the plasma/sheath interface due to the high electric field and low conductivity at that location [77, 78].
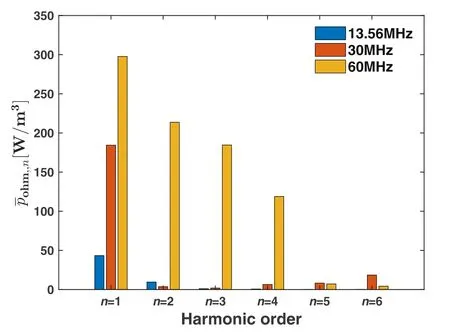
Figure 9.Radially-averaged ohmic electron power absorption at each harmonic(n=1–6)for three typical driving frequencies:13.56 MHz(blue), 30 MHz (red), and 60 MHz (orange).The discharge conditions were the same as in figure 8.
It is shown that the bulk ohmic electron power absorption can be significantly enhanced by increasing the driving frequency, even at a relatively low pressure.As illustrated in figure 9, the radially-averaged ohmic electron power absorptionincreases by a factor of about 6 as the driving frequency increases from 13.56 to 60 MHz, and an even more remarkable increase inversus driving frequency can be identified for higher harmonics (n=2–4).According to the previous discussion, a higher driving frequency can produce a larger current between the electrodes which, in turn, leads to enhanced ohmic heating of the fundamental component.Importantly, ohmic heating can be further enhanced by the excitation of higher harmonics and the nonlinear standing waves, as shown in figure 8(c).In agreement with our experimental results, Sharma et al[44, 47, 48] predicted, via a self-consistent particle-in-cell simulation, that the electric field nonlinearity caused by the higher harmonics can lead to an enhanced electron heating in the bulk plasma for driving frequencies above 60 MHz.The authors also found that at a high driving frequency, selfexcitation of higher harmonics can further enhance the local current density and the corresponding plasma density.A comprehensive kinetic interpretation of the electron power absorption dynamics and the nonlinear resonance phenomena in low pressure CCPs was also reported by Wilczek et al[57].As shown in figure 8(c), the radial maxima inpohm,nof the 2nd, 3rd, and 4th harmonics are comparable to the fundamental, remarkably contributing to the center-high profile of the plasma density.
It is worth mentioning that the calculated ohmic electron power absorption depends not only on the accuracy of measurement of the electron density, but also on the assumption of constant electron-neutral momentum transfer collision frequency in the bulk plasma.Nevertheless,such a calculation is helpful in analyzing the relative changes of the electron power absorption dynamics for all harmonics in capacitive discharges operated at high driving frequencies.
4.Conclusions
A high-frequency magnetic probe was used for diagnosing the nonlinear standing waves and the bulk ohmic electron power absorption in low pressure CCP discharges operated at driving frequencies of 13.56,30,and 60 MHz.By measuring the spatial structure of the harmonic magnetic field,using the magnetic probe,distributions of the harmonic current and the corresponding ohmic electron power deposition were deduced according to Ampere’s law.At a low driving frequency, i.e.13.56 MHz, the excitations of higher harmonics and the standing waves were observed to be quite weak due to weak PSR and/or SWR, so that the plasma characteristics were predominated by the fundamental driving frequency.The fundamental harmonic current density slightly increased from the electrode center to the edge due to the electrostatic edge effect, resulting in a slight edge-high profile of the plasma density.For a constant rf power,the harmonic magnetic field/current was observed to increase dramatically with the driving frequency due to decreased sheath reactance and more remarkable nonlinear standing waves, leading to the enhancements of the ohmic heating and the plasma density in the bulk,specifically at the electrode center.At a high driving frequency, i.e.60 MHz, the high-order harmonic current density and the corresponding ohmic electron power absorption exhibited a similar node structure, with the main peak on axis, and one or more minor peaks between the electrode center and the edge, remarkably contributing to the center-high plasma density.The magnetic probe was shown to have a considerable magnetic sensitivity and an effective capacitive pickup rejection over a relatively wide frequency range, and is thus expected to be suitable for sensitive measurements of high frequency magnetic fields in diverse systems.
Acknowledgments
This work has been financially supported by National Natural Science Foundation of China (NSFC) (Nos.12005035 and 11935005), China Postdoctoral Science Foundation (Nos.2020M670741 and 2021T140085), and Fundamental Research Funds for the Central Universities (No.DUT20LAB201).DJE is grateful to National Science Foundation (No.PHY-1500518) and to Department of Energy Office of Fusion Energy Science (No.DE-SC0001939) for financial support.
ORCID iDs
 Plasma Science and Technology2021年11期
- Plasma Science and Technology的其它文章
- Influence of magnetic filter field on the radiofrequency negative hydrogen ion source of neutral beam injector for China Fusion Engineering Test Reactor
- Investigation on current loss of high-power vacuum transmission lines with coaxial-disk transitions by particle-in-cell simulations
- A low-jitter self-triggered spark-discharge pre-ionization switch: primary research on its breakdown characteristics and working mechanisms
- A calculation model for breakdown time delay and jitter of gas switches under hundred-nanosecond pulses and its application in a self-triggered pre-ionized switch
- Study of tetracycline removal and saturated resin regenerated by dielectric barrier discharge plasma
- Experimental study on the parameter optimization and application of a packed-bed dielectric barrier discharge reactor in diesel particulate filter regeneration
