Baotou Rare-earth Hi-Tech Zone Propels with All Strengths Innovative Applications of Industrial Internet of New Rare Earth Materials
2021-08-13 06:03:16
China Nonferrous Metals Monthly 2021年6期
Baotou Rare-earth Hi-Tech Zone Propels with All Strengths Innovative Applications of Industrial Internet of New Rare Earth Materials
Recently Baotou Rare Earth High-tech Zone, Inner Mongolia successfully convened a promotion meeting on Industrial Internet of new rare earth materials, which indicates that new rare earth material enterprises of Rare Earth High-tech Zone will phase in innovative applications of Industrial Internet and digital transformation is embracing its boom.
Industrial Internet is a significant part of digital economy, one of the important territories of new infrastructure construction and a new model and new ecology of deep integration of industrial system and Internet. Meanwhile, it also is a crucial means to facilitate digital transformation and upgrading, accelerate the replacement of old growth drivers with new ones and push forward high-quality economic development.
Rare Earth High-tech Zone convened this promotion meeting so as to specifically fulfill its purpose of profoundly implementing national development strategy of Industrial Internet and putting into effect related deployment formulated by autonomous region government and Baotou municipal government. As the biggest cluster district of rare earth industry in China, Rare Earth High-tech Zone has been devoted to advancing rare earth industry for nearly 30 years. Many of its new rare earth materials have climbed to important positions nationwide like permanent magnet material, hydrogen storage material and polishing material. It is of significant importance to construct and develop Industrial Internet system of new rare earth materials to accelerate the transformation of new rare earth enterprises to producing and manufacturing scale featured by smart production, custom-tailored production, networked collaboration and service extension, so as to further production efficiency and quality, satisfy diversified demands from market, upgrade overall competitiveness of the industry and finally achieve sustainable healthy development.
Digital Economy Industry Bureau of Rare Earth Hi-Tech Zone spares no efforts in propelling the construction of Industrial Internet of new rare earth materials and formulated Opinions from Rare Earth Hi-Tech Zone on Propelling the Development of Industrial Internet of New Rare Earth Materials based on sufficient survey. The Opinions specifies guiding ideology, development goals, key tasks and safeguard measures centering on the development of Industrial Internet and facilitates the R&D, construction and deployment of Industrial Internet platform of new rare earth materials. The Zone successfully applied to Ministry of Science and Technology for the project of “Industrial Internet of New Rare Earth Material of Rare Earth Hi-Tech Zone” and was granted a special fund of RMB 16 million. The Zone designated 7 enterprises (including Inner Mongolia Gongyun Technology Co., Ltd.) as the first batch of technical service providers for Industrial Internet of Rare Earth Hi-Tech Zone to provide sustainable, stable and efficient technical support for the construction of Industrial Internet of Rare Earth Hi-Tech Zone.
Rare Earth Hi-Tech Zone issued Opinions from Rare Earth Hi-Tech Zone on Propelling the Development of Industrial Internet of New Rare Earth Materials and Opinions from Rare Earth Hi-Tech Zone on Propelling Development of Digital Economy; Rare Earth Hi-Tech Zone convened a launching ceremony of “Technical Innovation Community of Industrial Internet”, where 7 Community Member service providers released their own solutions and entered into agreements with 3 model enterprises, i.e. Jiangxin Micromotor, Skyrock Rare Earth, Zhongke Yuhang, and 3 pilot enterprises, i.e. SYRE, Hua Xing Rare Earth and Zhongche Electric. Rare Earth Hi-Tech Zone dispensed “Cloud Coupon” to the first 6 pilot and model enterprises of Industrial Internet of New Rare Earth Material with a maximum face value of RMB 500000.
During the meeting, Management Committee of Rare Earth Hi-Tech Zone and Baotou Branch of China Unicom co-organized a signing ceremony of Cooperation Agreement of 5G Application in Model Industrial Park of Industrial Internet, which indicates the both parties’ determination to actively explore the construction and operation model of 5G special network for the Zone and the enterprises and to fully cooperate in aspects of 5G construction, 5G networking and 5G scenarios centering on the Zone and the rare earth enterprises.
According to information, for its construction of Industrial Internet, Rare Earth Hi-tech Zone will focus on promoting the construction of Industrial Internet of New Rare Earth Material. The Zone will guide more enterprises onto Cloud platform by cultivating pilot and model enterprises so as to reduce their non-recurring informatization cost and facilitate digital transformation and upgrading of rare earth enterprises.
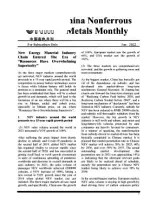
Unit: metric ton
Name of province or cityProduction inApril. 2021Total outputJan.-April. 2021% Change2020-2021 Zhejiang Jiangxi69892324889.52 Hunan381913646100.24 Guangxi794230012.73 Yunnan95813647920.14 Total output China216767807547.65
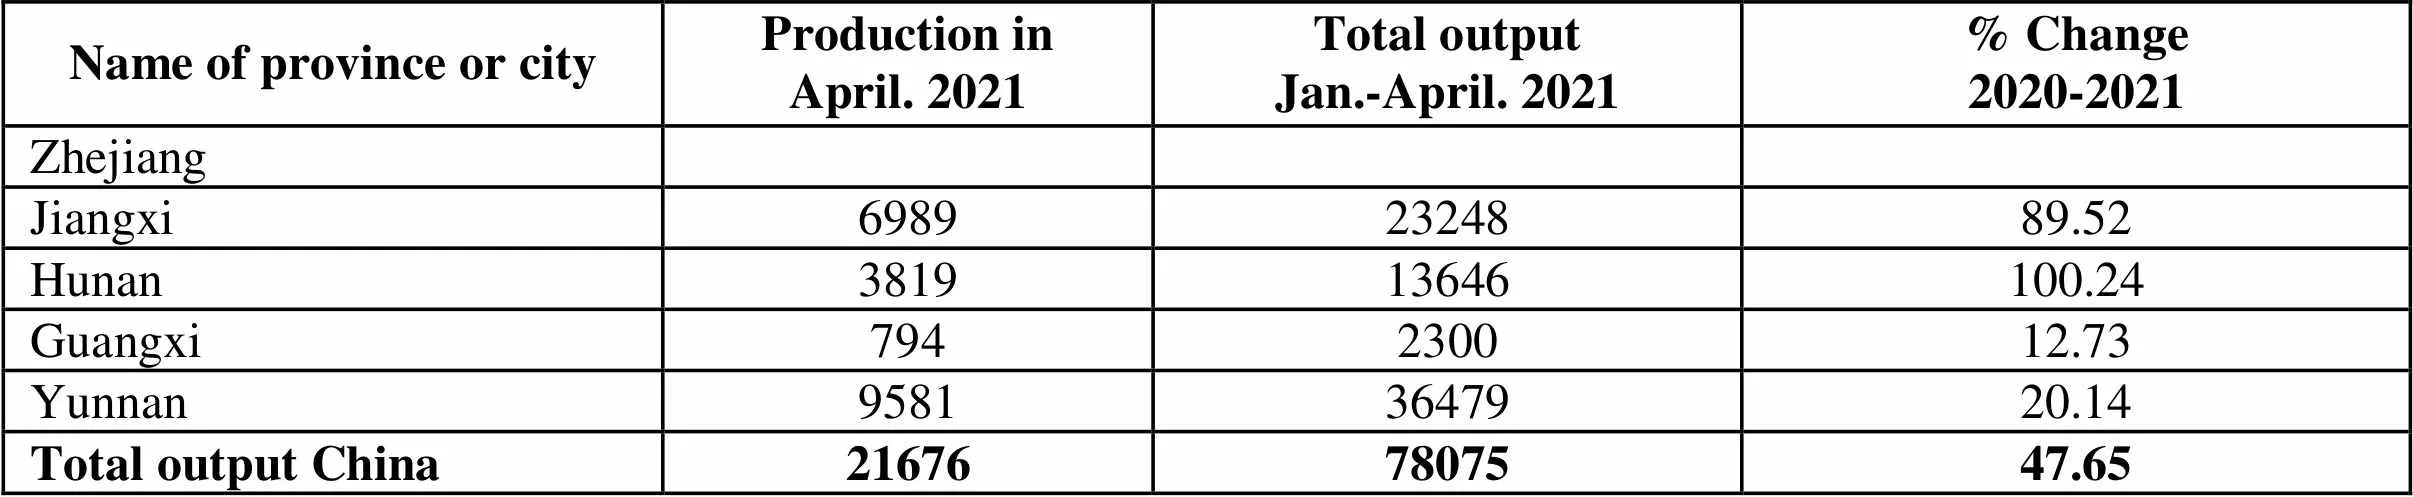
Unit: metric ton
Name of provinceProduction inApril. 2021Total outputJan.-April. 2021% Change2020-2021 Shanxi880037339-1.14 Henan14248216-2.36 Shaanxi5012019698417.29 Ningxia348514106-0.72 Xingjiang140910414-21.43 Total output China7043928830911.30
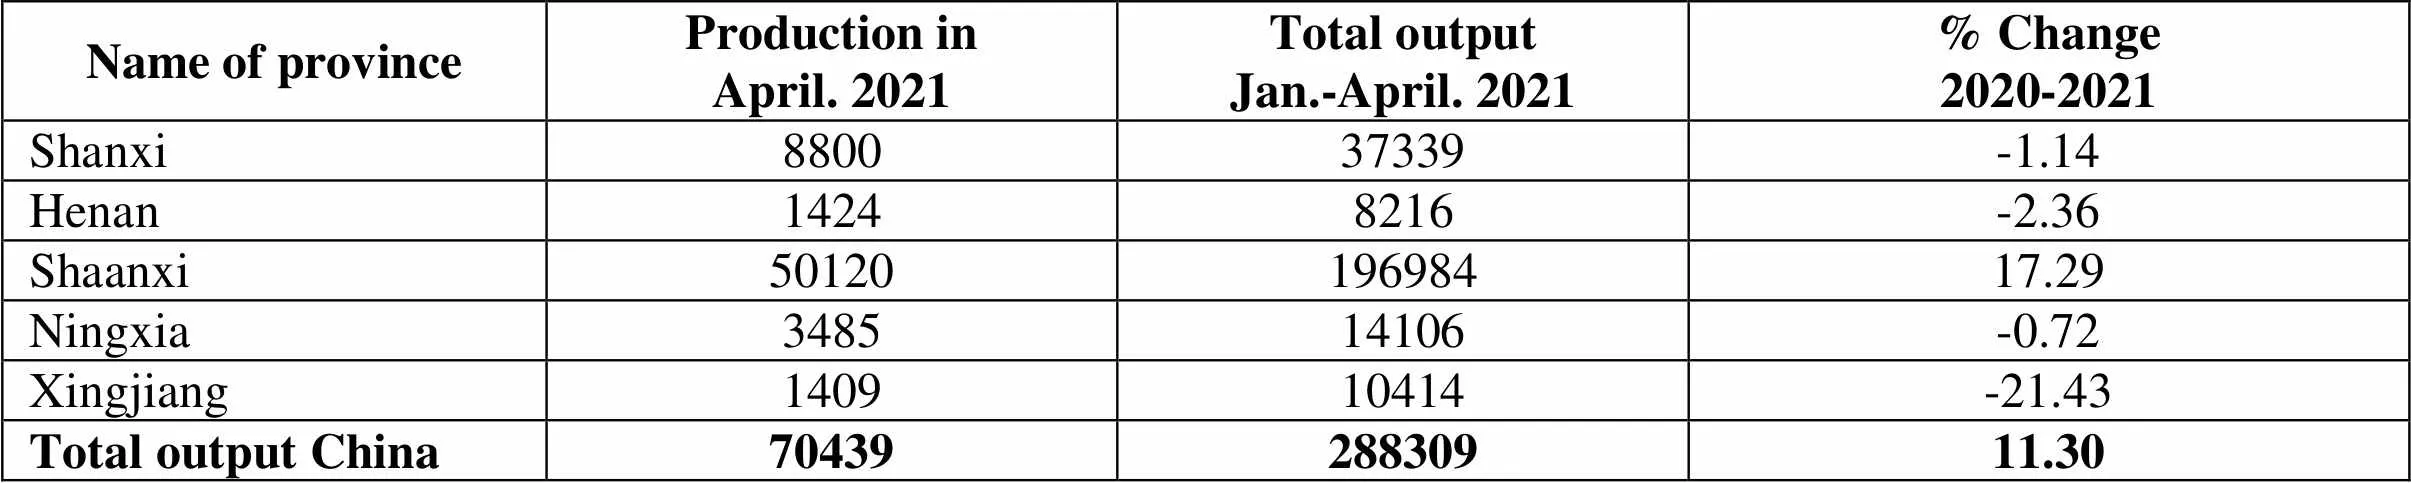
Unit: metric ton
Name of province or cityProduction inApril. 2021Total outputJan.-April. 2021% Change2020-2021 Tianjin4597-84.32 Hebei Shanxi1297148287123.33 Inner-Mongolia6748524239125.66 Liaoning107364314427.82 Jilin113384225613.05 Shanghai Jiangsu2734210833821.08 Zhejiang5052718855225.88 Anhui9371737604214.58 Fujian6941824940914.83 Jiangxi1273584811599.39 Shandong577642385491.40 Henan5734519546425.87 Hubei44565148102-4.49 Hunan122404731411.69 Guangdong144965220449.25 Guangxi8991233975027.64 Sichuan2591-43.53 Yunnan625772192333.84 Tibet5942496-21.13 Shaanxi1034189810.09 Gansu5913622794914.25 Xinjiang937138595-16.23 Total output China901183337799815.34
Unit: metric ton
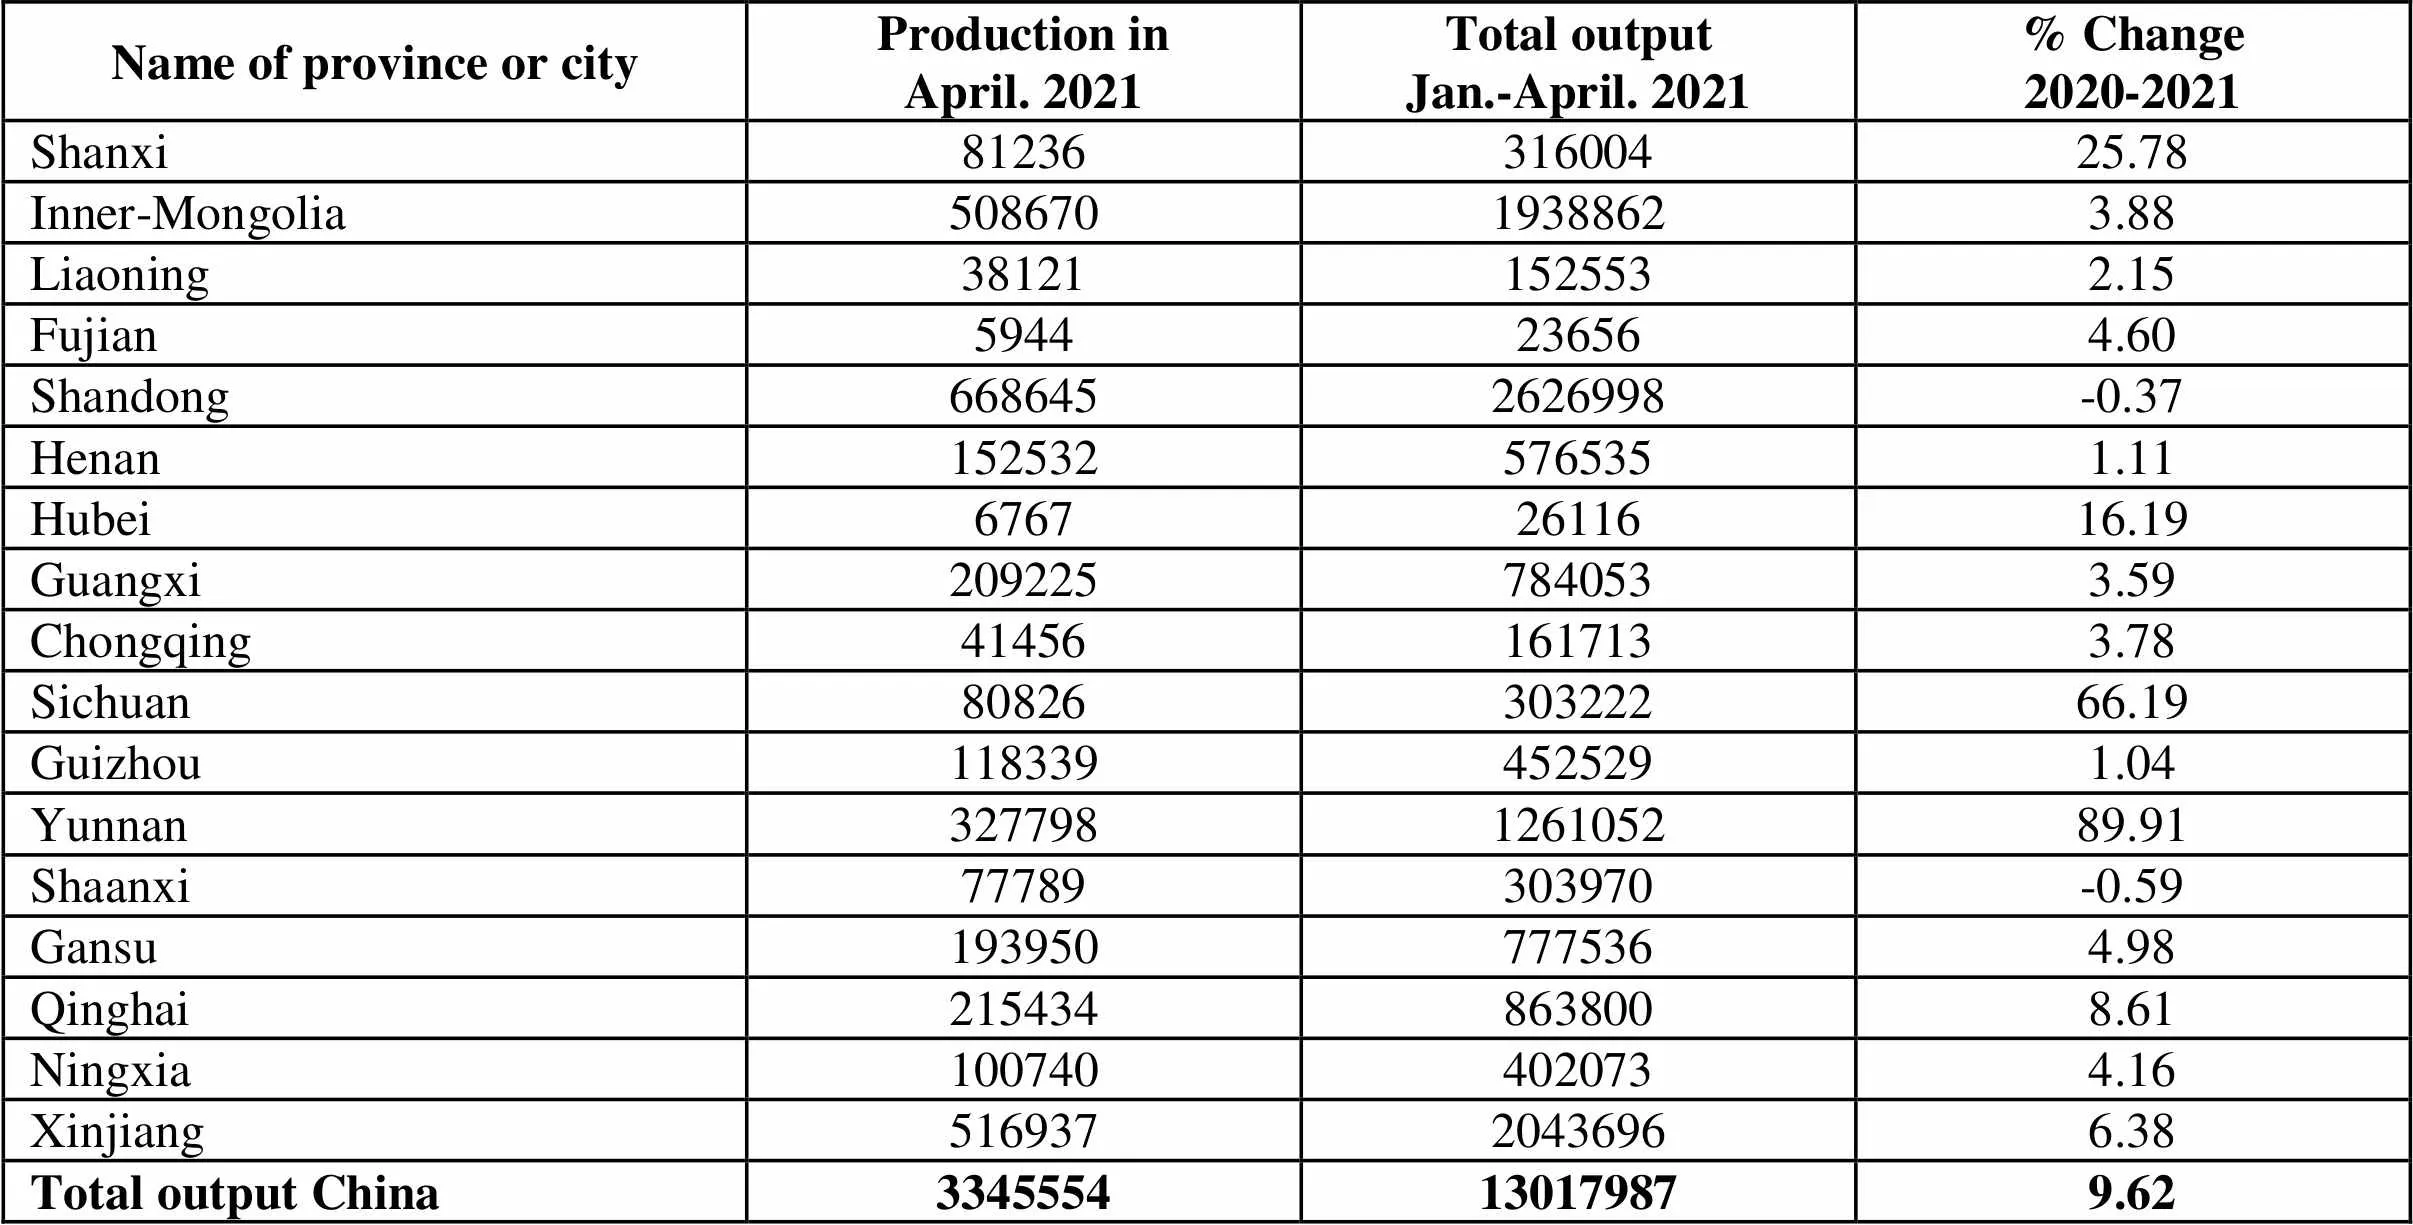
Name of province or cityProduction inApril. 2021Total outputJan.-April. 2021% Change2020-2021 Shanxi8123631600425.78 Inner-Mongolia50867019388623.88 Liaoning381211525532.15 Fujian5944236564.60 Shandong6686452626998-0.37 Henan1525325765351.11 Hubei67672611616.19 Guangxi2092257840533.59 Chongqing414561617133.78 Sichuan8082630322266.19 Guizhou1183394525291.04 Yunnan327798126105289.91 Shaanxi77789303970-0.59 Gansu1939507775364.98 Qinghai2154348638008.61 Ningxia1007404020734.16 Xinjiang51693720436966.38 Total output China3345554130179879.62
Unit: metric ton
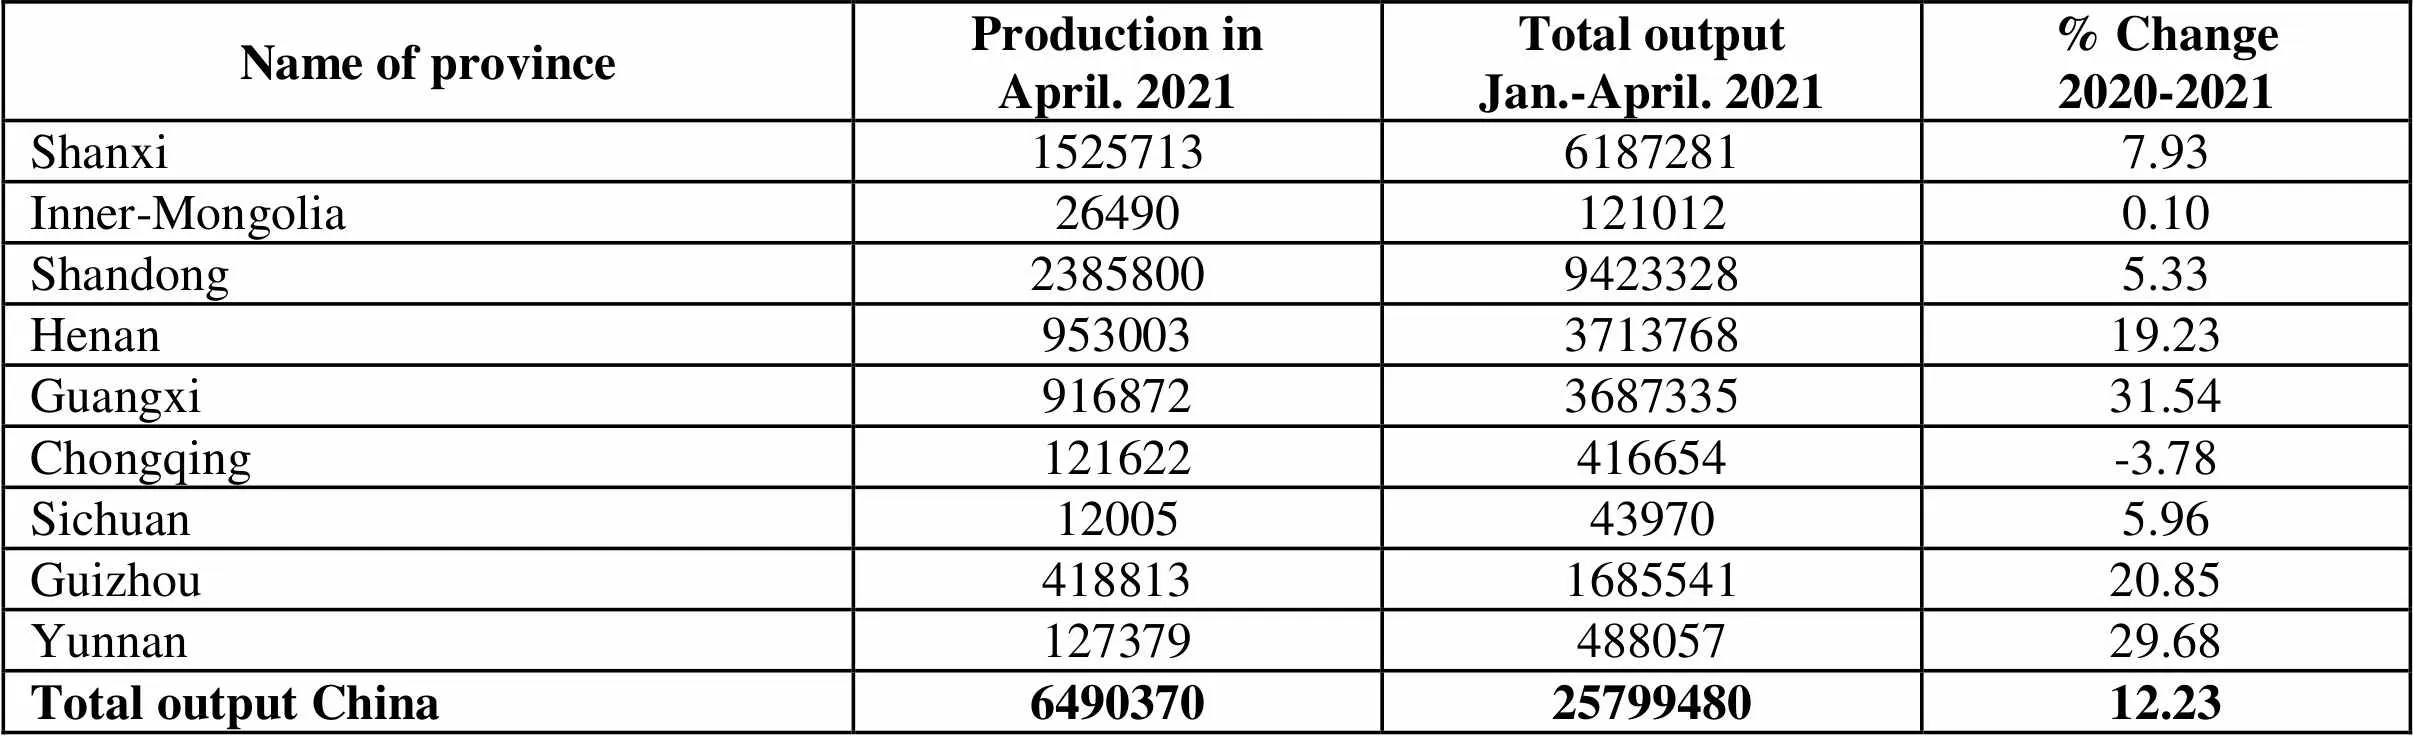
Name of province Production inApril. 2021Total outputJan.-April. 2021% Change2020-2021 Shanxi152571361872817.93 Inner-Mongolia264901210120.10 Shandong238580094233285.33 Henan953003371376819.23 Guangxi916872368733531.54 Chongqing121622416654-3.78 Sichuan12005439705.96 Guizhou418813168554120.85 Yunnan12737948805729.68 Total output China64903702579948012.23
Unit: metric ton
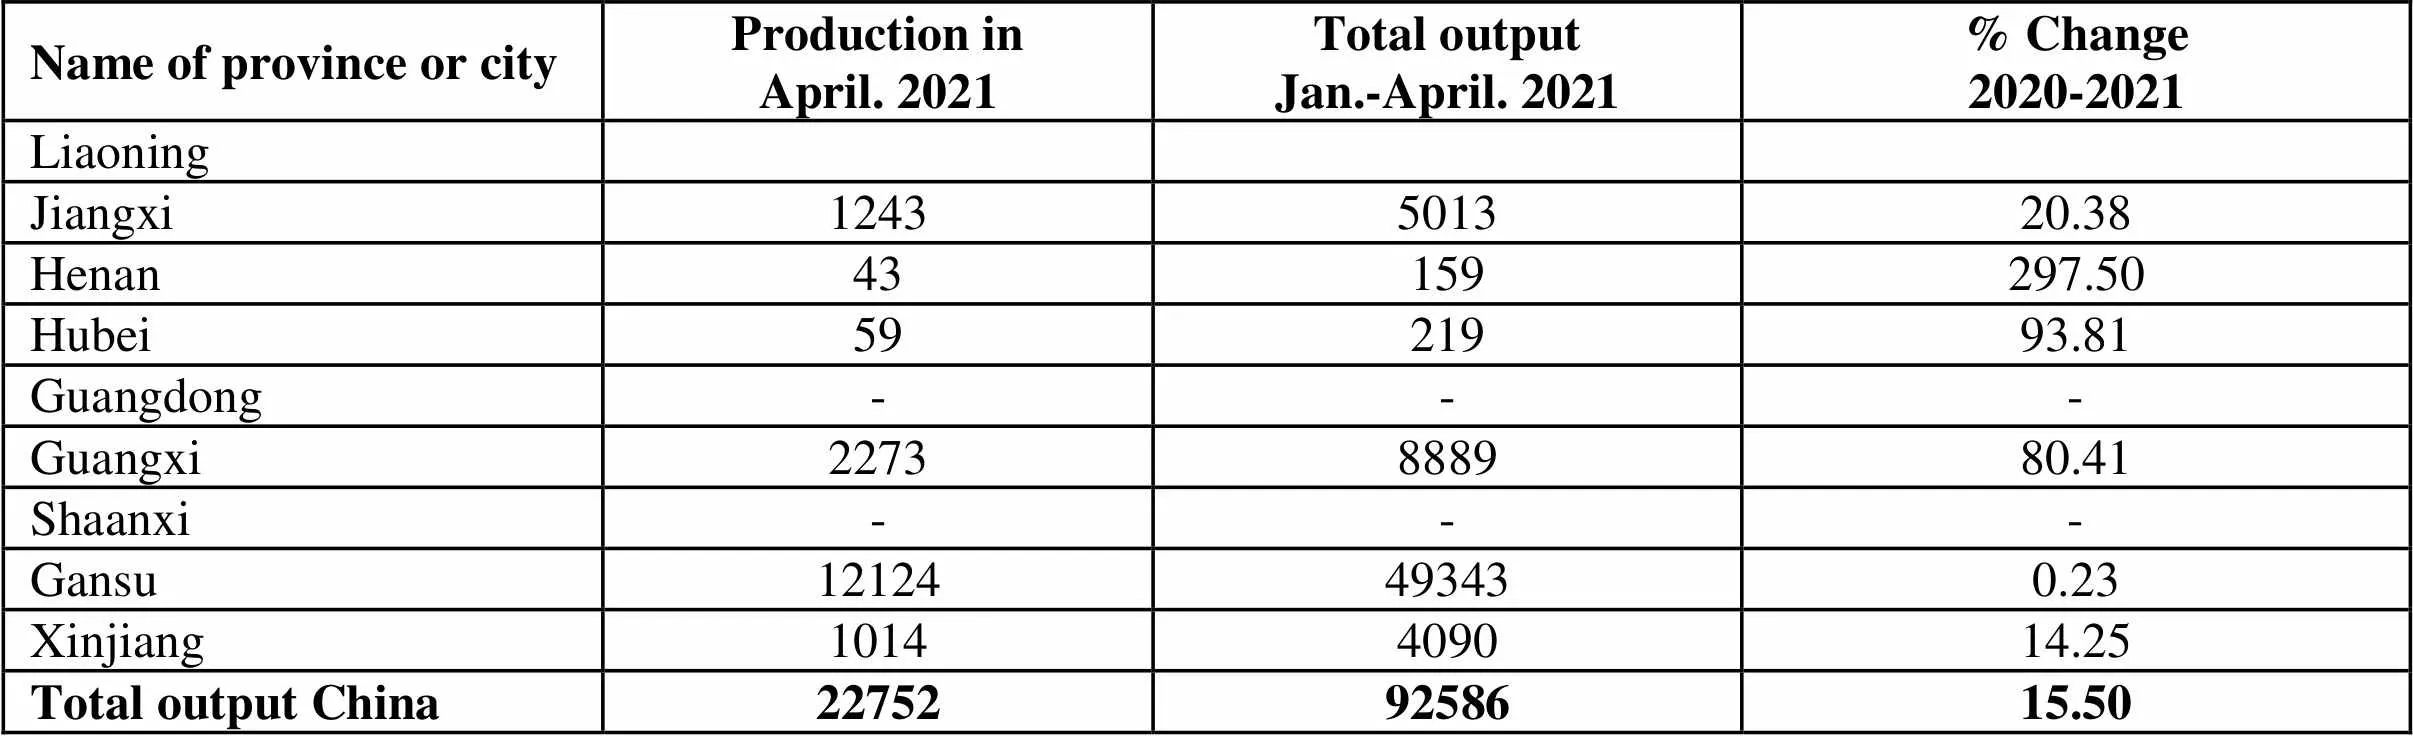
Name of province or cityProduction inApril. 2021Total outputJan.-April. 2021% Change2020-2021 Liaoning Jiangxi1243501320.38 Henan43159297.50 Hubei5921993.81 Guangdong--- Guangxi2273888980.41 Shaanxi--- Gansu12124493430.23 Xinjiang1014409014.25 Total output China227529258615.50
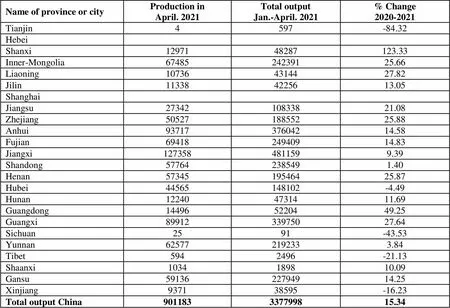
Unit: metric ton
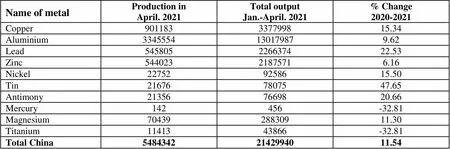
Name of metalProduction inApril. 2021Total outputJan.-April. 2021% Change2020-2021 Copper901183337799815.34 Aluminium3345554130179879.62 Lead545805226637422.53 Zinc54402321875716.16 Nickel227529258615.50 Tin216767807547.65 Antimony213567669820.66 Mercury142456-32.81 Magnesium7043928830911.30 Titanium1141343866-32.81 Total China54843422142994011.54
Unit: metric ton
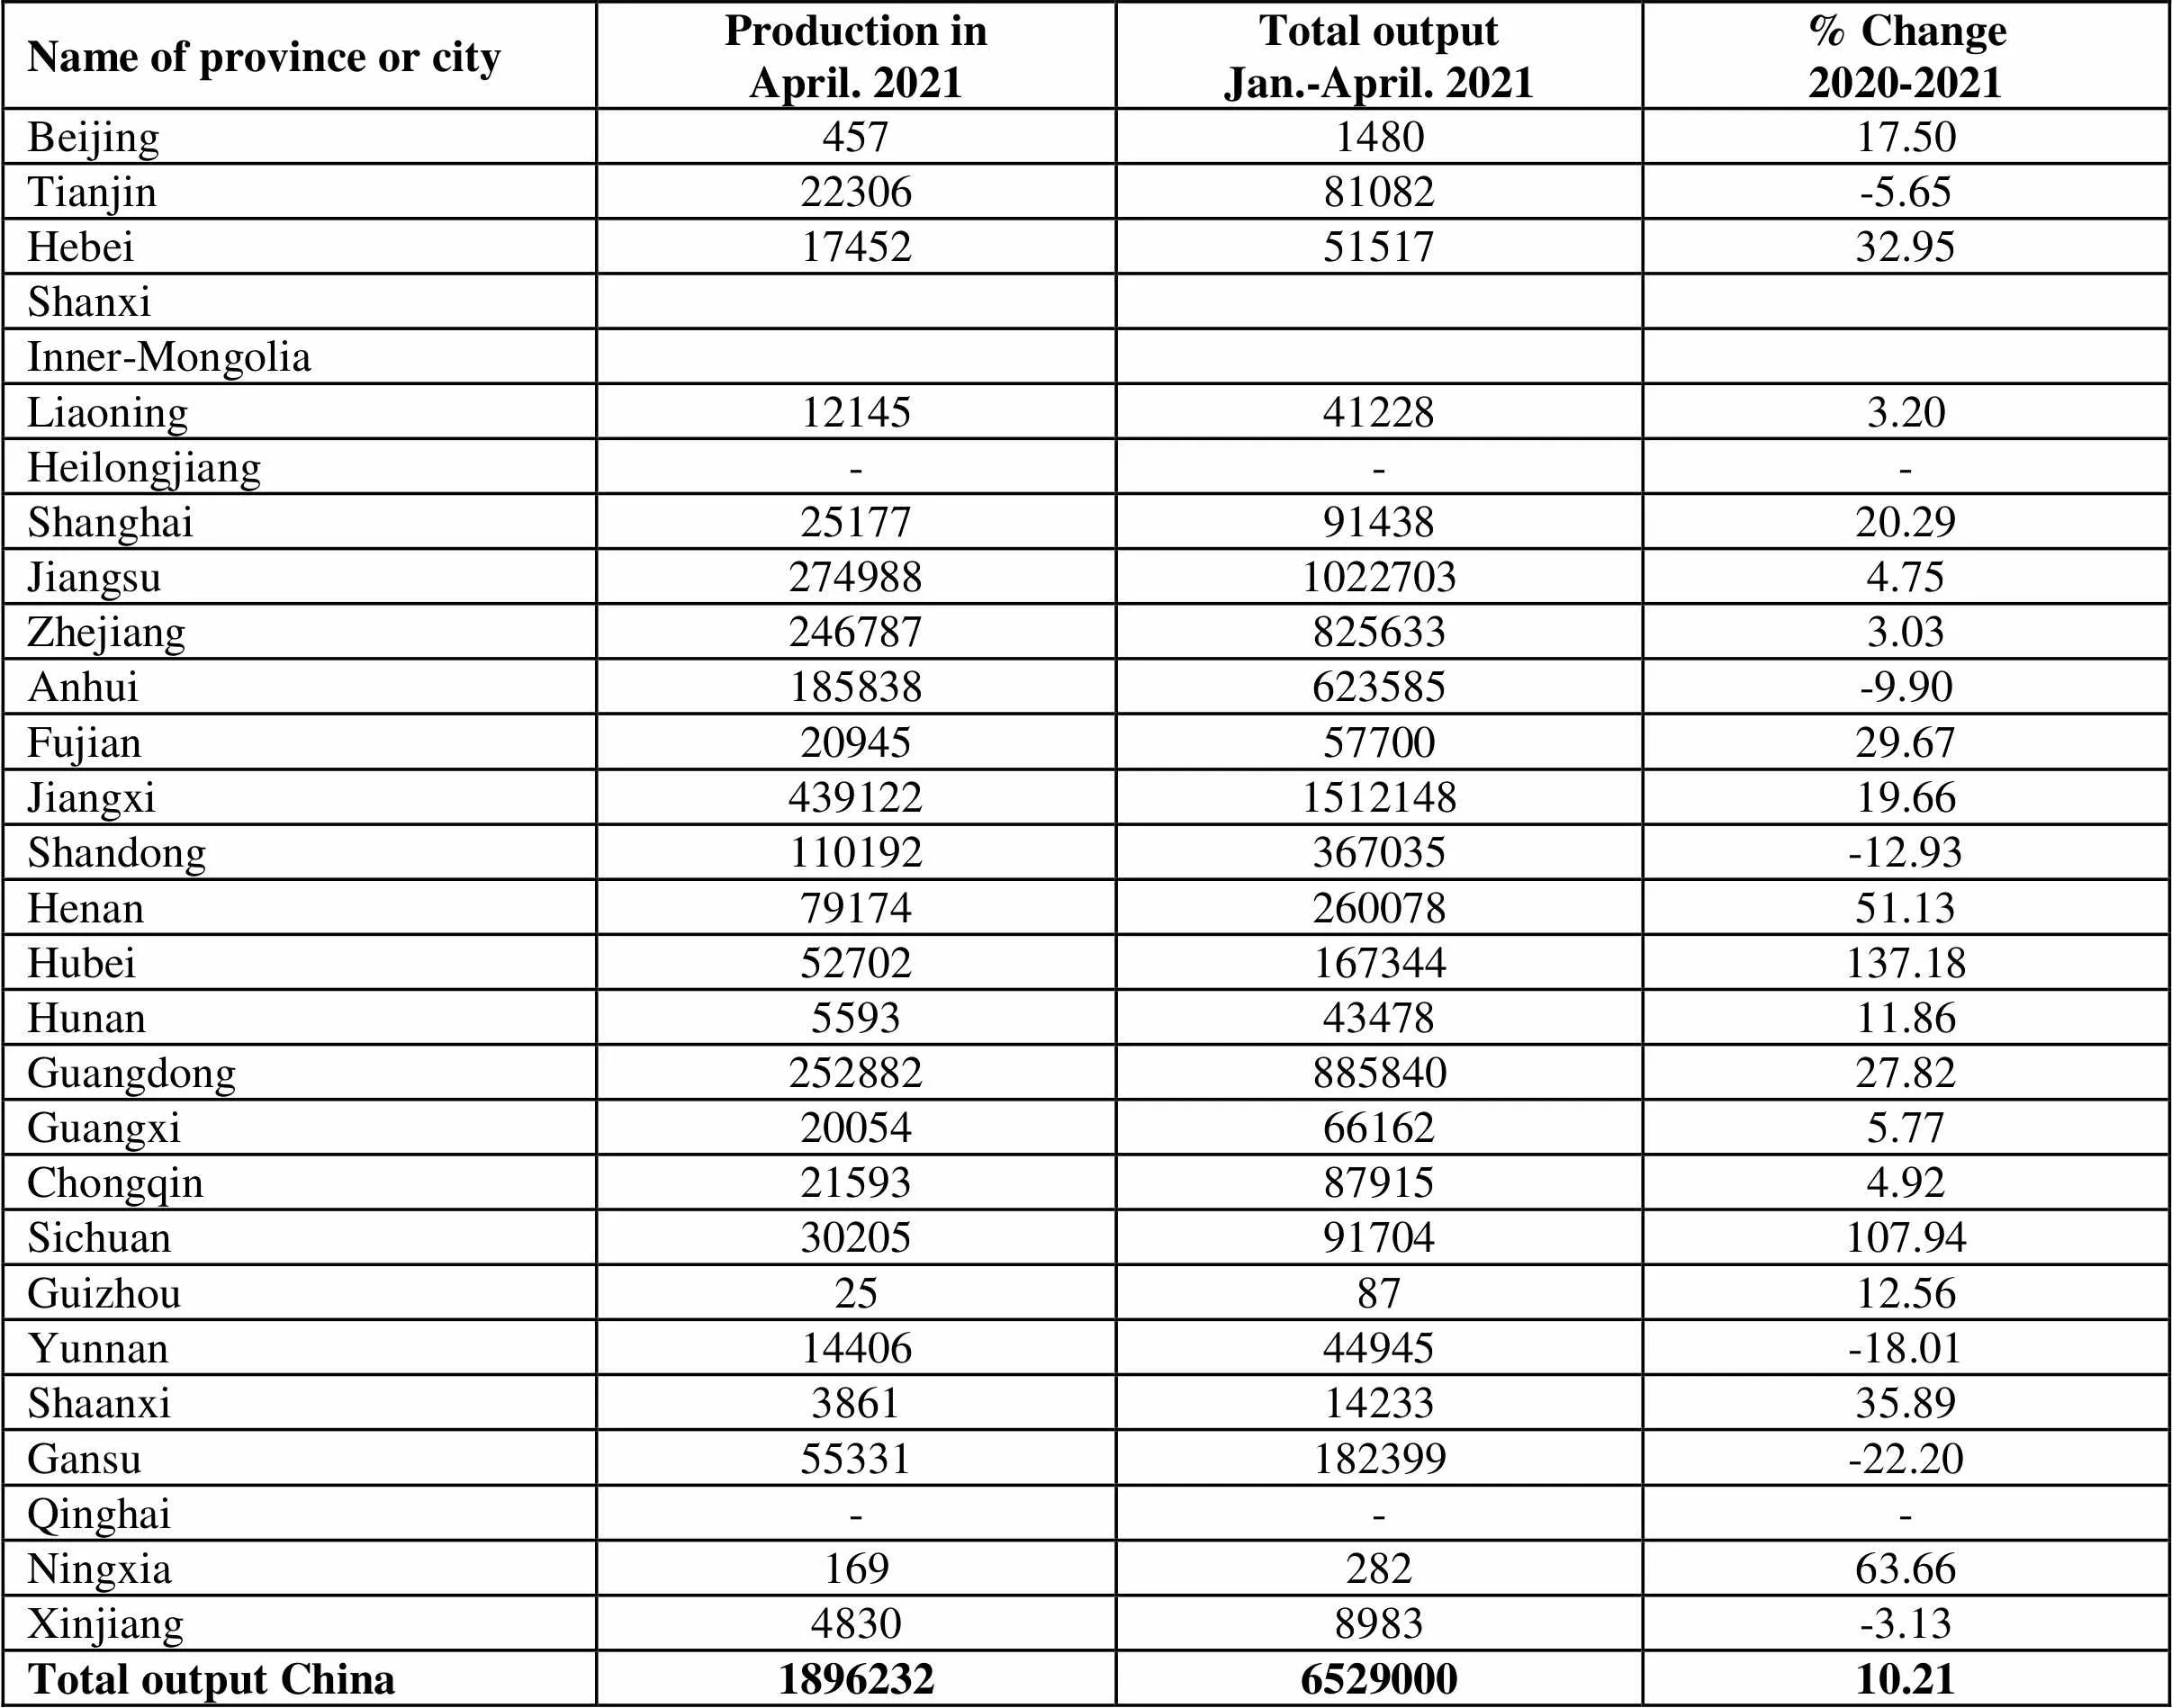
Name of province or cityProduction inApril. 2021Total outputJan.-April. 2021% Change2020-2021 Beijing457148017.50 Tianjin2230681082-5.65 Hebei174525151732.95 Shanxi Inner-Mongolia Liaoning12145412283.20 Heilongjiang--- Shanghai251779143820.29 Jiangsu27498810227034.75 Zhejiang2467878256333.03 Anhui185838623585-9.90 Fujian209455770029.67 Jiangxi439122151214819.66 Shandong110192367035-12.93 Henan7917426007851.13 Hubei52702167344137.18 Hunan55934347811.86 Guangdong25288288584027.82 Guangxi20054661625.77 Chongqin21593879154.92 Sichuan3020591704107.94 Guizhou258712.56 Yunnan1440644945-18.01 Shaanxi38611423335.89 Gansu55331182399-22.20 Qinghai--- Ningxia16928263.66 Xinjiang48308983-3.13 Total output China1896232652900010.21
Unit: metric ton
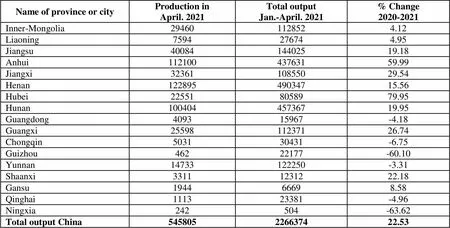
Name of province or cityProduction inApril. 2021Total outputJan.-April. 2021% Change2020-2021 Inner-Mongolia 294601128524.12 Liaoning7594276744.95 Jiangsu4008414402519.18 Anhui11210043763159.99 Jiangxi3236110855029.54 Henan12289549034715.56 Hubei225518058979.95 Hunan10040445736719.95 Guangdong409315967-4.18 Guangxi2559811237126.74 Chongqin503130431-6.75 Guizhou46222177-60.10 Yunnan14733122250-3.31 Shaanxi33111231222.18 Gansu194466698.58 Qinghai111323381-4.96 Ningxia242504-63.62 Total output China545805226637422.53
Unit: metric ton(metal content)
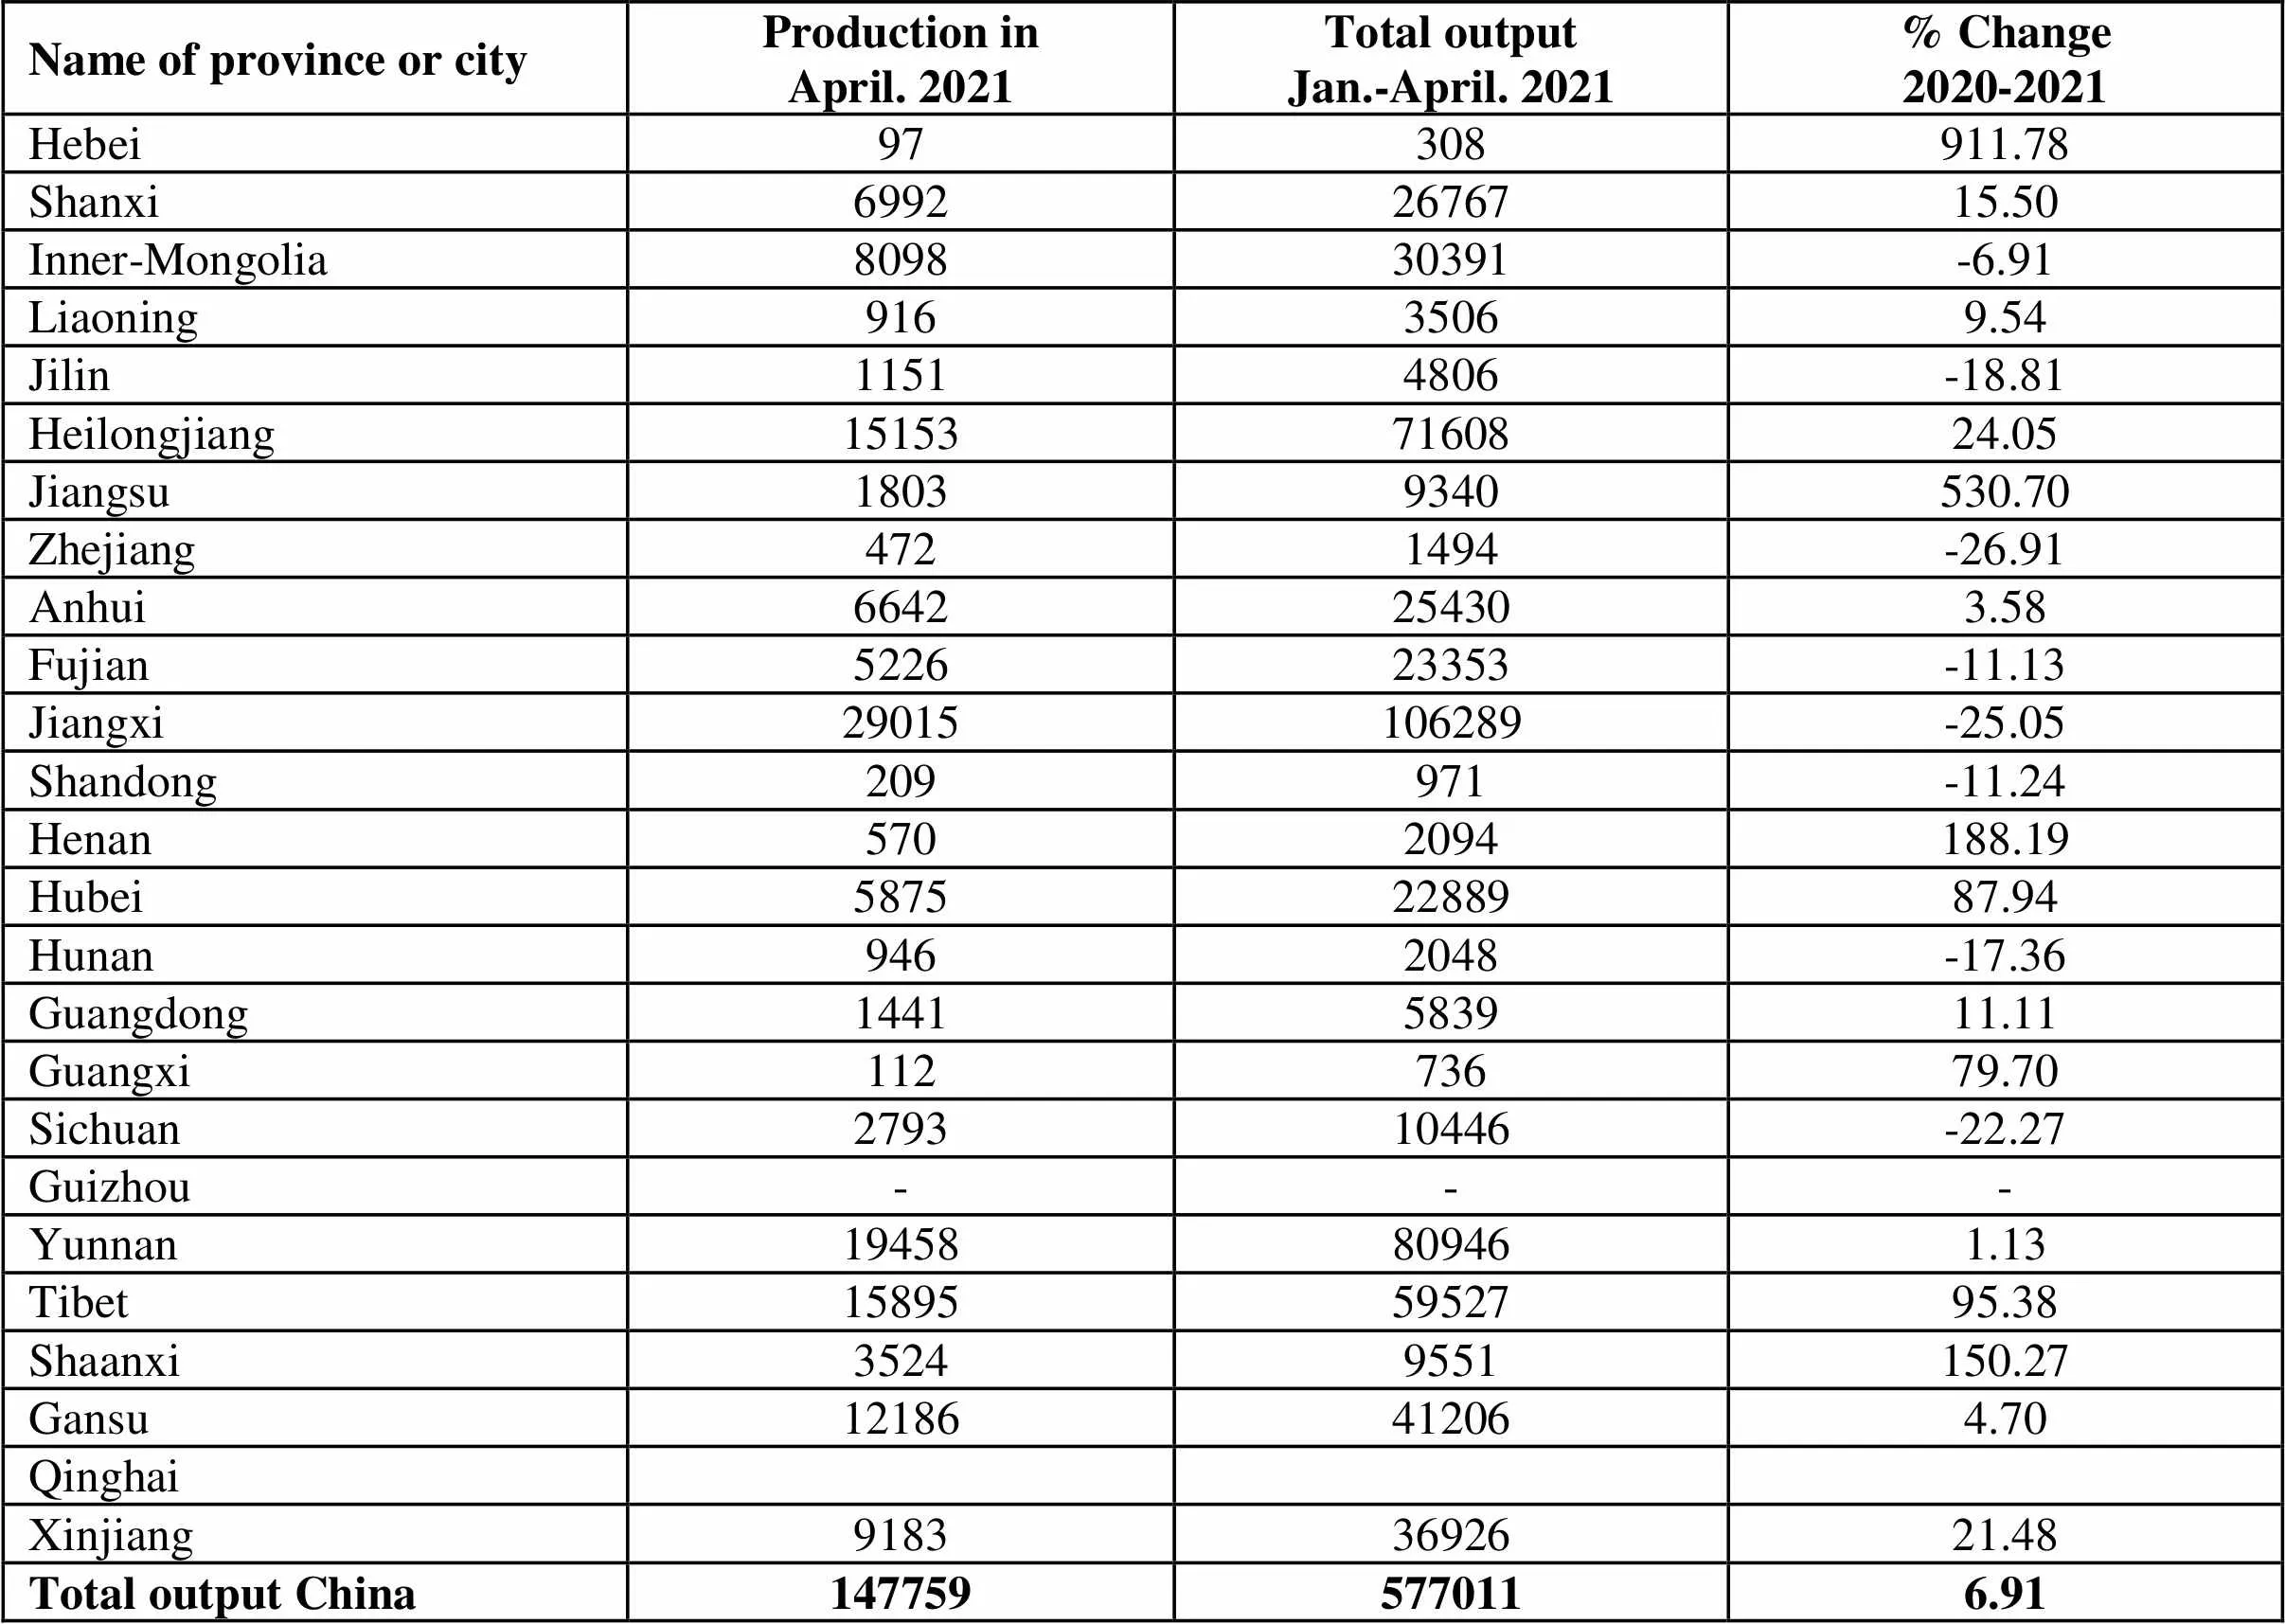
Name of province or cityProduction inApril. 2021Total outputJan.-April. 2021% Change2020-2021 Hebei97308911.78 Shanxi69922676715.50 Inner-Mongolia809830391-6.91 Liaoning91635069.54 Jilin11514806-18.81 Heilongjiang151537160824.05 Jiangsu18039340530.70 Zhejiang4721494-26.91 Anhui6642254303.58 Fujian522623353-11.13 Jiangxi29015106289-25.05 Shandong209971-11.24 Henan5702094188.19 Hubei58752288987.94 Hunan9462048-17.36 Guangdong1441583911.11 Guangxi11273679.70 Sichuan279310446-22.27 Guizhou--- Yunnan19458809461.13 Tibet158955952795.38 Shaanxi35249551150.27 Gansu12186412064.70 Qinghai Xinjiang91833692621.48 Total output China1477595770116.91
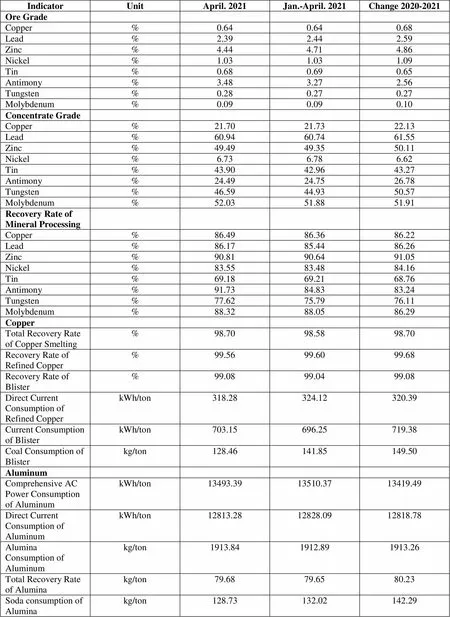
IndicatorUnitApril. 2021Jan.-April. 2021Change 2020-2021 Ore Grade Copper%0.640.640.68 Lead%2.392.442.59 Zinc%4.444.714.86 Nickel%1.031.031.09 Tin%0.680.690.65 Antimony%3.483.272.56 Tungsten%0.280.270.27 Molybdenum%0.090.090.10 Concentrate Grade Copper%21.7021.7322.13 Lead%60.9460.7461.55 Zinc%49.4949.3550.11 Nickel%6.736.786.62 Tin%43.9042.9643.27 Antimony%24.4924.7526.78 Tungsten%46.5944.9350.57 Molybdenum%52.0351.8851.91 Recovery Rate of Mineral Processing Copper%86.4986.3686.22 Lead%86.1785.4486.26 Zinc%90.8190.6491.05 Nickel%83.5583.4884.16 Tin%69.1869.2168.76 Antimony%91.7384.8383.24 Tungsten%77.6275.7976.11 Molybdenum%88.3288.0586.29 Copper Total Recovery Rate of Copper Smelting%98.7098.5898.70 Recovery Rate of Refined Copper%99.5699.6099.68 Recovery Rate of Blister%99.0899.0499.08 Direct Current Consumption of Refined CopperkWh/ton318.28324.12320.39 Current Consumption of BlisterkWh/ton703.15696.25719.38 Coal Consumption of Blisterkg/ton128.46141.85149.50 Aluminum Comprehensive AC Power Consumption of AluminumkWh/ton13493.3913510.3713419.49 Direct Current Consumption of AluminumkWh/ton12813.2812828.0912818.78 Alumina Consumption of Aluminumkg/ton1913.841912.891913.26 Total Recovery Rate of Aluminakg/ton79.6879.6580.23 Soda consumption of Aluminakg/ton128.73132.02142.29 Lead Total Recovery Rate of Lead Smelting%96.9697.1697.30 Recovery Rate of Lead Bullion%98.2498.2698.21 Coal Consumption of Lead Bullionkg/ton474.28321.21300.45 Direct Current Consumption of Refined LeadkWh/ton118.78117.84119.05 Zinc Total Recovery Rate of Refined Zinc%96.4196.3595.94 Direct Current Consumption of Refined ZinckWh/ton3027.023029.763030.08 Tin Total Recovery Rate of Tin Smelting%97.9497.6698.26 Direct Current Consumption of Tin SmeltingkWh/ton2318.252166.822111.01 Coal Consumption of Tin Smeltingkg/ton1287.571219.311528.29 Nickel Total Recovery Rate of Nickel Smelting%93.7194.1194.19 Antimony Total Recovery Rate of Antimony Smelting%98.2197.5896.22 Direct Current Consumption of Antimony SmeltingkWh/ton784.84743.17781.40 Yield of Processed Material Rate of Total Copper Products%81.6281.5179.75 Copper Melting %94.9796.0395.40 Copper Processing Products%84.7484.6283.10 Rate of Total Aluminum Products%68.0767.3766.54 Aluminum Melting%88.9989.1488.23 Aluminum Processing Products%76.1375.0874.66
Unit: metric ton
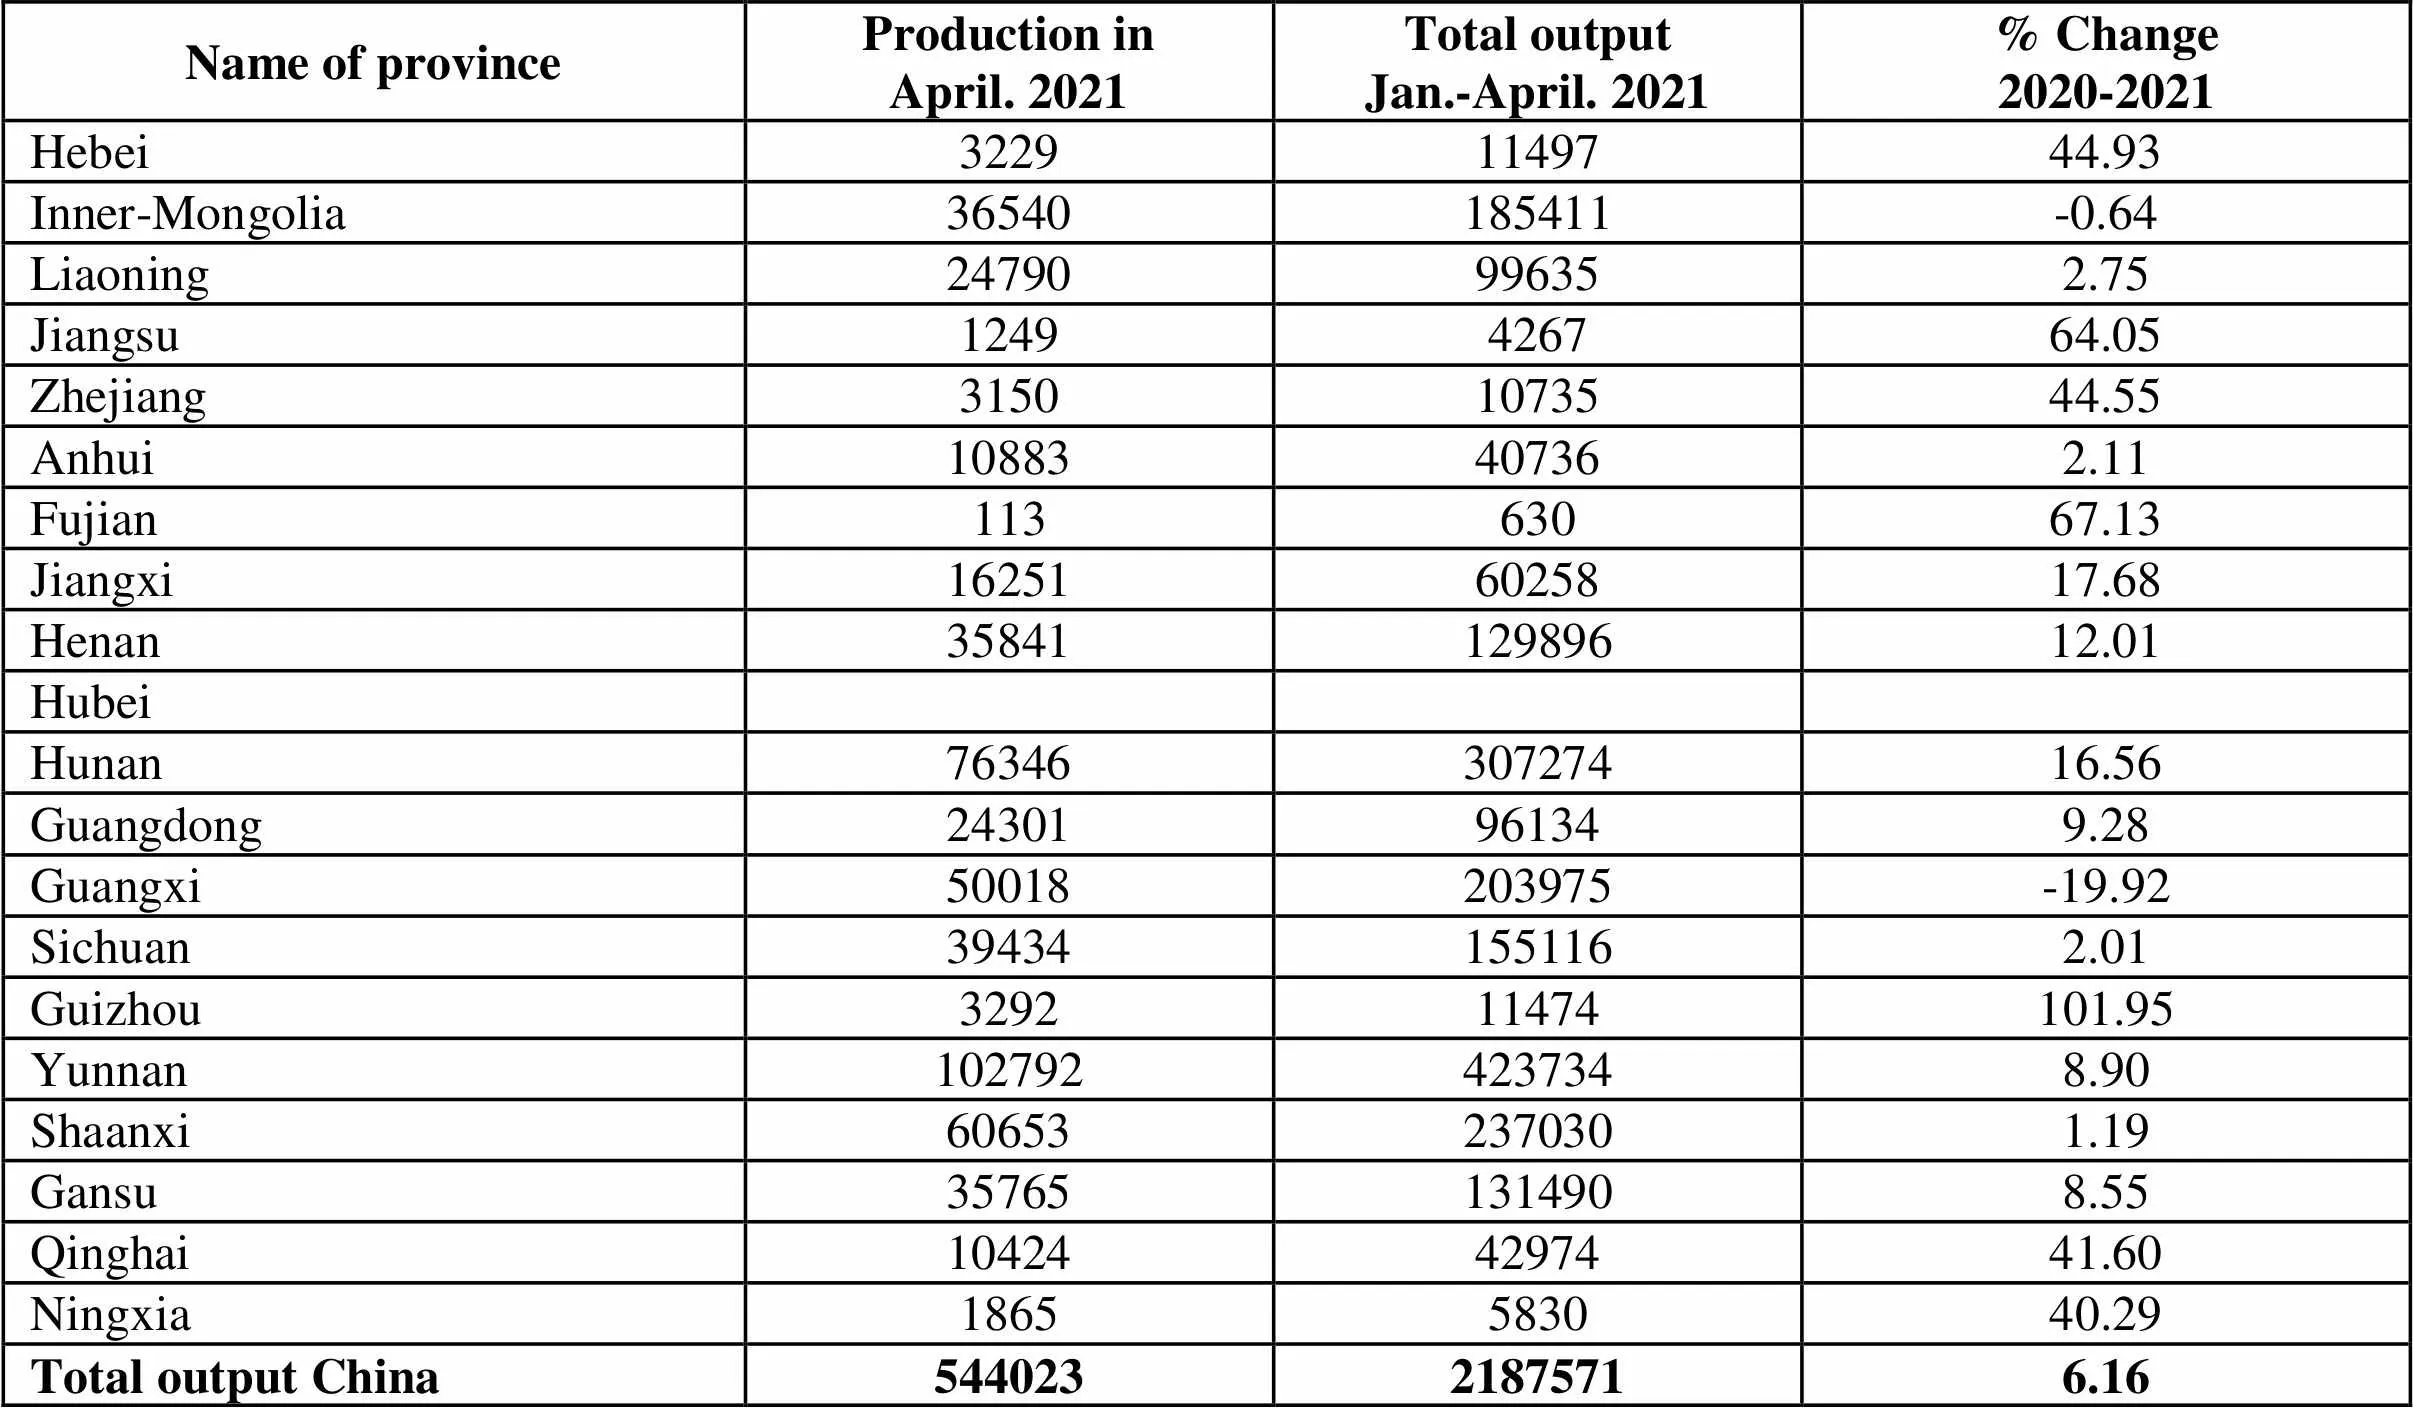
Name of provinceProduction inApril. 2021Total outputJan.-April. 2021% Change2020-2021 Hebei32291149744.93 Inner-Mongolia36540185411-0.64 Liaoning24790996352.75 Jiangsu1249426764.05 Zhejiang31501073544.55 Anhui10883407362.11 Fujian11363067.13 Jiangxi162516025817.68 Henan3584112989612.01 Hubei Hunan7634630727416.56 Guangdong24301961349.28 Guangxi50018203975-19.92 Sichuan394341551162.01 Guizhou329211474101.95 Yunnan1027924237348.90 Shaanxi606532370301.19 Gansu357651314908.55 Qinghai104244297441.60 Ningxia1865583040.29 Total output China54402321875716.16