Central South Lithium Plans to Set up Lithium Carbonate Joint Venture
2021-08-13 05:34:42
China Nonferrous Metals Monthly 2021年8期
Central South Lithium Plans to Set up Lithium Carbonate Joint Venture
Recently, Central South Lithium and Tibet Ngari Prefecture LiYuan Mining Development Co., Ltd. officially entered agreement in Liyang of Jiangsu, which marks their co-founding a joint venture --- Tibet LiNeng Lithium Science and Technology Co., Ltd. (shortened as Tibet LiNeng below), a platform on which the both sides operate their businesses. Tibet LiNeng is going to apply its leading technology of “l(fā)ithium extraction by electrochemical deintercalation” to dealing with salt lakes including Baqiancuo salt lake. The both parties reached consensus that they would complete the construction of lithium carbonate project with annual capacity of 10000 tons by the end of 2022. They plan to prioritize the scale construction of lithium carbonate project with annual capacity of 1000 tons and in later stage, Tibet LiNeng will follow a series of salt lake programs drawn up by shareholders to expand annual capacity to 20000-30000 tons. According to information, “salt lakes lithium extraction by electrochemical deintercalation” can realize brine lithium extraction that is featured by advantages of environment protecting, simple process, getting rid of other chemical reagents, high quality and recovery rate and low investment and production cost. Besides, exploitation license of Tibet Baqiancuo salt lake was further extended and issued on April, 2, 2021. Baqiancuo and Chabocuo and other salt lakes are featured by high-quality brine and impurities and are rich in resources of LiCl and B2O3.
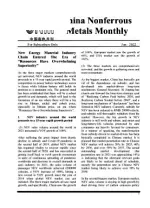
Unit: metric ton
Name of province or cityProduction inJun.2021Total outputJan.-Jun.2021% Change2020-2021 Zhejiang251118835.05 Jiangxi74913672666.28 Hunan Guangxi1392469145.36 Yunnan85505335115.46 Total output China2134411812537.20
Unit: metric ton

Name of provinceProduction inJun.2021Total outputJan.-Jun.2021% Change2020-2021 Shanxi10679595460.95 Henan201211925-8.24 Shaanxi5241130253716.92 Ningxia206112172-46.47 Xingjiang199214303-30.70 Total output China754444339548.13
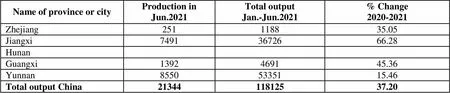
Unit: metric ton
Name of province or cityProduction inJun.2021Total outputJan.-Jun.2021% Change2020-2021 Tianjin22631-87.47 Hebei Shanxi123217286174.66 Inner-Mongolia3828634241124.92 Liaoning106776483624.60 Jilin8311605758.18 Shanghai Jiangsu2720916086321.94 Zhejiang4870528534517.44 Anhui857105472789.62 Fujian7132939057320.54 Jiangxi13332874848310.91 Shandong62487418365-6.10 Henan3112528272320.62 Hubei45031239743-0.82 Hunan118187161111.10 Guangdong141978004537.52 Guangxi9030851541118.23 Sichuan23139-62.58 Yunnan480703245700.08 Tibet6703869-19.23 Shaanxi92135575.89 Gansu604693470639.14 Xinjiang1243661299-10.95 Total output China836794515444612.25
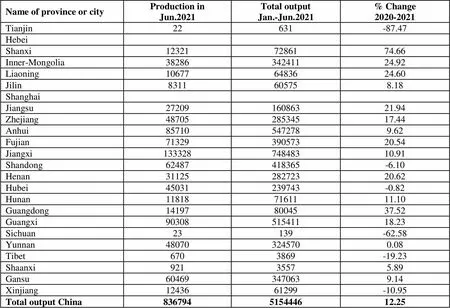
Unit: metric ton
Name of province or cityProduction inJun.2021Total outputJan.-Jun.2021% Change2020-2021 Shanxi8234348139131.21 Inner-Mongolia47567029341103.74 Liaoning3735622929822.09 Fujian6157356284.55 Shandong6694533953533-0.58 Henan1527498817811.43 Hubei67443984816.14 Guangxi236425123095714.39 Chongqing4126624481413.71 Sichuan7822546386064.29 Guizhou1125126790800.87 Yunnan279855183712476.20 Shaanxi74893453987-0.63 Gansu19272111661754.26 Qinghai221722130009710.00 Ningxia1006606068343.90 Xinjiang52052930913586.23 Total output China32904071963524510.06
Unit: metric ton
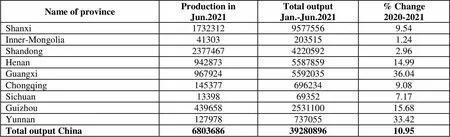
Name of province Production inJun.2021Total outputJan.-Jun.2021% Change2020-2021 Shanxi173231295775569.54 Inner-Mongolia413032035151.24 Shandong237746742205922.96 Henan942873558785914.99 Guangxi967924559203536.04 Chongqing1453776962349.08 Sichuan13398693527.17 Guizhou439658253110015.68 Yunnan12797873705533.42 Total output China68036863928089610.95
Unit: metric ton
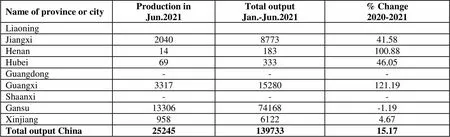
Name of province or cityProduction inJun.2021Total outputJan.-Jun.2021% Change2020-2021 Liaoning Jiangxi2040877341.58 Henan14183100.88 Hubei6933346.05 Guangdong--- Guangxi331715280121.19 Shaanxi--- Gansu1330674168-1.19 Xinjiang95861224.67 Total output China2524513973315.17
Unit: metric ton
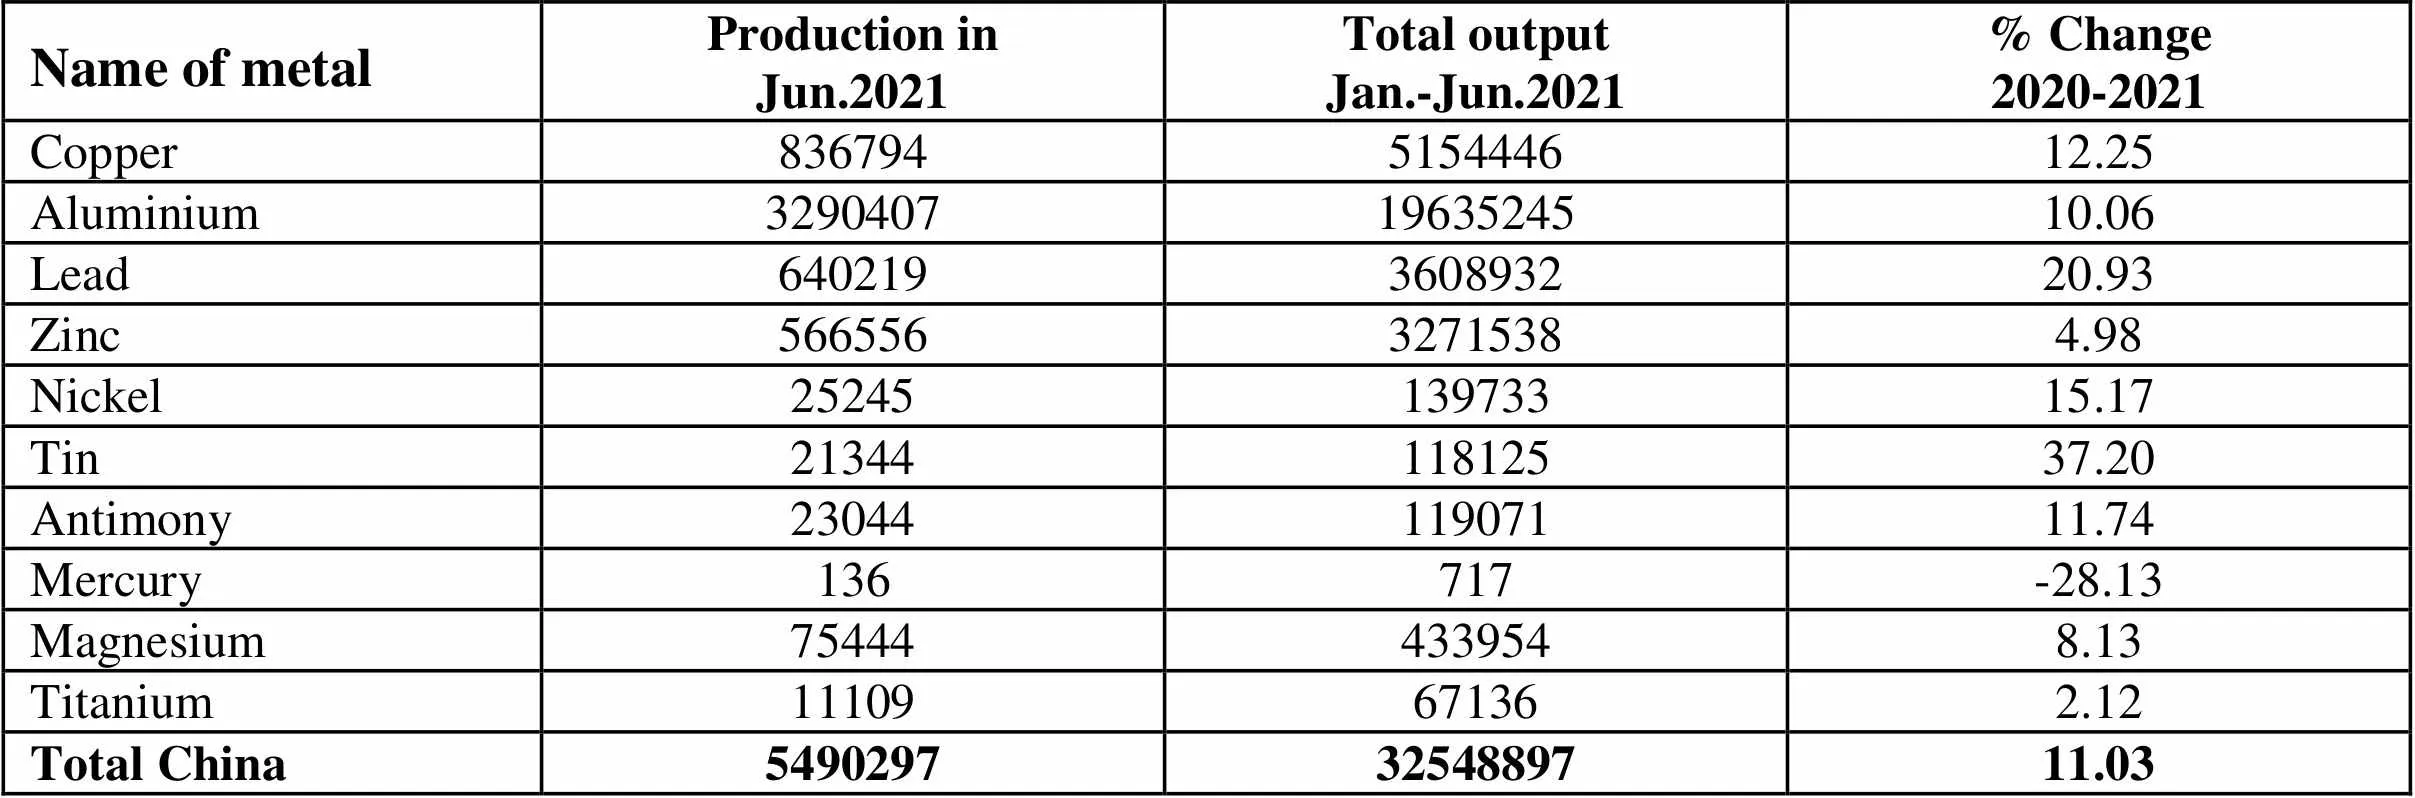
Name of metalProduction inJun.2021Total outputJan.-Jun.2021% Change2020-2021 Copper836794515444612.25 Aluminium32904071963524510.06 Lead640219360893220.93 Zinc56655632715384.98 Nickel2524513973315.17 Tin2134411812537.20 Antimony2304411907111.74 Mercury136717-28.13 Magnesium754444339548.13 Titanium11109671362.12 Total China54902973254889711.03
Unit: metric ton
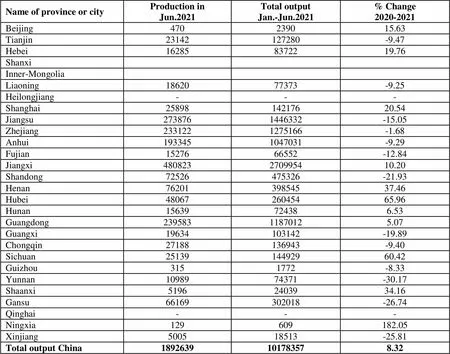
Name of province or cityProduction inJun.2021Total outputJan.-Jun.2021% Change2020-2021 Beijing470239015.63 Tianjin23142127280-9.47 Hebei162858372219.76 Shanxi Inner-Mongolia Liaoning1862077373-9.25 Heilongjiang--- Shanghai2589814217620.54 Jiangsu2738761446332-15.05 Zhejiang2331221275166-1.68 Anhui1933451047031-9.29 Fujian1527666552-12.84 Jiangxi480823270995410.20 Shandong72526475326-21.93 Henan7620139854537.46 Hubei4806726045465.96 Hunan15639724386.53 Guangdong23958311870125.07 Guangxi19634103142-19.89 Chongqin27188136943-9.40 Sichuan2513914492960.42 Guizhou3151772-8.33 Yunnan1098974371-30.17 Shaanxi51962403934.16 Gansu66169302018-26.74 Qinghai--- Ningxia129609182.05 Xinjiang500518513-25.81 Total output China1892639101783578.32
Unit: metric ton
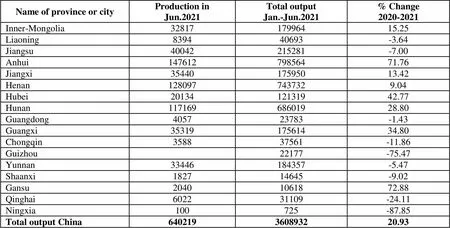
Name of province or cityProduction inJun.2021Total outputJan.-Jun.2021% Change2020-2021 Inner-Mongolia 3281717996415.25 Liaoning839440693-3.64 Jiangsu40042215281-7.00 Anhui14761279856471.76 Jiangxi3544017595013.42 Henan1280977437329.04 Hubei2013412131942.77 Hunan11716968601928.80 Guangdong405723783-1.43 Guangxi3531917561434.80 Chongqin358837561-11.86 Guizhou 22177-75.47 Yunnan33446184357-5.47 Shaanxi182714645-9.02 Gansu20401061872.88 Qinghai602231109-24.11 Ningxia100725-87.85 Total output China640219360893220.93
Unit: metric ton(metal content)
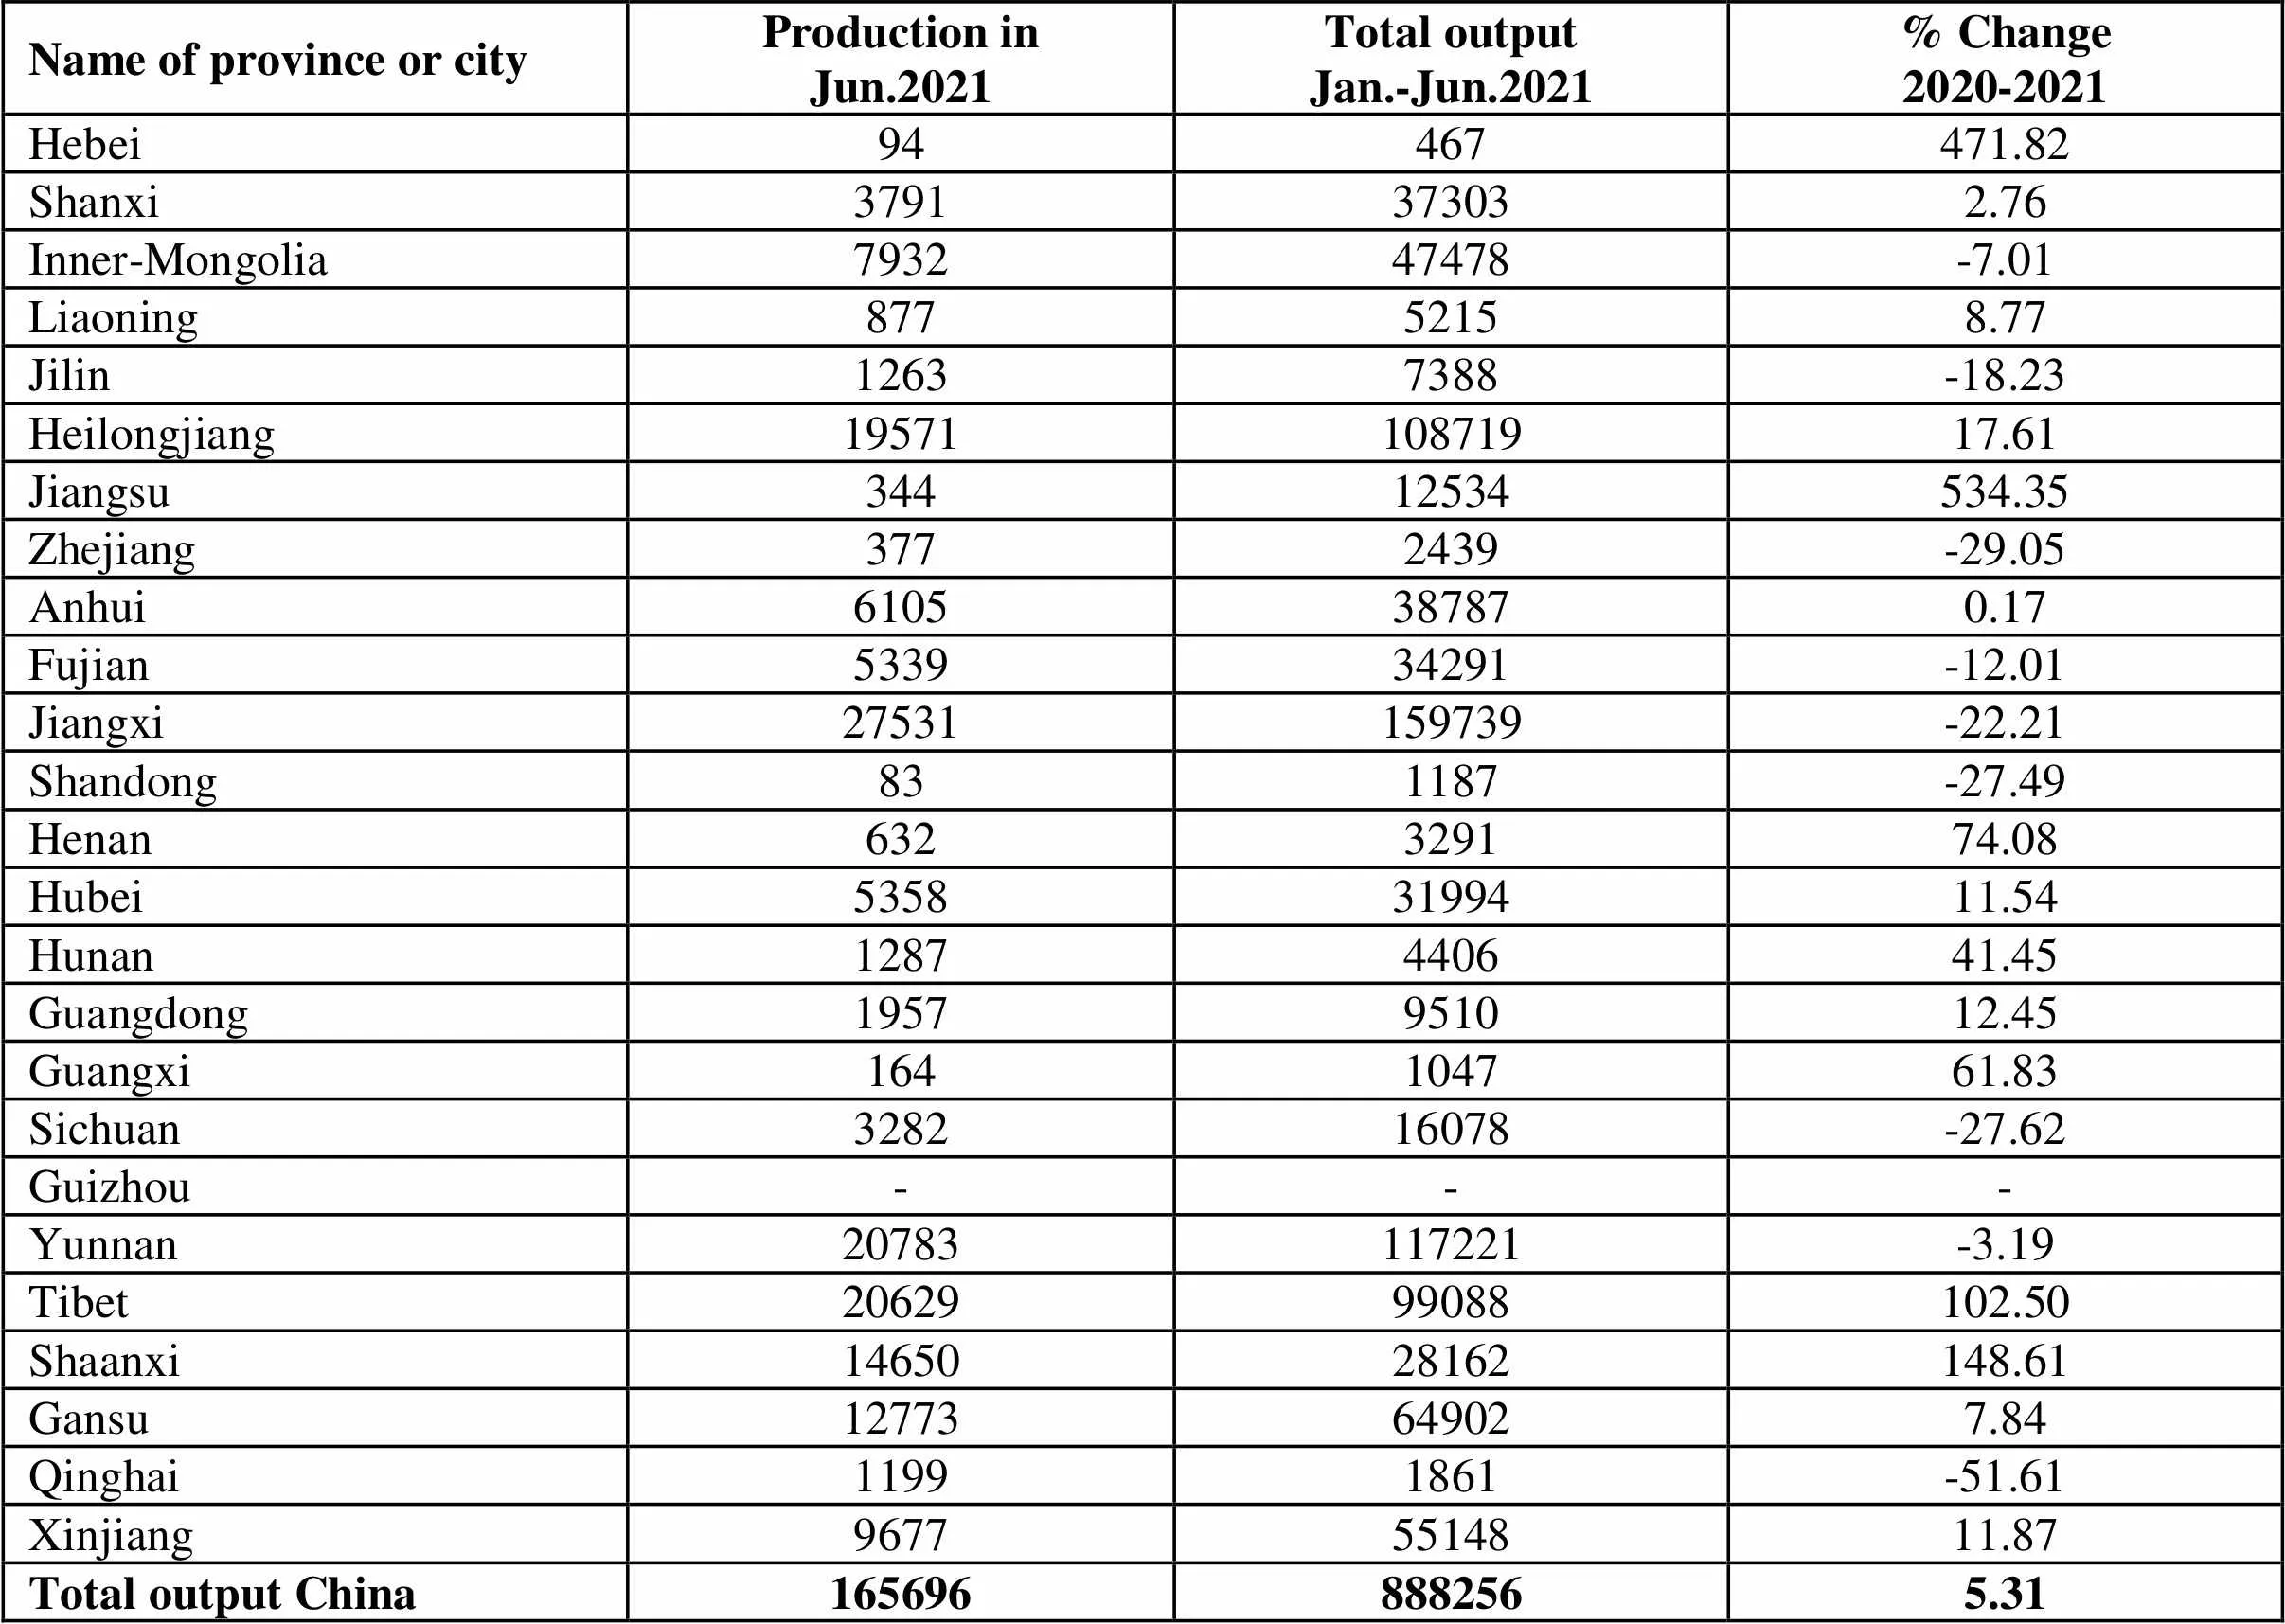
Name of province or cityProduction inJun.2021Total outputJan.-Jun.2021% Change2020-2021 Hebei94467471.82 Shanxi3791373032.76 Inner-Mongolia793247478-7.01 Liaoning87752158.77 Jilin12637388-18.23 Heilongjiang1957110871917.61 Jiangsu34412534534.35 Zhejiang3772439-29.05 Anhui6105387870.17 Fujian533934291-12.01 Jiangxi27531159739-22.21 Shandong831187-27.49 Henan632329174.08 Hubei53583199411.54 Hunan1287440641.45 Guangdong1957951012.45 Guangxi164104761.83 Sichuan328216078-27.62 Guizhou--- Yunnan20783117221-3.19 Tibet2062999088102.50 Shaanxi1465028162148.61 Gansu12773649027.84 Qinghai11991861-51.61 Xinjiang96775514811.87 Total output China1656968882565.31
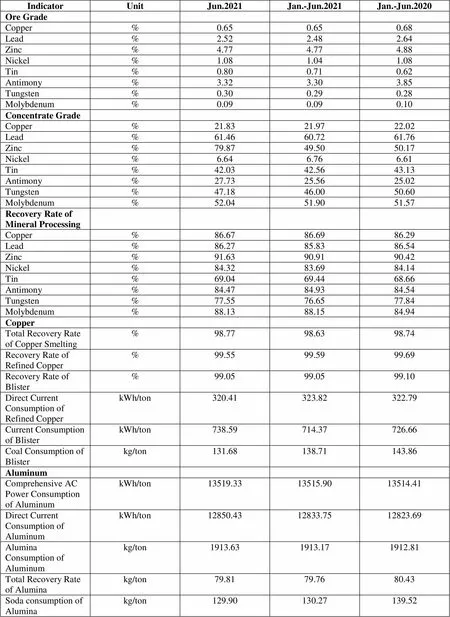
IndicatorUnitJun.2021Jan.-Jun.2021Jan.-Jun.2020 Ore Grade Copper%0.650.650.68 Lead%2.522.482.64 Zinc%4.774.774.88 Nickel%1.081.041.08 Tin%0.800.710.62 Antimony%3.323.303.85 Tungsten%0.300.290.28 Molybdenum%0.090.090.10 Concentrate Grade Copper%21.8321.9722.02 Lead%61.4660.7261.76 Zinc%79.8749.5050.17 Nickel%6.646.766.61 Tin%42.0342.5643.13 Antimony%27.7325.5625.02 Tungsten%47.1846.0050.60 Molybdenum%52.0451.9051.57 Recovery Rate of Mineral Processing Copper%86.6786.6986.29 Lead%86.2785.8386.54 Zinc%91.6390.9190.42 Nickel%84.3283.6984.14 Tin%69.0469.4468.66 Antimony%84.4784.9384.54 Tungsten%77.5576.6577.84 Molybdenum%88.1388.1584.94 Copper Total Recovery Rate of Copper Smelting%98.7798.6398.74 Recovery Rate of Refined Copper%99.5599.5999.69 Recovery Rate of Blister%99.0599.0599.10 Direct Current Consumption of Refined CopperkWh/ton320.41323.82322.79 Current Consumption of BlisterkWh/ton738.59714.37726.66 Coal Consumption of Blisterkg/ton131.68138.71143.86 Aluminum Comprehensive AC Power Consumption of AluminumkWh/ton13519.3313515.9013514.41 Direct Current Consumption of AluminumkWh/ton12850.4312833.7512823.69 Alumina Consumption of Aluminumkg/ton1913.631913.171912.81 Total Recovery Rate of Aluminakg/ton79.8179.7680.43 Soda consumption of Aluminakg/ton129.90130.27139.52 Lead Total Recovery Rate of Lead Smelting%97.3197.2097.25 Recovery Rate of Lead Bullion%98.3498.3198.06 Coal Consumption of Lead Bullionkg/ton325.42320.28257.83 Direct Current kWh/ton116.68117.50118.83 Consumption of Refined Leadkg/ton 329.32324.43321.29 Zinc Total Recovery Rate of Refined Zinc%96.2296.3196.12 Direct Current Consumption of Refined ZinckWh/ton3023.833041.803036.71 Tin Total Recovery Rate of Tin Smelting%97.8697.7398.29 Direct Current Consumption of Tin SmeltingkWh/ton2069.341758.672057.93 Coal Consumption of Tin Smeltingkg/ton1399.441328.801426.40 Nickel Total Recovery Rate of Nickel Smelting%96.1994.5694.17 Antimony Total Recovery Rate of Antimony Smelting%97.6997.7896.55 Direct Current Consumption of Antimony SmeltingkWh/ton866.63747.21767.32 Yield of Processed Material Rate of Total Copper Products%81.9781.6780.63 Copper Melting %96.1596.0595.80 Copper Processing Products%85.1784.7883.83 Rate of Total Aluminum Products%68.1667.6266.18 Aluminum Melting%89.5089.1388.42 Aluminum Processing Products%75.9775.4074.32
Unit: metric ton
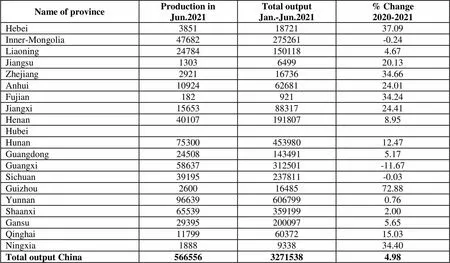
Name of provinceProduction inJun.2021Total outputJan.-Jun.2021% Change2020-2021 Hebei38511872137.09 Inner-Mongolia47682275261-0.24 Liaoning247841501184.67 Jiangsu1303649920.13 Zhejiang29211673634.66 Anhui109246268124.01 Fujian18292134.24 Jiangxi156538831724.41 Henan401071918078.95 Hubei Hunan7530045398012.47 Guangdong245081434915.17 Guangxi58637312501-11.67 Sichuan39195237811-0.03 Guizhou26001648572.88 Yunnan966396067990.76 Shaanxi655393591992.00 Gansu293952000975.65 Qinghai117996037215.03 Ningxia1888933834.40 Total output China56655632715384.98