Experimental investigation on DBD plasma reforming hydrocarbon blends
Shida XU (胥世達), Yun WU (吳云),2,?, Feilong SONG (宋飛龍),Xin CHEN (陳鑫) and Di JIN (金迪)
1 Science and Technology on Plasma Dynamics Laboratory, Air Force Engineering University, Xi’an 710038, People’s Republic of China
2 Institute of Aeroengine, Xi’an Jiaotong University, Xi’an 710049, People’s Republic of China
Abstract To improve the‘detonation-supporting’performance of fuel-rich catalytic combustion products,DBD plasma, stimulated by adjustable nanosecond pulse power supply, was used to further regulate the components and concentrations of the hydrocarbon blends.In this paper, the parameters including load voltage,frequency,rising(falling)edge,pulse width and feeding flow rate were changed respectively, and the corresponding concentration and proportion change of the components in blend gas were investigated.According to the experiment result,it was found that when the discharge frequency is low,the plasma mainly promotes the transformation of light gaseous substances, while it mainly promotes the conversion to heavy hydrocarbons when the frequency is larger.Increasing load voltage will strengthen this trend.The controlling and reforming effect of plasma on the blend gas will decrease with the increase of voltage rising(falling) edge and the feeding flow rate.The regulation effect will be strengthened with the increase of pulse width under 200 ns.With the increase of discharge intensity, the ‘carbon’settles on the walls of the reactor,which will change the dielectric constant,leading to the loss of control of the discharge.
Keywords: hydrocarbon blends, DBD plasma, reforming, carbon deposition
1.Introduction
In recent years, with the acceleration of the continuous rotating detonation engine(RDE)research progress,RDE has gradually developed from the initial detonation of small molecular hydrogen[1,2]and other single gaseous fuel[3,4]to the continuous rotating detonation of hydrocarbon blend gas fuel [5, 6] and even liquid fuel [7].The realization of kerosene-air continuous rotating detonation is an important step to the engineering application of RDE.However, due to the large molecular weight and low chemical activity of aviation kerosene, it is very difficult to realize the detonation of kerosene [8].At present, the commonly used method is to mix hydrogen in kerosene or add oxygen in air to realize the initiation of liquid kerosene[9,10].Austin and Shepherd[11]proposed the scheme of using JP-10 kerosene fuel-rich catalytic combustion products as fuel for detonation,which shows that the active small molecule gases produced by this method can greatly reduce the difficulty of kerosene detonation.Fuelrich catalytic combustion was originally proposed by NASA as a pretreatment scheme for aviation kerosene to meet the requirements of short ignition delay and fast chemical reaction in hypersonic air-breathing engines [12].However,according to the experiment by Austin and Shepherd, it was found that not all the small molecular gases produced are conducive to detonation, such as methane gas.Because of its stable molecular structure, it is difficult to be detonated,which is equivalent to an inhibitor gas.A small amount of carbon monoxide gas mixed in kerosene is conducive to detonation, but when its concentration exceeds 75%, it will also play a detonation-suppression role.Moreover, for blend gas-fueled detonation, it does not mean that the higher the contents of small molecular gases (such as hydrogen and ethylene) are, the better performance RDE will have [13, 14].Different operating conditions correspond to different optimum fuel compositions.Thus,it is required that the blend gas obtained by pretreatment should be further regulated to improve its ‘detonation-supporting’ performance.Plasma is often used for posttreatment of hydrocarbon fuels to improve their performance[15–19], for example, plasma could be used to modify the fuel composition or even to produce the fuel itself.Songet al[20]have found that when the plasma is used for fuel (n-decane)cracking, the high discharge frequency has selectivity to the small molecular olefin products, which indicates that the regulation effect can be effectively controlled by changing discharge parameters.A lot of research has found that plasma can effectively decrease the DDT (deflagration to detonation transition) distance and reduce the initiation energy of detonation[21–24].Claflin [25] proposed the plasma RDE patent in 2005 and the Cincinnati university conducted the experimental study of plasma RDE in 2018[14].It was found that the application of plasma can positively impact RDC operation at conditions that did not previously support rotating detonations and increase wave speed at some conditions.To more closely approximate practical engineering applications,the parallel-plate DBD with a discharge gap of 6 mm was used in this study.The effects of different discharge parameters and inflow conditions on the concentration,proportional distribution and carbon deposition of hydrocarbon blends are summarized and analyzed.

Figure 1.Scheme of the plasma reactor.
2.Experimental equipment and procedures
The core part of the cracking system is shown in figure 1, the main body of the plasma flow reactor is a rectangular quartz tube with a 10 mm×6 mm channel.The thickness of the upper and lower walls of the quartz channel is 1 mm.On the outside of the channel wall, there are respectively placed with 20 mm×10 mm×1 mm rectangular copper plate electrodes,which simulates the inner wall and outer wall of RDE.The copper plate electrodes are fixed by the upper and lower plastic shells.The two plastic shells are installed tightly with a vise.The copper plate electrode is clamped to the outer wall of the rectangular quartz tube at the same time.Two copper plate electrodes are connected with the high voltage electrode and ground electrode of the power supply respectively through two copper screws.
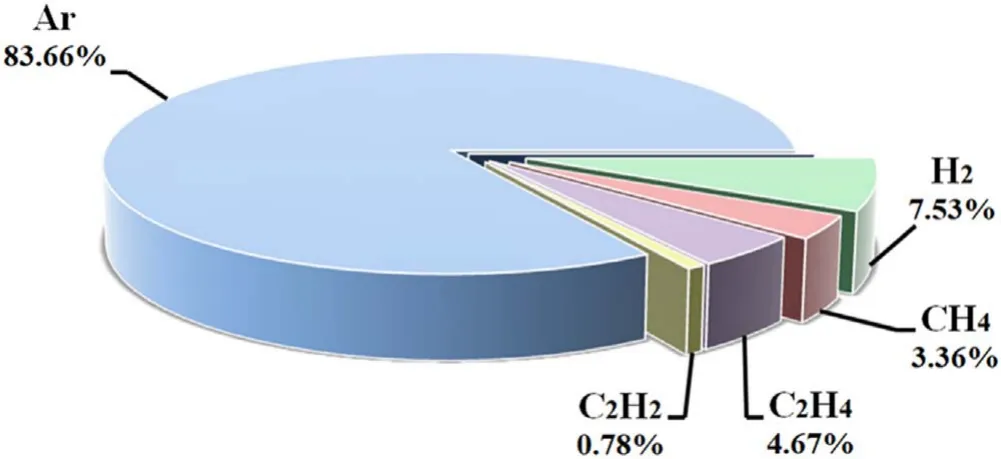
Figure 2.The percentage of main kinds of blend gas.

Table 1.Power supply detailed parameters.
When the 6 mm discharge gap is broken down,there will exist 1200 mm3diffuse and uniform DBD plasma region,which will regulate and reform the passing blend gas [26].The power supply used in the experiment is a custom-made(by Xi’an Jiaotong University) nanosecond pulse power supply with an independently adjustable frequency, voltage,pulse width,rising and falling edge.The variation envelope of each discharge parameter is shown in table 1.The applied voltage and current signals were measured by the P6015A voltage probe and TCP0030A current probe respectively.The MIDO3024 oscilloscope was used to record these two signals.
The DNS-FMC-400A mass flow controller was used to control the flow rate of mixed gas in the experiment.As the mass flow controller can only measure the flow rate of a certain gas,it can not accurately measure the flow rate of the non-standard blends.The mass flow controller was calibrated by soap foam flowmeter before the experiment,and the residence time of blend gas in the plasma will be calculated by the flow rate and the plasma region volume.At the exit of the flow reactor, the composition of the reformed blend gas was collected and detected by the gas chromatography (Agilent 7890B), which was equipped with a molecular-sieve capillary chromatography column (HPPLOT AL203 S,with a size of 25 m×0.32 mm,8.0 μm)and a thermal conductivity detector.The reformed blend gas obtainedunder each experimental condition was analyzed for three times,and the average value of the result was taken to reduce the experimental errors.

Table 2.Experimental conditions.
The composition of the original blend gas is shown in figure 2.The percentage of main kinds of blend gas refers to the JP-10 catalytic combustion products at an equivalence ratio of 5.06, with a reaction temperature of 1220 K in literature[11].Limited by the power supply,to reduce the flow reactor breakdown voltage, the equilibrium nitrogen gas in the literature[11]is replaced by argon in the experimental gas for easier discharge.Therefore,the experiment can change the discharge parameters in a wider range,and the regulation rule of the discharge parameters on the blend gas can be studied in detail.Besides, since the gas chromatograph is not equipped with a channel for detecting C1–C7oxygenate species, to prevent the oxidation reaction of the hydrocarbon gas, there are no O2, CO and CO2components in the blend gas.
The nanosecond pulsed DBD plasma discharge is affected by many factors, including voltage, frequency,waveform and so on.In this paper,the influences of incoming flow rate, discharge frequency, voltage, pulse width, rising and falling edge on plasma reforming are studied.The experimental conditions are shown in table 2.
3.Experimental results and analysis
3.1.Discharge characteristics
The typical nanosecond pulse DBD discharge waveforms are shown in figure 3 when the incoming flow rate is 400 sccm,and the discharge parameters are attached in the figure.From the image,it can be seen that there is a positive pulse current peak along with the rising voltage edge and a negative pulse current peak along with the falling voltage edge [27].
The single pulse energyJpulse(J) of the nanosecond discharge can be obtained by formula(1).Where,frepresents the discharge frequency under a certain condition,VtandItrepresent the instantaneous load voltage and discharge current respectively

The powerP(W)injected into the DBD flow reactor can be calculated by the following equation

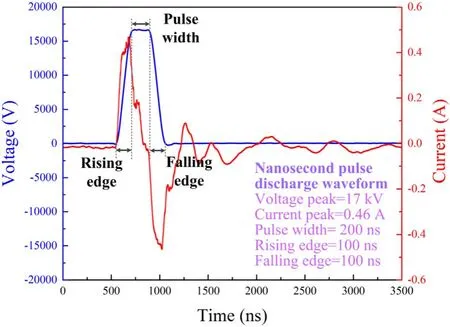
Figure 3.Typical voltage and current waveforms.
Energy density ED(J·l?1)represents the energy injected into the unit volume flow gas, which can be calculated by formula (3)

In the above formula,Frepresents gas flow, and its unit is l·s?1.
3.2.DBD reforming effect under different discharge parameters
3.2.1.Effect of discharge frequency and applied voltage on blend gas concentration.Keeping the feeding flow rate at 400 sccm constantly, two kinds of nanosecond pulse voltage(Group 1 in table 2) are applied to the flow reactor.The two peak voltages are 15 kV and 17 kV, respectively.The discharge frequency is changed from 0 to 10 kHz under each voltage condition.The concentration changes of the original four gases (except for argon) in the mixture are shown in figure 4.
The results show that with the increase of discharge frequency in a certain range, the concentrations of small molecular hydrogen, acetylene and methane also increase.When the discharge frequency is further increased, the concentrations of the above three gases decrease as the frequency continues to increase.The ethylene concentration always decreases as the frequency increases.It is indicated that the cracking of ethylene to produce small molecule acetylene, hydrogen and other active groups dominates the main reaction (formula (4a)) in the initial process of DBD plasma reforming [28, 29]

Figure 4.Concentration change of H2, CH4, C2H4, C2H2 under different frequencies and load voltages.
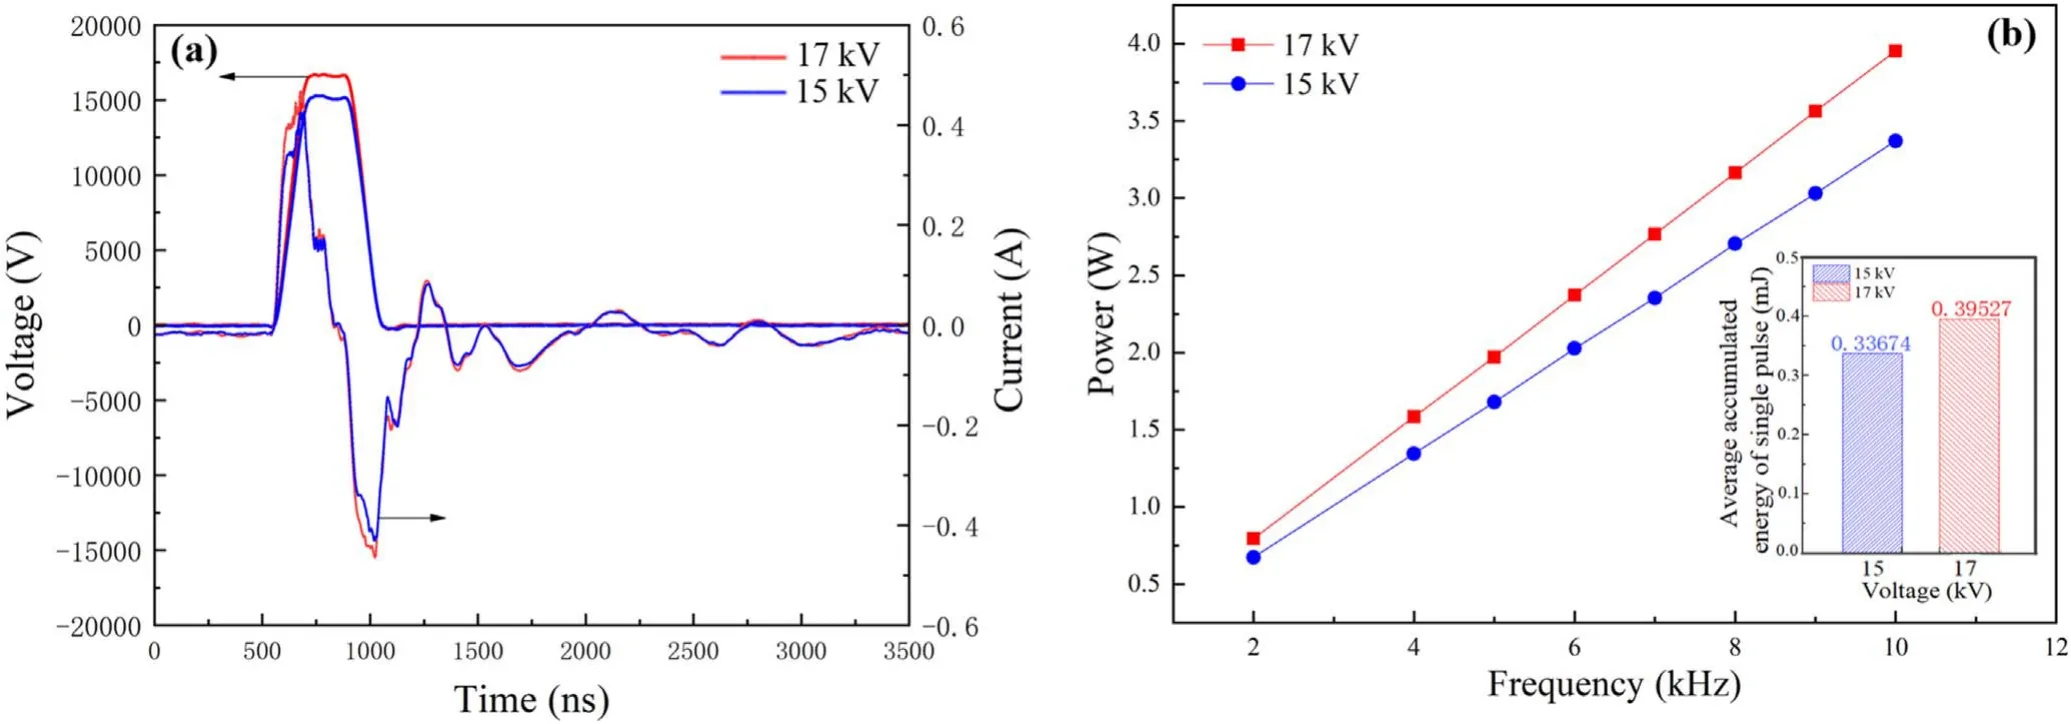
Figure 5.Current, voltage (a) and power, accumulated discharge energy of a single pulse (b) under the condition of 15 and 17 kV load voltage.

Since the final product concentration of the mixture is the result of the dynamic equilibrium of the generation and consumption reactions, with the discharge frequency increasing above a certain value, more free radicals will take part in the generation of new species.As a result,less radicals will be consumed to produce above light gases with the further increase of discharge frequency.In addition, methane also begins to be further decomposed into free radicals to participate in the formation of heavy hydrocarbons [30, 31](formula(4b)).However,the concentrations of hydrogen and acetylene are always higher than the original concentration of the mixture in the whole range of frequency(<10 kHz),while the final concentration of ethylene and methane is lower than the original concentration.For continuous rotating detonation,it can be known from the following tables (tables 3 and 4)[20] that the first two gases are more conducive to the initiation and propagation of detonation wave than the latter two, thus the regulation effect is beneficial.
Figure 5 shows the discharge parameters under the excitation of nanosecond pulsed power supply.Figure 5(a) is the waveforms of voltage and current under the load voltage of 15 kV and 17 kV, respectively.Figure 5(b) is the accumulated discharge energy of a single pulse and the power under two kinds of voltages.
It can be seen from the comparison in the above figure that as the discharge voltage increases, the discharge peak current also increases, which results in an increase in the accumulated discharge energy of a single pulse.Therefore,the discharge power will increase more rapidly with the increase of frequency for higher voltage, and so does the concentration change of the products.

Figure 6.Concentration change of C3H8, C2H6, C4H10 and C4H8, C3H6, C4H6 under different frequencies and load voltages.

Table 3.Cell size data for gaseous fuels [20].

Table 4.Critical initiation energy data for gaseous fuels [20].
As shown in figure 6, with the discharge frequency and discharge voltage increasing, besides the original four blend gases, C2–C4alkane species with relatively high-concentration, as well as low-concentration C3–C4unsaturated olefin and diolefin species can be detected in products.It is because the formation of alkane is an exothermic reaction, and the formation of olefin is just the opposite,that the reaction is more favorable for generating alkane under normal temperature conditions [20].What is more, as the voltage and frequency increase, the concentrations of newly formed products and the number of species also increase.On one hand, increasing voltage, the electric field strength (E) between discharge gap becomes larger.Based on the formula/λ=mveE22(whereλ,mandeare the electron mean free path, electron mass and electron charge amount,respectively),the electron gains higher energy,and its excitation cross section with the argon atom will increase,leading to generate more excited argon atoms.In turn,more collisional cracking reactions occur with the fuel molecules to obtain more free radicals or precursors required for the production of the product, so that the concentration of each particle in the reaction pool is increased.On the other hand, with the increase of discharge frequency, the discharge repetition time and the injected power per unit time in the reactor also increase(as figure 5(b)shows),and the concentration of each new product increases as well.What is more,as the pulse frequency increases,the increased ambient temperature of the reaction zone is also helpful to improve the chemical activity of the reactants.
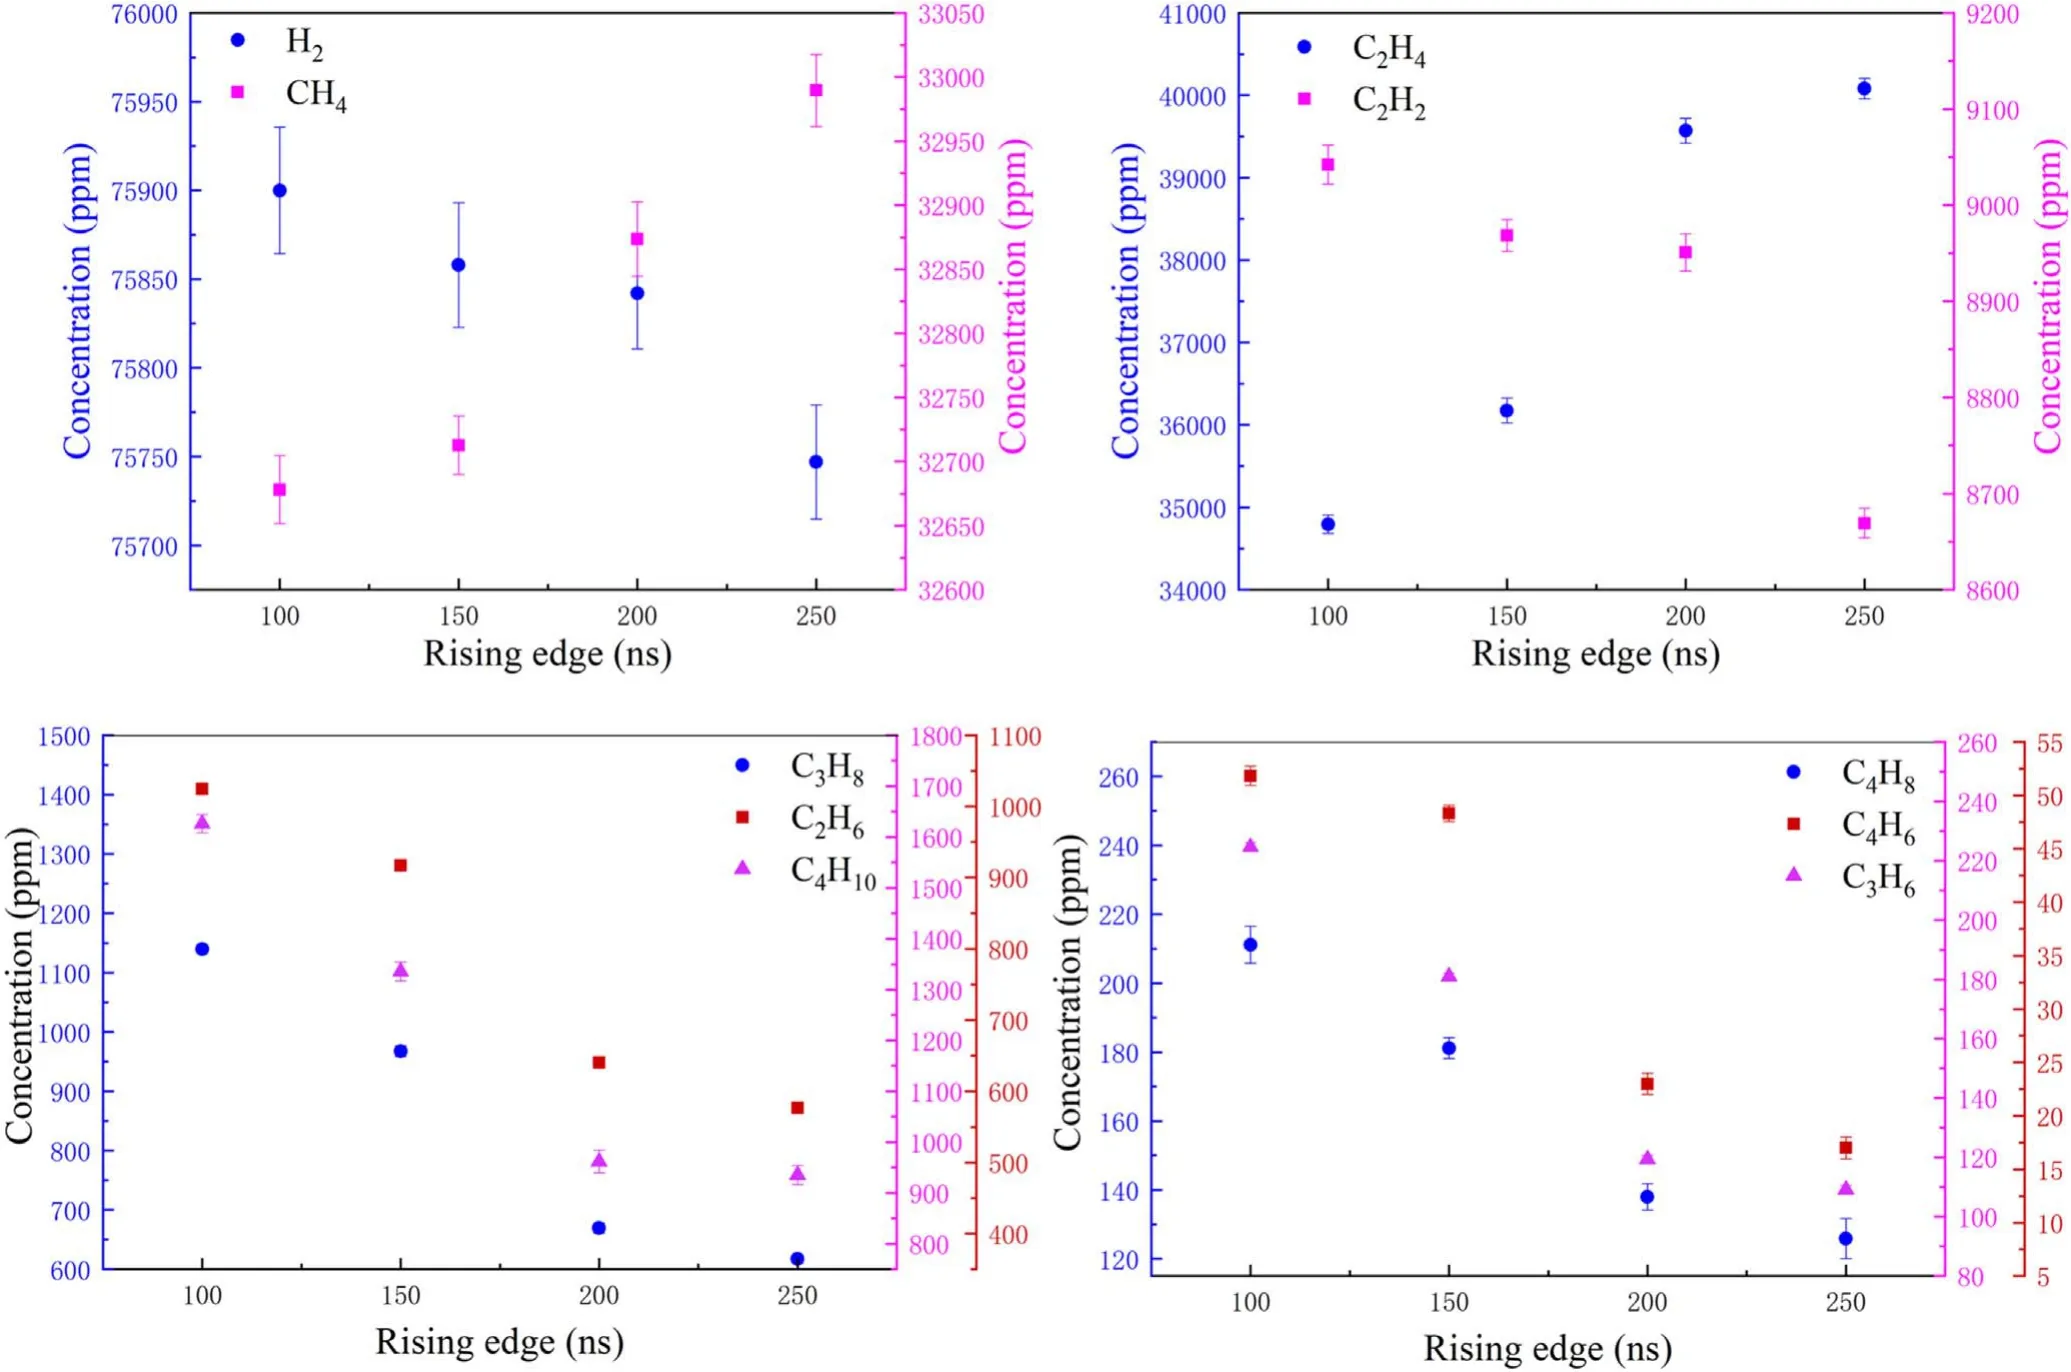
Figure 7.Concentration change of each component in blend gas under different pulse rising (falling) edges.
3.2.2.Effect of pulse rising and falling edge on blend gas concentration.Keeping the peak voltage,the pulse width,the frequency and flow rate unchanged, the pulse voltages with 100 ns,150 ns,200 ns and 250 ns rising edges(falling edges)are applied to the flow reactor respectively (Group 2 in table 2).It can be seen from figure 7,as the rising edge(falling edge)of the nanosecond pulse discharge voltage increases,the concentration of methane gradually increases toward the original level of the mixed gas, and similarly, the ethylene concentration also gradually increases.The concentration of hydrogen and acetylene gradually decreases to the initial concentration.According to the above analysis, the plasma reforming effect on the blend gas is gradually reduced.As the consumption of ethylene and methane gas is reduced, the production of small molecule hydrogen, acetylene and other free radicals is also reduced, resulting in a corresponding decrease in the concentration of the new alkane and olefin produced by the secondary reaction.It can be inferred from this changing rule that the change of rising edge will significantly affect the consumption of methane and ethylene,as well as the production of hydrogen,acetylene and new species.What is more,when the falling edge is too large(as shown by dotted lines in the figure),electrons will last for a long time in the discharge and can collide with the species which have been formed.
The reason for this phenomenon is that with the increase of the rising edge (falling edge) of nanosecond pulse discharge, the corresponding positive and negative peak currents decrease, resulting in the decrease of instantaneous power in the discharge process (as shown in figure 8).The simulation results of Zhu [32] also confirm this result.A slower rising edge of the voltage pulse corresponds to a slower and lower current pulse.When the voltage starts to be applied, the increasing voltage leads to the gap breakdown.Discharge makes charge accumulate on the other side of the dielectric to form a reverse potential.As the potential of high voltage electrode increases faster than reverse potential of dielectric side, there will be a difference between two potentials, and when the voltage pulse reaches the peak, the corresponding potential difference and the current also reaches the peak.As the rising edge of voltage becomes narrower, the potential difference expands more rapidly and the current peak becomes higher.When the pulse voltage is in the falling edge stage, so does the negative current peak.
According to the above analysis, it is known that increasing the rising edge (falling edge) usually reduces the effective power injected into the flow reactor.Although the increase of rising edge (falling edge) could prolong the discharge time, the lower instantaneous input power is not effective to energy injection and contributes little to the increase of production.Therefore, a proper reduction of the pulse rising edge (falling edge) is more conducive to enhancing the plasma reforming and controlling effect on the blend gas.
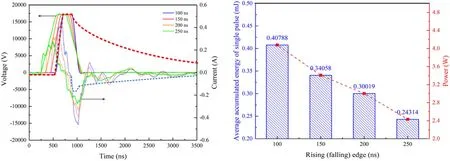
Figure 8.Current, voltage and power, accumulated discharge energy of a single pulse under different pulse rising (falling) edges.

Figure 9.Concentration change of each component in blend gas under different pulse widths.
3.2.3.Effect of pulse width on blend gas concentration.Ensuring the flow rate of blend gas, the rising (falling) edge,the peak voltage and the frequency unchanged, the discharge pulse width is changed from 0 to 400 ns(Group 3 in table 2).According to the results in figure 9,it can be found that when the pulse width is less than 200 ns, the plasma regulating effect on the blend gas is gradually enhanced with the pulse width increasing.Different from the influence of rising edge on hydrogen concentration, increasing the effective plasma treatment time of a single pulse is more likely to lead to a large amount of hydrogen being consumed before leaving the reaction system, resulting in a decrease in hydrogen concentration.When the discharge pulse width is changed from 200 to 300 ns, the regulating effect is weakened, the production of acetylene,the consumption of ethylene,methane,and hydrogen are all reduced, the number of free radicals as well as the concentration of newly formed high-concentration alkanes and low-concentration olefins,diolefins is also reduced.When the pulse width continues to increase to 400 ns, the intensity of regulation is restored,but its regulation level is still lower than that of 200 ns from the view of product concentration.It can be seen that the change of pulse width will affect the consumption of hydrogen,methane,ethylene and the formation of acetylene and new species.
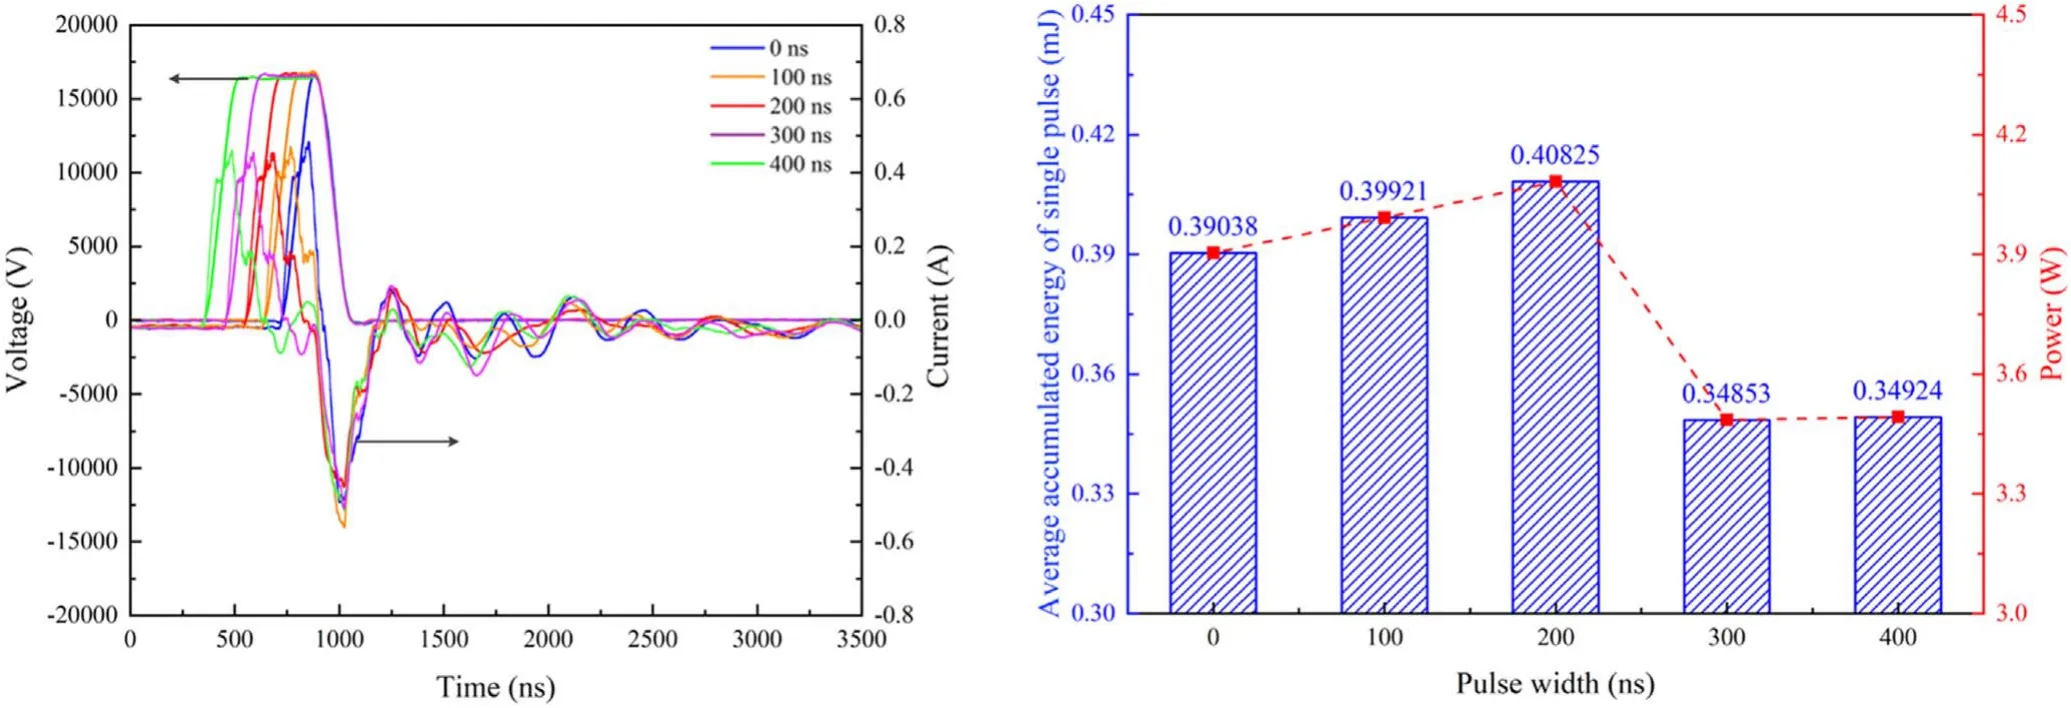
Figure 10.Current, voltage and power, accumulated discharge energy of a single pulse under different pulse widths.
According to the collected discharge parameters and the calculated accumulated discharge energy results, it can be seen from figure 10 that since the rising edges of the five pulse voltage waveforms are all 100 ns, it leads to the same rise edge and the same maximum value of the first positive current peak in the five current waveforms[33].However,the difference is that when the changing range of the pulse width is less than 200 ns, with the extension of the pulse width, the decreasing delay of the positive current main peak increases.In the voltage rising stage, the rising edge is very steep, the potential growth rate of high voltage electrode is much faster than that of the dielectric side.Since the duration of high potential (pulse width) is shorter, after the high voltage electrode reaches the maximum potential,the potential begins to decrease quickly.At this time, due to the continuous discharge of the flow reactor,the charge on the dielectric side still accumulates and the reversed potential continues to rise.When the potential on the dielectric side meets with the decreasing high voltage electrode potential, the discharge current will return to 0.Due to the short duration of high potential,the position where the potential difference returns to 0 is usually at the decline stage of high voltage electrode potential.So the longer the pulse width is, the later the potential difference reaches 0, the longer the corresponding current pulse width will be.The increased pulse width also leads to the increase in accumulated energy of a single pulse and injected power.At the same time, the longer the pulse width is, the more charges accumulated on one side of the dielectric, the higher the corresponding reverse potential will be when the potential difference is 0.However, the reversed current will return directly back to power supply, which makes no contribution to the reformation and regulation of blend gas.
When the pulse width exceeds 200 ns, the high voltage electrode potential can maintain the peak voltage for a long time until the reverse potential on the dielectric side is equal to it.Therefore, with the further increase of pulse width, the corresponding positive current pulse width will not increase any more.At this time, due to the limited charge retention capability, the flow reactor is in a state of dynamic equilibrium, and a small amplitude of positive and negative oscillation pulse currents will appear, which causes the corresponding control effect to fluctuate and even weaken.It can be seen from the concentration change of the product that the control effect under the pulse width of 400 ns is slightly lower than the control effect under 200 ns.Therefore, when selecting the pulse voltage width, the flow reactor structure should be fully considered, and the material (dielectric potential increasing rate) should be matched with the voltage waveform.An appropriate increase of pulse width within a certain range is beneficial to enhance the plasma reforming effect on blend gas.If the pulse width is too long,the energy utilization efficiency of the power supply will be greatly reduced, and the control intensity will be weakened.
3.2.4.Effect of feeding flow rate on blend gas concentration.As shown in figure 11, keeping the discharge parameters unchanged, the flow rate of the mixture is changed from 400 sccm to 600 sccm,800 sccm,1000 sccm and 1200 sccm,respectively(Group 4 in table 2).According to the change of the product concentration, it is found that the plasma reforming and controlling effects are gradually weakened with the increase of the mixture flow rate.The analysis of discharge parameters shows that in a small flow range,changing the feeding rate of blend gas has little influence on discharge parameters (as shown in figure 12).The main reason for this phenomenon is inferred that with the increase of blend gas flow rate, the residence time of blend gas molecules in plasma region is shortened and the reaction is more insufficient.The residence time of mixed gas molecules in the plasma region is 180 ms,120 ms,900 ms,respectively,under five kinds of gas flow rates.It can be known that with the increase of blend gas flow rate, the plasma injection energy per unit flow rate(energy density)decreases,resulting in the weakening of the reforming and regulating effects on blend gas.On one hand, the concentration of the newly formed species decreases, and the concentration of the original components in the mixture tends to be the initial concentration.On the other hand, the number of products species also decreases.
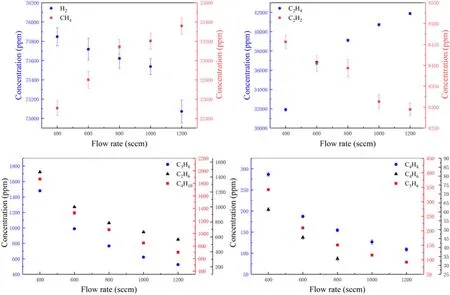
Figure 11.Concentration change of each component in blend gas under different gas flow rates.
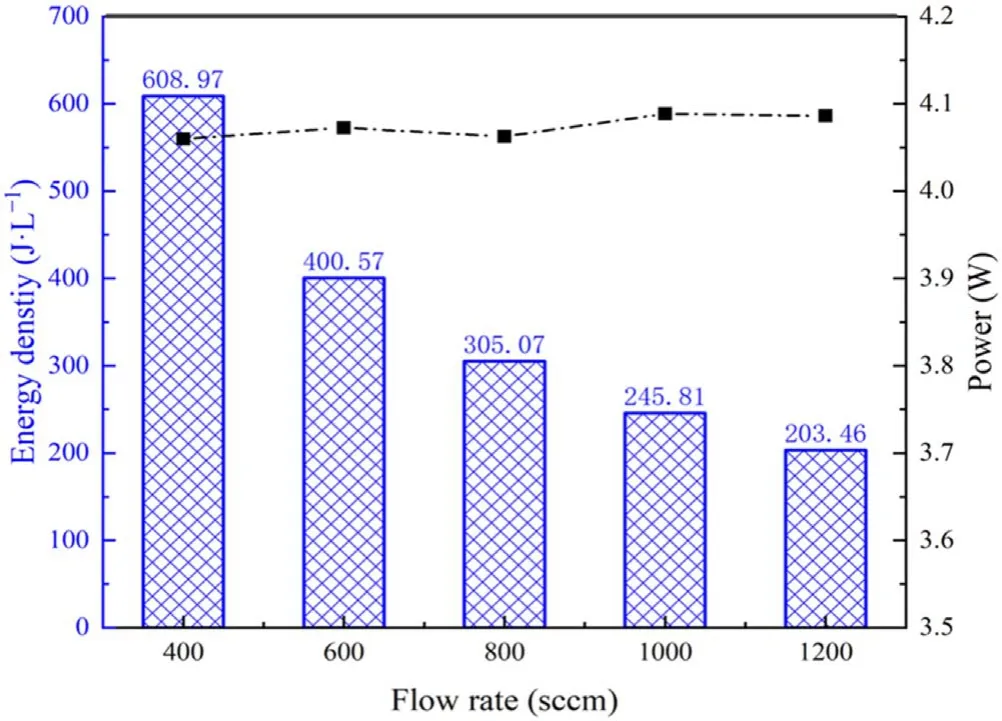
Figure 12.Energy density and injected power under different gas flow rates.
All in all, combining the above discharge parameters, it can be seen that under the frequency of less than 6 kHz,with the increase of discharge frequency, the hydrogen, methane,and acetylene in the mixture products will be increased, but excessive methane is not helpful for the initiation of the continuous RDE.Increasing the frequency more than 6 kHz will consume methane to reduce its concentration, but it will inevitably sacrifice the hydrogen and acetylene which are easy to be detonated.In order to achieve the purpose that regulates the composition of the blend gas to make it more favorable for the initiation and detonation, it is impossible to continuously improve its ‘detonation-supporting’ performance by increasing the discharge frequency to increase the injected power in the reactor.By shortening the rising edge (falling edge) of the pulse, the concentration of hydrogen and acetylene can be further increased,the concentration of methane can be lowered,and the power injected into the flow reactor can be continuously increased, thereby keeping on improving the regulating effect.In addition, for the DBD discharge structure in this experiment, when the pulse width is less than 200 ns,increasing the discharge pulse width can also improve the injection power, although the concentrations of hydrogen and methane will decrease, acetylene will continue to increase,which is also beneficial for the detonation.This is because many chemical reactions occur simultaneously in the process of plasma regulating the blend gas reaction,and different reaction paths respond differently to the changes of discharge parameters, which leads to different reaction paths occupying an advantage under different discharge parameters.In order to increase the injection power, changing different discharge parameters will lead to different changes in blend gas product concentrations.This is also the advantage of plasma regulating and reforming blend gas.
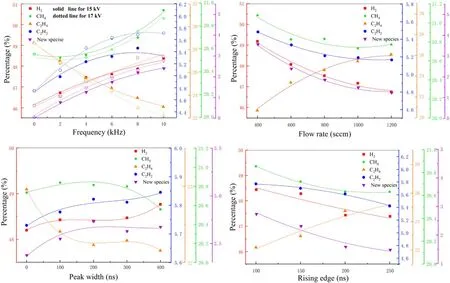
Figure 13.Proportion change of each component in blend gas under different discharge parameters and flow rates.
3.3.Effect of discharge parameters and flow rate on blend gas proportion
Combining with the change of product concentration, the close relationship among plasma regulation and discharge parameters as well as gas flow rate is analyzed in detail.For the change of discharge parameters, on one hand, the concentration of products and the number of species will change according to the different parameters, on the other hand, it will lead to the redistribution of the proportions of each product gas (except for argon) in the blend gas, and different product gases in the mixture also show different sensitivity(selectivity)to the change of parameters.Figure 13 shows the percentage of species in the plasma-controlled mixture under different experimental parameters.
According to the variation trend in the image, it can be found that it is different from the above influence of the frequency change on different components concentration in the blend gas.When the discharge frequency is increased,the proportion of the three small molecular hydrogen, methane and acetylene gases in blends is always increasing, while the proportion of ethylene is decreasing, and the proportions of newly formed alkanes and olefins and diolefins are also increased as the frequency increases.This is because when the frequency is low, increasing the discharge frequency will cause ethylene to be cracked into hydrogen, methane and other small molecular gases,and further dehydrogenation will generate acetylene.The newly formed free radicals react to form a large number of macromolecular alkanes as well as a small number of olefins and diolefins.At this time, the increased concentration of small molecule gases leads to the increased proportions of hydrogen,methane,and acetylene in the blend gas with the increase of frequency.With the further increase of discharge frequency, the concentrations of hydrogen, methane, and acetylene decrease due to the secondary reaction.However, the number of molecules in the blends decreases sharply, due to the formation of new macromolecule alkanes,olefins and diolefins,which results in the continued proportion increase of the small molecule gases in the mixture.At the same time, under the condition of changing frequency, compared with the consumption of small molecules such as hydrogen, methane, and acetylene, the large consumption of ethylene is the main reaction.So, the proportion of ethylene always decreases.Besides, it can be found that the proportion of ethylene and methane will further decrease with the increase of voltage,while the proportion of hydrogen, acetylene and newly formed species will further increase.Among them, the proportion of hydrogen is most insensitive to the change of voltage, while the proportion of acetylene in the mixture is most sensitive to the change of voltage.
As the flow rate increases, the energy density injected into the blend gas in the flow reactor decreases, and the regulation effect is weakened.The hydrogen and acetylene concentrations decrease closely to the original concentration,and the methane concentration tends to increase to original concentration.However, since ethylene is the main body of the reaction,as the flow rate increases,the regulation effect is weakened, the recovery of ethylene proportion is extremely significant, which leads to the decreased proportion of other gases, including the newly formed gases.
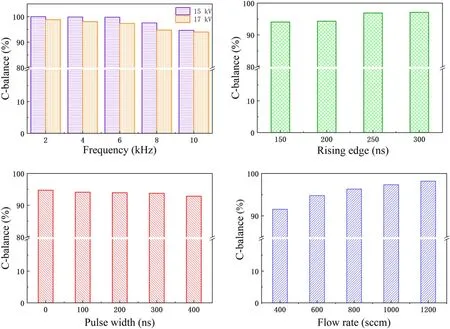
Figure 14.Carbon total concentration change under different discharge parameters and flow rates.
For the change of discharge pulse width, due to its limited regulation effect, before the pulse width is less than 200 ns, caused by the formation of macromolecule product gas, the total number of blend gas molecules is self-compressed, which results in the increased proportion of small molecule hydrogen, methane, and acetylene.The proportion of ethylene decreases, which is caused by the relatively large consumption.When the pulse width is greater than 200 ns,the regulating intensity keeps almost unchanged.The proportion of each product remains almost stable.It also shows that the proportion of species in blends is less sensitive to the change of pulse width when exceeding 200 ns.In other words, the discharge parameter of pulse width has limited chemical selectivity for the blend gas.
When it comes to the change of rising edge (falling edge), with the increase of rising edge (falling edge), the changing rule of the product proportion is opposite to that of the product proportion with the increase of frequency,and the same as the changing rule of the product proportion with the increase of blend gas flow rate.The reason can be inferred that with the increase of rising edge (falling edge), the injected power and the accumulated energy of a single pulse decrease, and the plasma regulating and reforming effects decrease accordingly.
3.4.Effect of discharge parameters and flow rate on carbon deposition
Under the condition of multiple discharge experiments,it was found that there are flaky attachments on the inner wall of the flow reactor in the plasma region and downstream.According to the detection,the attachments are a mixture of hydrocarbon polymers.It shows that there will be ‘carbon deposition’ in the process of plasma cracking and regulating blend gas,which will stick to the reactor inner wall, and will inevitably lead to the loss of carbon atoms in blend gas.Figure 14 shows the total amount of carbon under different discharge parameters and experimental conditions.
It can be seen from the figure that the total number of carbon atoms in the products increases with the increase of the blend gas flow rate,and gradually approaches the total number of carbon atoms in the original blends.According to the above analysis, some of the products undergo secondary or multiple plasma reactions,resulting in dehydrogenation polymerization,and resulting in polymers sticking to the surface of the reactor and leaving the blend gas.As the flow rate increases,the blend gas will be treated in the plasma region for less time, many newly formed products become stable species and run away from the plasma region before the secondary reaction,resulting in ‘carbon deposition’ weakened.
Increasing the rising edge of the voltage pulse reduces the cumulative amount of energy per pulse due to the reduced instantaneous power of the discharge.The energy used by the plasma to generate the high carbon polymer is also correspondingly reduced,and the number of carbon atoms leaving the system is reduced.By comparison,it can be found that the change rule of the total carbon is contrary to the change rule of new products of blend gas in the above.That is, as the rising edge of the voltage increases, the total number of carbon atoms in the blends increases and tends to the initial level.According to the previous analysis, this high carbon polymer mixture can also be regarded as a new product, and its production increases with the increase of injection energy along with other gaseous products.
With the increase of discharge frequency, the number of pulses processing blend gas increases.Before the products of the blends treated by the last plasma pulse leaving the reaction area, the next pulse discharge cycle has begun.The products will undergo two or more reactions in the plasma,resulting in more products to further form hydrocarbon polymers and thus leaving the products.Because of the higher instantaneous power when the voltage rises, the plasma processing efficiency increases and the lower the total carbon number of the blend products will be left.In other words, high voltage increases the carbon loss of mixture.
Increasing the pulse width of the discharge voltage,it can be found from the above figure that the total amount of carbon is reduced and the phenomenon of ‘carbon deposition’ is serious.Different from the existence of the best pulse width for the formation of new products, as the pulse width increases, the amount of produced hydrocarbon polymer always increases.
In addition, the high molecular polymer, as a good insulating medium, attaching to the inner wall surface of the glass flow reactor, will also change the discharge characteristics.Although the influence on the discharge gap is negligible, the insulating dielectric between two copper plate electrodes changes from ‘glass-blends-glass’ to ‘glass-polymer-blends-polymer-glass’.The change of insulating medium is bound to affect the discharge characteristics of the dielectric barrier discharge (DBD), power input and the effect of reforming blend gas[34].The experimental results show that the generation of carbon deposition on the inner wall of the flow reactor leads to a decrease in discharge intensity as well as discharge uniformity,which will further lead to a decrease in the corresponding current peak at the same load voltage,thereby affecting power injected into blend gas, causing the reforming effect of the plasma to be weakened.In addition,as mentioned above, the selection of the optimum discharge pulse width needs to be matched with the flow reactor.Due to the adhesion of the polymer, the potential growth rate on the dielectric side changes, which also leads to the optimal pulse width increasing.That is, due to the occurrence of ‘carbon deposition’, the optimal pulse width is increased, and the regulating effect corresponding to the optimum discharge parameters is also correspondingly weakened.
4.Conclusions
Generally speaking, by applying nanosecond DBD lowtemperature plasma,the proportion and concentration of each gas in the original mixture are regulated.On one hand, the concentration of explosive gases such as hydrogen and acetylene in the mixture is increased.On the other hand, the methyl generated by methane cracking is combined with other free radicals to form new alkanes and olefin products, thus converting the detonation-resistant methane into the gas fuel which is more easily to be detonated.By changing the frequency,voltage,rising edge(falling edge)and pulse width of the nanosecond pulse voltage, the concentration of each component in the blends changes regularly.Among them,due to the balance between the production and consumption of small molecular gases in the blends, there will be an optimal frequency at different voltages.The matching of flow reactor structure and pulse parameters will lead to the existence of optimal discharge pulse width.Although the essence of changing different discharge parameters is to change the injection power into flow reactor, different mechanisms and ways of increasing the injection power will lead to different response degrees of chemical reaction paths, that is, the selectivity and sensitivity of blend components to different discharge parameter change are different.Therefore, the appropriate discharge parameters can be selected to adjust the rate of formation and consumption of different gases according to the demand,and then the proportion of each component gas in the mixture can be adjusted.When plasma regulates the blends, hydrocarbon polymer will stick to the tube’s inner wall and leave the blend gas.This‘carbon deposition’will lead to the carbon loss of the blends.For different discharge parameters, the loss of carbon atom will also show different rules.At the same time,the adhesion of hydrocarbon polymer will also affect the dielectric structure of the reactor,which further affects the controlling and reforming effect of plasma on the blend gas.In addition, the change of gas flow rate will lead to the change of injected energy density into the blends, which also has a significant impact on the concentration and proportion of products in the blend gas and the generation of ‘carbon deposition’.
Acknowledgments
This research was supported by National Natural Science Foundation of China(Nos.91941105,91941301,51790511).
 Plasma Science and Technology2021年8期
- Plasma Science and Technology的其它文章
- Two-point model analysis of SOL plasma in EAST
- Line identification of boron and nitrogen emissions in extreme- and vacuumultraviolet wavelength ranges in the impurity powder dropping experiments of the Large Helical Device and its application to spectroscopic diagnostics
- Landau damping of twisted waves in Cairns distribution with anisotropic temperature
- Effects of magnetic field on electron power absorption in helicon fluid simulation
- Dependence of plasma structure and propagation on microwave amplitude and frequency during breakdown of atmospheric pressure air
- Machine learning application to predict the electron temperature on the J-TEXT tokamak
