Deep Learning Based User Grouping for FD-MIMO Systems Exploiting Statistical Channel State Information
Shupeng Ji,Qisheng Wang,Shiyu Wu,Jiachen Tian,Xiao Li,2,*,Wenjin Wang
1 National Mobile Communications Research Laboratory,Southeast University,Nanjing 210096,China
2 Pazhou Lab,Guangzhou 510330,China
Abstract: The joint spatial division and multiplexing(JSDM)is a two-phase precoding scheme for massive multiple-input-multiple-output(MIMO)system under frequency division duplex (FDD) mode to reduce the amount of channel state information (CSI) feedback.To apply this scheme,users need to be partitioned into groups so that users in the same group have similar channel covariance eigenvectors while users in different groups have almost orthogonal eigenvectors.In this paper,taking the clustered user model into account,we consider the user grouping of JSDM for the downlink massive MIMO system with uniform planar antenna array (UPA) at base station (BS).A deep learning based user grouping algorithm is proposed to improve the efficiency of the user grouping process.The proposed grouping algorithm transfers the statistical CSI of all users into a picture,and utilizes the deep learning enabled objective detection model you look only once(YOLO)to divide the users into different groups rapidly.Simulation results show that the proposed user grouping scheme can achieve higher sum rate with less time delay.
Keywords: deep learning; objective detection;YOLO;user grouping;massive MIMO;JSDM
I.INTRODUCTION
Due to the advantage of implementing large scale antennas in restricted space so as to implement massive multiple-input multiple-output(MIMO)[1,2]and fully exploiting the degree-of-freedom in both horizontal and vertical dimension,full-dimension MIMO(FD-MIMO) has attracted much attention and been considered as one of the promising techniques for future communication systems[3,4].However,the acquisition of channel state information (CSI) at base station(BS)becomes a bottle-neck for frequency division duplex(FDD)systems.To achieve higher spectral efficiency with less amount of CSI feedback,the joint spatial division and multiplexing (JSDM),which applies a two-stage precoding based on second-order statistical CSI,was proposed in[5].The users with similar statistical CSI were clustered into the same group,while the statistical CSI of the users in different groups were approximately orthogonal.Thus,the statistical CSI were used to suppress inter-group interference,and only small amount of instantaneous CSI were required to eliminate intra-group interference.Since it requires users in different groups to be statistically orthogonal,an effective user grouping algorithm plays an important role to make it work.
In general,user grouping is composed of a similarity measure stage to qualify the resemblance between different users and a grouping stage to arrange users with high similarity into the same group [5–11].The eigenvectors of second-order statistical CSI,the normalized dynamic channel condition,and the weighted likelihood of the eigenvectors of user’s channel correlation matrix were regarded as the similitude metric in [6–8],respectively.To partition the users into different groups,the K-means clustering algorithm was adopted in these works.However,the K-means clustering algorithm involves recursively calculating the user’s similarity,which is time-consuming.The eigenmode of channel correlation matrix were utilized in[9,10,12].In [9,10],it was used to measure user similitude and users were divided into groups by geometric block to support spatial multiplexing.In [12],the eigenmodes of different users were used to measure the distances among them,and users were partitioned into groups based on these distances.
All these works considered the users to be randomly distributed in the cell with uniformly distributed angles of arrival (AoAs),and these user grouping algorithms usually have large computation delay.However,in typical dense urban scenarios,it is very common that users are concentrated in several groups,e.g.,at the coffee shops or the airports[13].Thus,the clustered user geometry(CUG)model was proposed[11].In this model,users in the same cluster have similar transmit correlation.Exploiting this property may improve the performance of the grouping algorithm.Recently,the artificial intelligence based methods,such as deep learning (DL) and deep reinforcement learning(DRL)methods,have been shown to perform well in solving the problems that are difficult to model[14],while reducing the time consumption,such as channel estimation[15–17]and reconstruction[18],user scheduling[19,20],beamforming design[21–25],and etc.The deep supervised learning-based user grouping algorithm in [26]successfully reduced the time consumption,while achieved a grouping accuracy inferior to that of K-means clustering.
In this paper,we propose a DL-enabled user grouping algorithm based on the well-known objective detection approach,namely,you look only once(YOLO)[27].YOLO has achieved remarkable performance in numerous objective detection tasks,i.e.,the face recognition and pedestrian detection [28].It can detect the target objects fast and give the positions of the corresponding bounding boxes of these objects.Considering the CUG model and uniform planar array(UPA)at the BS,we transfer the statistic CSI,i.e.,the vertical and horizontal statistical eigenmodes,of a certain user into a two-dimensional red green blue(RGB)image.In this image,the bright spots correspond to the non-zero eigenmodes of the user’s channel correlation matrix.The locations of these bright spots contain the information of the horizontal and vertical indexes of these non-zero eigenmodes.We show that,under the considered scenario,this statistical CSI image of a certain user contains a single isolated bright area formed by these bright spots.Then,we add the statistical CSI images of all users into a single image.We derive that,on this image,users whose non-zero eigenmodes fall in the same bright area that can not be clearly separated should be put in the same group,and users whose non-zero eigenmodes fall in different bright areas that are clearly separated by dark areas should be divided into different groups.Then,YOLO is used to detect the isolated bright areas as user groups,and the boundary coordinates of each group is obtained for subsequent user grouping and two-stage precoding.Simulations show that the proposed YOLO-based user grouping algorithm runs rapidly and achieves higher sum rate compared with the other grouping methods.
The rest of this paper is organized as follows.The considered channel model and user distribution model are given in Section II.The proposed YOLO-based user grouping algorithm is introduced in detail in Section III.In Section IV,the simulation settings and results are presented to verify the performance of the proposed user grouping algorithm.Finally,Section V concludes this paper.
II.SYSTEM MODEL AND PROBLEM FORMULATION
In this paper,we consider a single-cell FD-MIMO downlink transmission system in which a BS with anM × N(M,N ?1) UPA communicates withKsingle-antenna users,and the radius of the cell isR.The UPA holdsMantennas in each column and a total number ofNcolumns in the horizontal dimension with antenna spacingd.Considering the JSDM scheme[5],the users are divided intoGgroups and groupgcontainsKgusers.The received signal at thek-th user in theg-th group can be written as

wherexgkis the transmit data symbol for userkin groupgsatisfying E{|xgk|2}= 1,ρgkis the average transmit power to userkin groupg,satisfyingρis the total transmit power,ngkis the noise with the distributionCN(0,σ2gk),σ2gkis the power of the noise,wgksatisfying||wgk||2= 1 is the normalized two-layer precoding vector formulated as

Bg ∈CMN×Ngis the outer precoder to suppress the inter-group interference withNg ≥Kg,vgk ∈CNg×1is the inner precoder to suppress the inter-user interference within theg-th group,

which is the channel vector between the BS and thek-th user in theg-th group[9],βgkis the large-scale fading factor,and Hgk ∈CM×Nis the small-scale fading matrix.In this paper,we consider the correlated Rayleigh fading[9].Under this model,Hgk=the entries ofare independent and identically distributed random variables with the distributionCN(0,1),RV,gk ∈CM×Mand RH,gk ∈CN×Nare the vertical and horizontal correlation matrices of thek-th user in groupg.Thus,hgkcan be rewritten as

The CUG model of user distribution is considered here.Under this model,users are distributed in clusters,i.e.,they are concentrated at certain areas in the cell,such as bus stops,residential buildings,and etc.One-ring scattering model is applied as in[13]to determine the horizontal and vertical correlation matrices.The radius of each user cluster is much smaller than the cell radius,thus the angle spread of each user is limited.The users in the same cluster have similar horizontal and vertical correlation matrices.Figure 1 shows an example of this user distribution.We assume that there areCsuch user clusters distributed in the cell,and there areCcusers in clusterc.
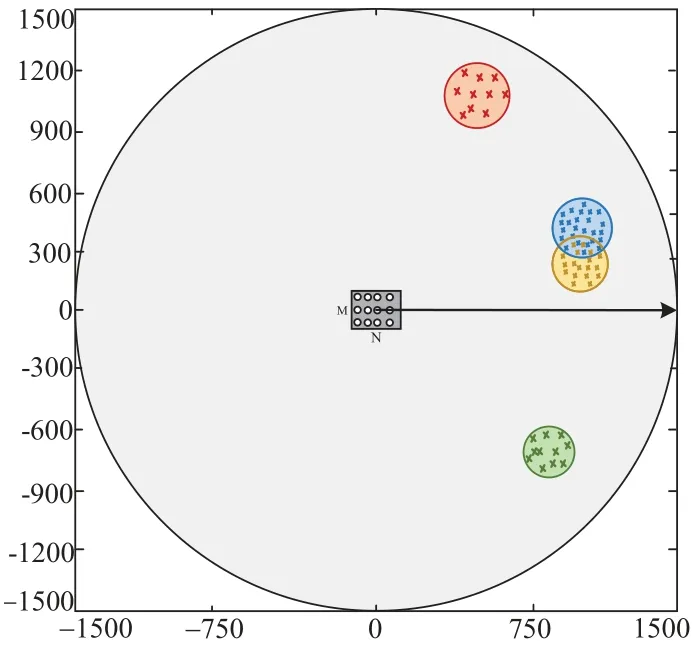
Figure 1.User distribution under CUG model.
Applying the aforementioned two-layer precoding algorithm seems practically favorable,since it reduces the overhead of downlink training and CSI feedback[5].However,to make it work,the users should be partitioned into several groups in advance.The users in different groups should be orthogonal in dominant correlation eigenvectors,i.e.,the eigenvectors corresponding to the dominant eigenvalues of Rgk,while users in the same group should have similar dominant correlation eigenvectors[6].In this case,the outer precoding matrix Bgcan be set as the dominant correlation eigenvectors of groupg,so that the outer precoder can mitigate the inter-group interference.It may suffer significant performance degradation,if the users are not properly grouped.In [6–8],K-means clustering were used to partition the users into different groups according to their statistical CSI.However,the K-means clustering algorithm is timeconsuming.In this paper,we propose a user grouping algorithm based on the well-trained YOLO network exploiting the statistical statistical CSI of different users that can solve this problem efficiently.
III.YOLO-BASED USER GROUPING ALGORITHM
In this section,we first transfer the users’ statistical CSI into an RGB image,and demonstrate that this RGB image can be used as the similarity metric to divide users into different groups.Then,we propose a user grouping method using the object detection algorithm YOLO,and introduce how to train a YOLO network for the user grouping scenario.
3.1 Statistical CSI as an Image
Note that the eigenvectors of RV,gkand RH,gkcan be approximated by the DFT matrices FM ∈CM×Mand FN ∈CN×Nas the number of antennas grow large,i.e.,M,N →∞[5].Let us define

Thus,in the massive FD-MIMO system considered here,ΛV,gk ∈CM×Mand ΛH,gk ∈CN×Nbecome diagonal matrices with the diagonal elements being the eigenvalues of RV,gkand RH,gk.Moreover,the diagonal matrices ΛV,gkand ΛH,gkhave only a few adjacent non-zero diagonal elements[5].The correlation matrix Rgkcan be further written as

where F=F?N ?FM.Let us further define

where diag(X) denotes taking the diagonal elements of X as a vector.Then,λV,gkandλH,gkhave the form
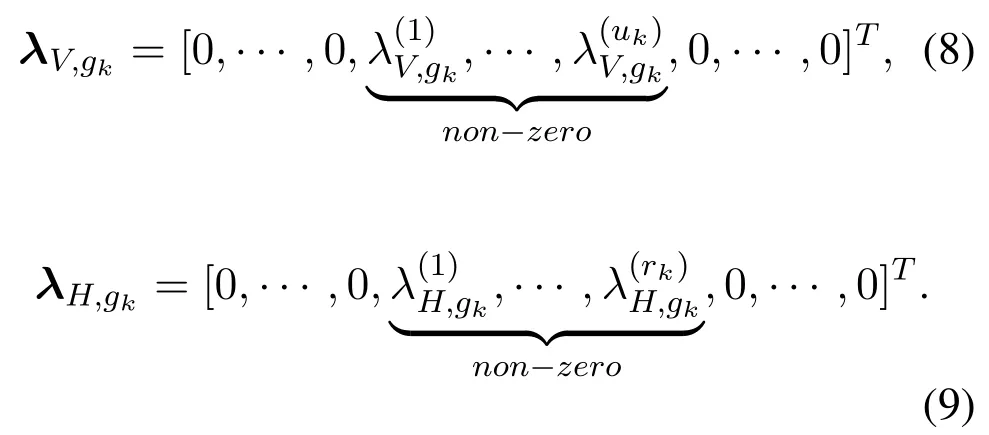
As mentioned before,to make the two-layer precoding algorithm work,the users in different groups should be orthogonal in dominant correlation eigenvectors.From the above analysis,for the considered massive FD-MIMO system,all the users share the same eigenvectors F.Thus,the users in different groups,i.e.,userkin groupgand userlin groupp,should satisfy that the non-zero diagonal elements of ΛH,gk ?ΛV,gkand ΛH,pl ?ΛV,plare orthogonal.This equals to the constraint

Note that
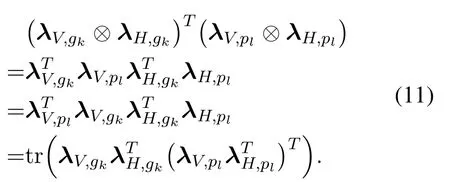
Let us define

Thus,combining(10)and(11),the constraint(10)can be converted to

Note that,in practice,some elements ofλV,gkandλH,gkmight be very close to,but not equal to 0.To strictly satisfy the constraint(10)may complicate the grouping problem.To avoid this impact,we set a thresholdλth,and define a matrixwith its(m,n)-th elementas

whereis the (m,n)-th element of Ωgk,is the largest element of Ωgk,and(lk,jk)is the corresponding index ofin the matrix Ωgk.With this matrix,the constraint(13)is modified to


where⊙represents the Hadamad product,and 0M×Nrepresents aM ×Nmatrix with all elements equal to 0.
Then,let us convert the matrixinto an image.Figure 2a gives an example of the converted image.It is a two-dimensional RGB image withM × Npixels.Its (m,n)-th pixel corresponds to the (m,n)-th elements of.The yellow pixel represents that the corresponding element ofis above 0,while the dark blue pixel represents that the corresponding element ofis 0.From this figure,it can be seen that this image is mostly covered by dark blue area except a very limited bright area.This is becauseλV,gkandλH,gkhave only a few adjacent non-zero elements.Using this method,we could draw the matrixandonto the same image,such as Figure 2b and Figure 2c.If the two users satisfy the constraint(16),which means they can be put into different groups,we will get an image with two isolated bright area,as shown in Figure 2b.If the two users do not satisfy the constraint (16),which means they should be put into the same group,then the bright areas corresponding to different users will overlap with each other,as shown in Figure 2c.
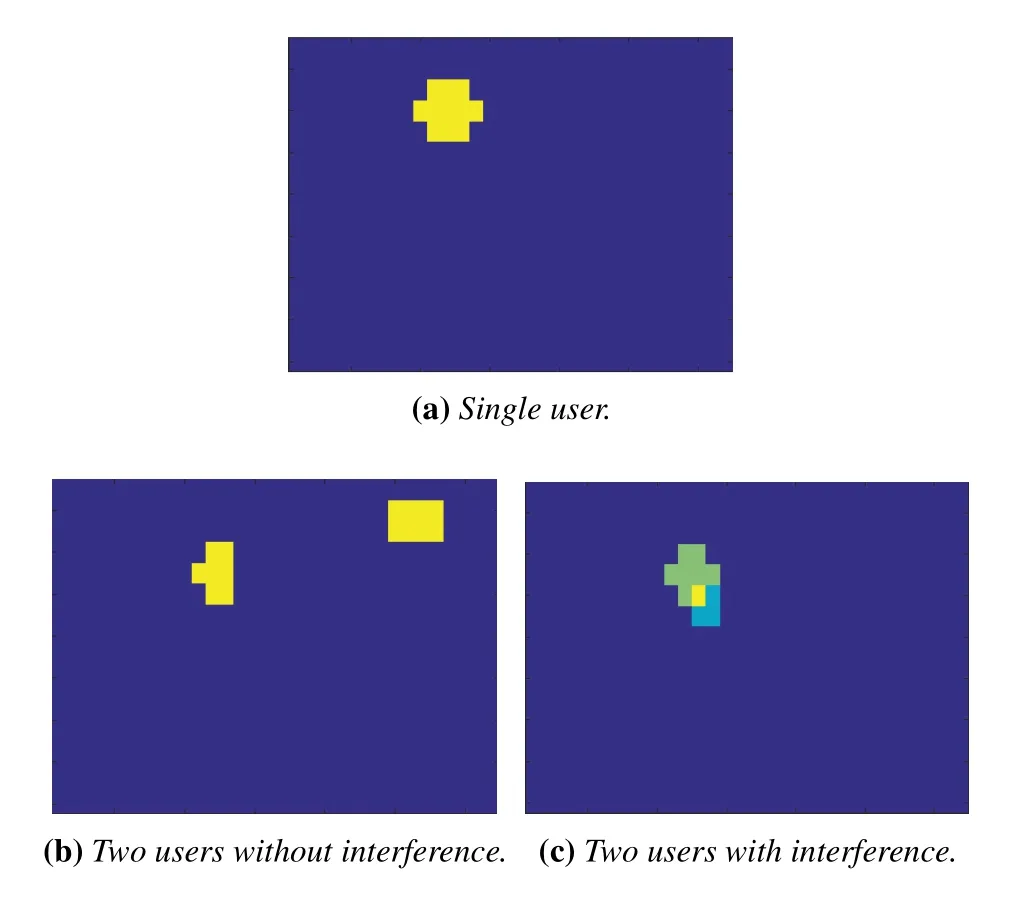
Figure 2.An example to draw the statistical CSI of single and two users as images,where the k-th user is represented by a colored area,and the vertical axis ranges from 1 to N,while the horizontal axis ranges from 1 to M.
Based on the above analysis,it can be seen that we could draw the statistical CSI of all users into one image,and use this image to perform the user grouping,i.e.,the users whose bright areas can be separated from each other belong to different groups,and the users whose bright areas are overlapped should be put into the same group.Let us define

Then,Figure 3 gives an example of the obtained statistical CSI image.In this figure,there areC=4 user clusters,each cluster containsCc ∈[5,8]users.The method to generate the horizontal and vertical correlation matrices of these users are the same with the method described in the simulation results.As mentioned before,the yellow pixel represents that the corresponding element ofis above 0,and the dark blue pixel represents that the corresponding element ofis 0.It can be seen that this image shows fabulous sparsity,majority of user clusters are isolated,and few clusters that intersect too much can be treated as a larger cluster.When the bounds of non-overlapped clusters are obtained,the users can be naturally partitioned into different groups.As can be seen,in Figure 3,the users can be partitioned into 3 groups.
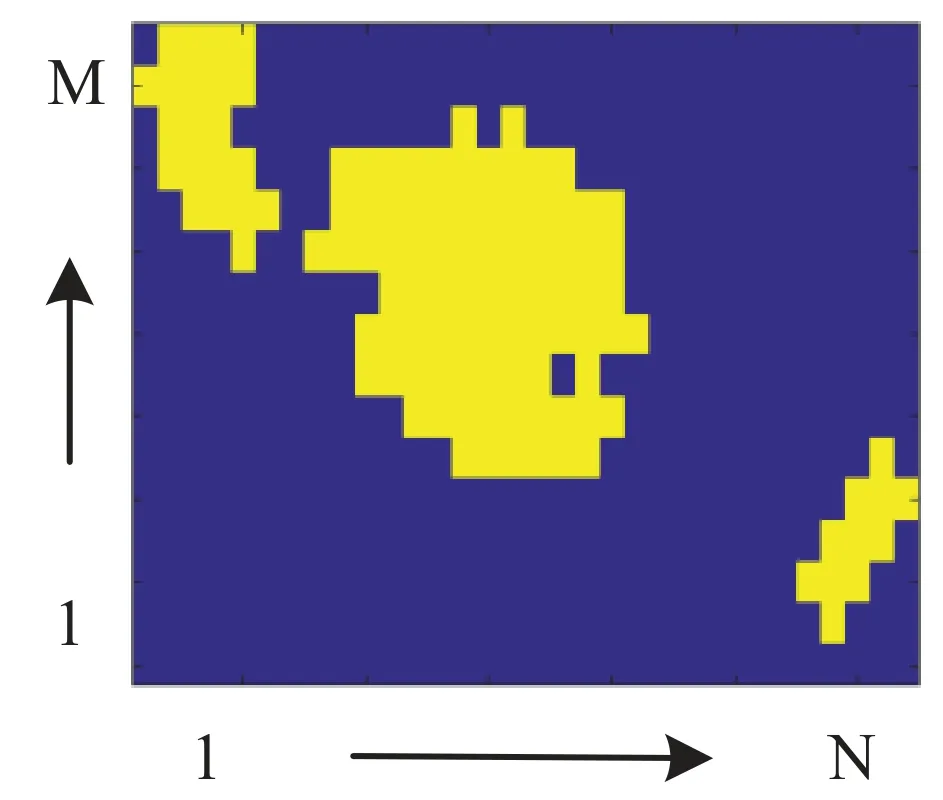
Figure 3.Draw the statistical CSI matrix as an image.
3.2 YOLO-based User Group Detection
Since the users have been drawn as a statistical CSI image,we treat the user grouping problem as an object detection problem,where the user groups with arbitrary shape and size,i.e.,the yellow-clusters in Figure 3,are considered as the objects,and use the deep learning-enabled YOLO network to detect the user clusters.
The YOLO network is constructed by multiple DarkNet-53 [29],which is a residual module composed of convolutional neural networks.In the architecture of YOLO network,the object detection is regarded as a regression problem with a unified endto-end convolutional network to concurrently predict the bounding boxes of all objects and class probabilities for these boxes.To detect the target object,YOLO divides the input 416 × 416-size image into S × S grid cells and allocates F anchor boxes per grid cell for detection.Each grid cell is responsible for detecting the object whose center falls into it.This detection network has 24 convolutional layers followed by 2 fully connected layers.For each category of object,each grid cell predicts B bounding boxes and the corresponding confidence scores for these boxes.These scores tell how confident the network is that the box contains an object,and also how accurate it ponders the box is.Thus,the output of YOLO is a S × S × (B × D) predictions of bounding boxes,where D is the category number of objects to be detected,and each prediction contains Q predicted values to describe the position of the bounding box and the corresponding confidence score,the value of Q depends on the application scenario.From the predicted B bounding boxes of a certain grid cell for each category of object,the box with largest confidence score is selected out for further consideration.Therefore,a total number of S ×S ×D predictions are selected out.For these predictions,an ignore threshold ? is used to determine whether a certain prediction can be adopted or not.The predictions with the confidence score larger than the ignore threshold are selected as the final predictions.The network is then trained to minimize the weighted square error between the final selected prediction and the corresponding ground truth(the training label).In this way,YOLO provides a fast detection on the images,and is thus adopted in this paper for rapid user grouping.
Then,we take Figure 3 as an example to show how the YOLO network is applied to solve the considered user grouping problem in details.Note that the input of the YOLO network is a 416×416 image,we first need to scale the obtained statistical CSI image,such as Figure 3,to a 416×416 one.Figure 4 shows the modified statistical CSI image of Figure 3.The grid cells,as well as an example of predicted bounding box and the corresponding pre-defined ground truth,are also shown in Figure 4.In the scaled statistical CSI image,the left bottom vertex is regarded as the origin,i.e.,(0,0),and the x-axis and y-axis are from down to upside and left to right side,respectively.Then,the 416 × 416-size statistical CSI image is used as the input of the YOLO network and is divided into S×S grid cells for user group detection.In the example of Figure 4,the input image is divided into 3×3 grid cells for detection,which is illustrated by the red lines.Since the category of object to be detected is D = 1,i.e.,the user groups,the output of the YOLO network concludes S×S×B predictions of the corresponding bounding boxes.The green box in Figure 4 shows an example of one predicted bounding box,while the white box indicates the pre-defined ground truth of the bounding box,which gives the precise location of the object.Each output prediction is a set containing Q = 5 parameters to describe one of the bounding boxes,i.e.,
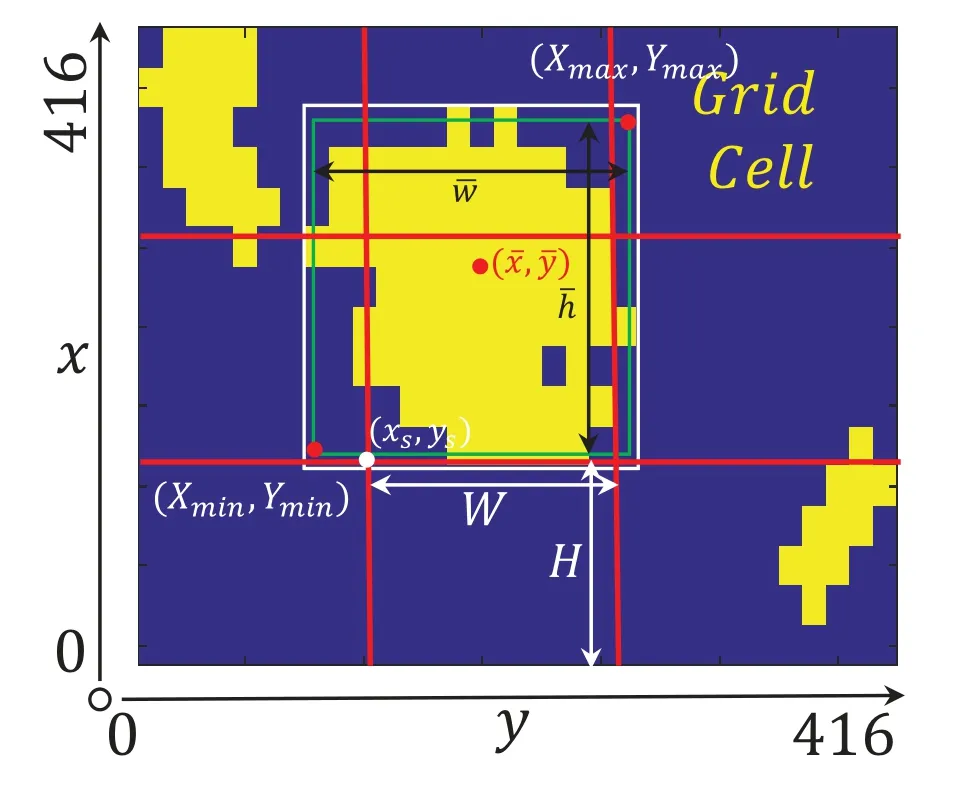
Figure 4.An example of the bounding box prediction and pre-defined ground truth of YOLO.The prediction and ground truth are represented by the green-and white-boxes,respectively.

where x,y ∈[0,1],and(x,y)represents the normalized coordinate of the predicted bounding box center of a certain user group,w and h represent the normalized width and height of the predicted bounding box,and 0 ≤σ ≤1 is the confidence score.The confidence score reflects the presence or absence of the user group.Larger score represents more confident the YOLO network is for the accuracy of the bounding box’s prediction.The relationship between the normalized coordinate(x,y)and the actual predicted coordinate of the bounding box center(ˉx,ˉy)is

wherexsandysare the actual coordinate of the left bottom vertex of the grid cell that the predicted bounding box center falls in,andHandWare the height and width of the grid cell.In this paper,H=W=416/S.Moreover,the values of predictionwandhare normalized,relative to the image size,i.e.,

From the obtainedS×S×Bbounding boxes,the box with the largest confidence score in each grid cell is selected out for further consideration.Since there areS×Sgrid cells in one statistical CSI image,there will remainS×Spredictions containing the detected objects for the whole image.Then,the ignore threshold?is used to determine whether a certain remaining prediction can be adopted or not.The predictions with confidence score larger than the ignore threshold,i.e.,

are considered to be credible enough to reflect the presence of a certain object.Thus,the predictions of the bounding boxes satisfying (21) are reserved,and those not satisfying(21)are ignored.These remaining bounding boxes are considered as the detection results of this image.Assuming that the final detection results containLbounding boxes,the number of user groups will beL.
Next,we partition the users into groups with these detected results.Since the value of the obtainedLdetections{x(l),y(l),w(l),h(l),σ(l)}Ll=1are normalized by (19) and (20),they can be transferred back to the actual value as,
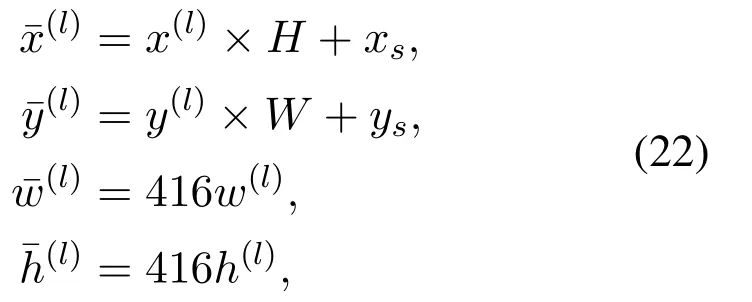
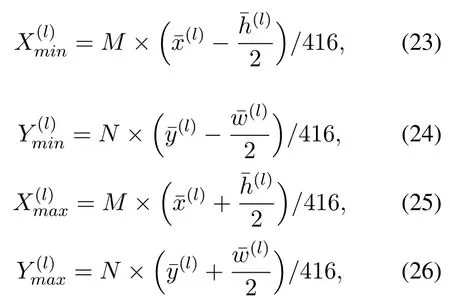

In this way,the proposed YOLO-based user grouping algorithm can rapidly partition users under the CUG model into different groups by drawing the statistical CSI into an image,from which the group information is derived.The steps of the proposed algorithm are given in detail in the following Algorithm 1.In this algorithm,we assume the well-trained YOLO network has been obtained and can be used for user group detection.The training of the YOLO network will be given in Section 3.3.
3.3 Training of the YOLO Network
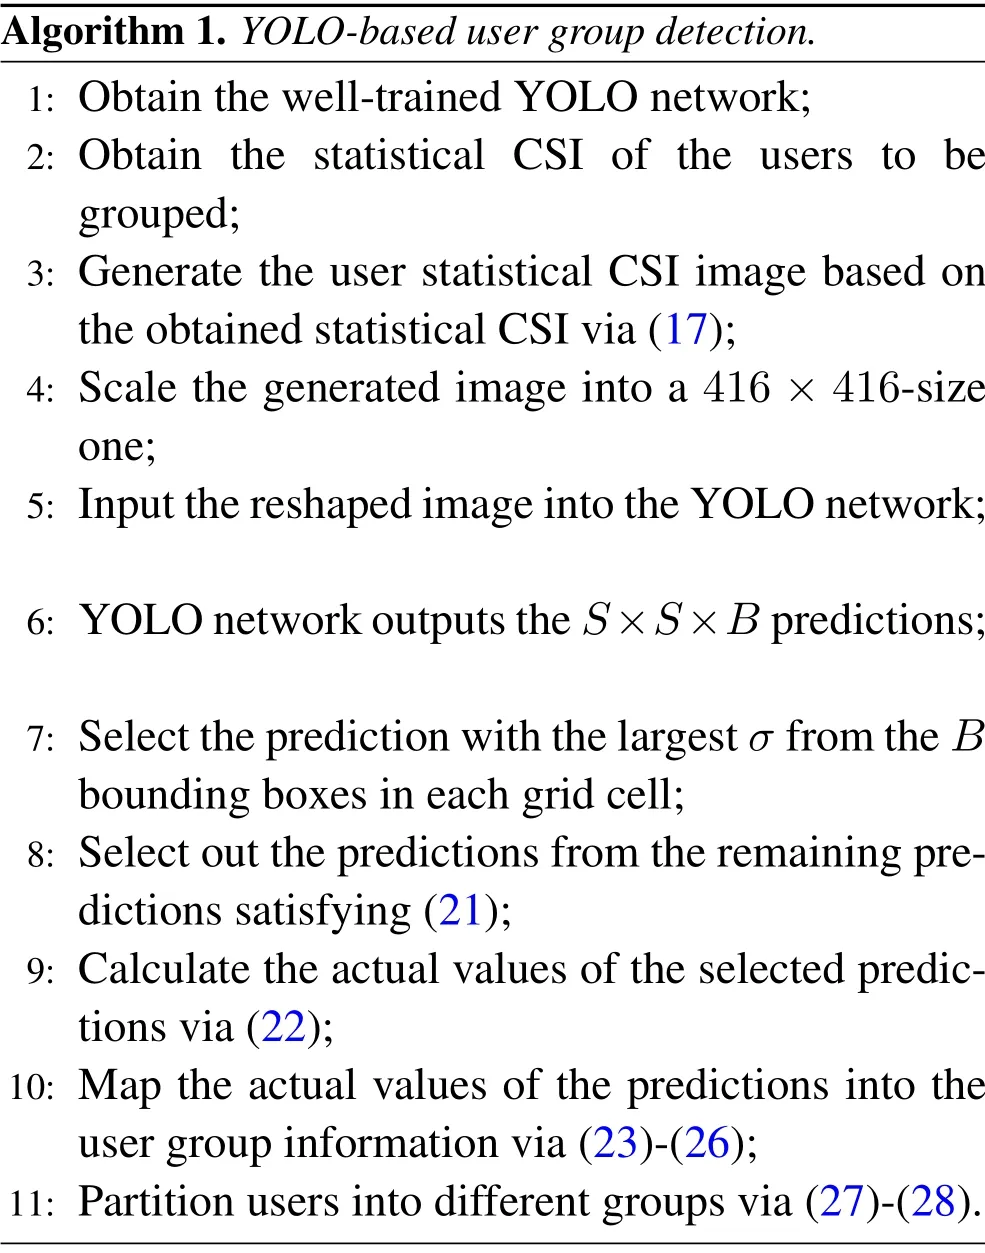
Algorithm 1.YOLO-based user group detection.1: Obtain the well-trained YOLO network;2: Obtain the statistical CSI of the users to be grouped;3: Generate the user statistical CSI image based on the obtained statistical CSI via(17);4: Scale the generated image into a 416×416-size one;5: Input the reshaped image into the YOLO network;6: YOLO network outputs the S×S×B predictions;7: Select the prediction with the largest σ from the B bounding boxes in each grid cell;8: Select out the predictions from the remaining predictions satisfying(21);9: Calculate the actual values of the selected predictions via(22);10: Map the actual values of the predictions into the user group information via(23)-(26);11: Partition users into different groups via(27)-(28).
To train the YOLO network,Juser statistical CSI images are first generated.Next,the generated images are reshaped into 416×416-size ones,and then be labeled.Assume that there areJj ≤Clabels for thej-th image,whereCis the number of user clusters.The value ofJjdepends on the degree of overlap between these clusters.For each image,Jjpredictions corresponding to theJjlabels will be selected from the output of the YOLO network as the final detected results.The pre-defined ground truth of the bounding box,as illustrated by the white box in Figure 4,gives the precise location of the object.It serves as the label and is also composed ofQ=5 parameters to describe the bounding box,i.e.,

Then,the output of the YOLO network is trained to match the labels.The loss function is defined as the weighted average of the weighted coordinate error,weighted width and height error,and the weighted class confidence error between the prediction{x,y,w,h,σ}and the labelThe network can be updated by stochastic gradient descent(SGD)to minimize the loss function.
IV.SIMULATIONS
In this section,we present the simulation results to validate the performance of the proposed YOLO-based user grouping algorithm.Under the considered singlecell multi-user FD-MIMO downlink system,we setM= 16,N= 32,C ∈{2,4,6,8},Cc ∈[5,8],c=1,...,C,σ2gk=σ2,the cell radiusR= 1500m,d=λ/2,whereλis the carrier wavelength.The signal-to-noise ratio (SNR) is defined asρ/σ2.For the CUG model,suppose the horizontal and the vertical angles of each cluster’s center relative to the BS are both uniformly distributed in[?60?,60?],the distance between the center of each cluster and the BS is uniformly distributed in[200m,1400m],the radius of each cluster is uniformly distributed in[0,200m],and the horizontal and vertical angle spreads of each user are both uniformly distributed in (0?,5?].The largescale fading coefficient of thek-th userwheredkdenotes the distance between thek-th user and the BS,and the factorγ= 3.76,as the settings in [9,21].For the user grouping problem,assumingλth=0.1,we generateJ=200 user location images and corresponding labels,including 50 pictures for each user cluster numberCamong{2,4,6,8}.Then,80% of the generated dataset are used as the training data,and the resting 20% as the validation data.We set the grid sizeS= 7,the number of anchorF= 9,and each grid predictsB= 2 bounding boxes.The proposed YOLO-based user grouping algorithm and all the benchmarks are implemented on the following configurations: deep learning platform PyTroch 1.3.1,one graphic for NVIDIA Tesla V100 32GB.For the training of the model,the number of training epoch is 200,the learning rate is 0.001 and decays fourfold every 50 epoches,the sample batch size is 16,the ignore threshold?= 0.6.The Adam optimizer[30]is utilized to fine-tune the parameter of the YOLO network.Finally,the parameter set that achieves the minimum loss on the validation dataset is selected.
Figure 5 and Figure 6 show the user grouping examples before and after the YOLO detection with different user cluster numberC.Figure 5 gives two examples forC= 4,and Figure 6 gives two examples forC= 6.Figure 5a,5c,6a,and 6c are the original statistical CSI images,and Figure 5b,5d,6b,and 6d are the corresponding outputs of the YOLO network with the original images as inputs,respectively.The groups on the post-detection images are marked with different color-boxes and corresponding confidence scores.As Figure 5b,5d,6b and 6d shown,the well-trained YOLO network can partition the user clusters into appropriate user groups,which verifies that the proposed YOLO-based algorithm can effectively conduct user grouping for the FD-MIMO system.
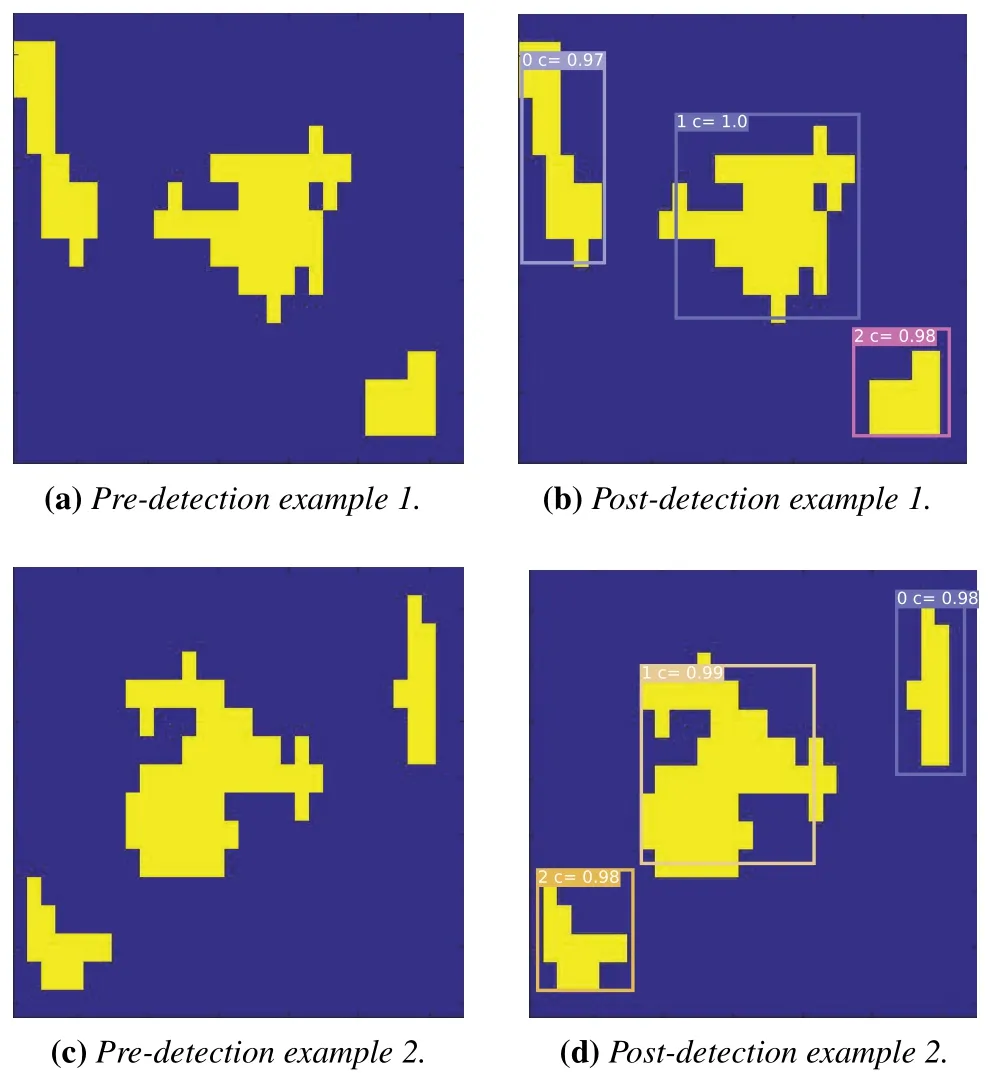
Figure 5.Pre-and post-YOLO detection images when C =4,M =16,N =32.
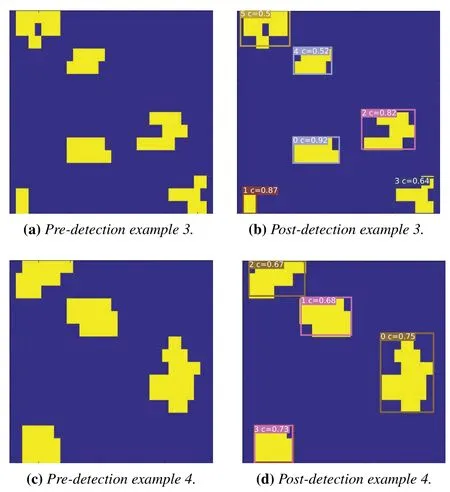
Figure 6.Pre-and post-YOLO detection images when C =6,M =16,N =32.
Afterwards,the sum-rate performance of JSDM under different user grouping methods are compared and shown in Figure 7-Figure 9.The benchmarks include the K-means clustering in[6]and the geometric block method in[9],referred to as“K-means”and“Geometric block”,respectively.The random user grouping is provided as the lower bound,referred to as“Random”.For the two-layer precoding JSDM scheme,the outer precoder Bgbased on the statistic CSI is given as

where (FN)PH,gand (F?M)PV,gare the sub-matrixes of FNand F?M,whose column index setsPH,gandPV,gconsist of the largest diagonal element indexes of ΛH,gkand ΛV,gkof all userkin groupg,respectively.The inner precoder vgkbased on the reduceddimensional equivalent CSI is obtained through unitnorm zero-forcing (ZF) among the users in groupg,and vgkcan be expressed as

where zgkis thek-th column of

In Figure 7 and Figure 8,the users are generated using the similar method as the generation of the training data set withC= 4 and 6,respectively.The results are averaged over 200 user drops.We obtain that the proposed YOLO-based user grouping algorithm partitions all the users into 3.44 groups on average for the case ofC=4,while it partitions all the users into 5.72 groups on average for the case ofC= 6.Note that for the benchmark algorithms,i.e.,the K-means based and the Geometric block based method,the number of partitioned user groupsGshould be chosen in advance to perform user grouping.Therefore,for the sake of fairness,we compare the performance of the benchmark algorithms withG= 3 and 4 in Figure 7,and compare the performance of the benchmark algorithms withG=5 and 6 in Figure 8.
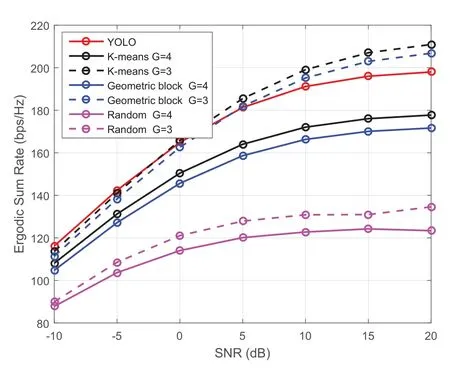
Figure 7.Ergodic sum rate comparison of different user grouping algorithms under C =4.
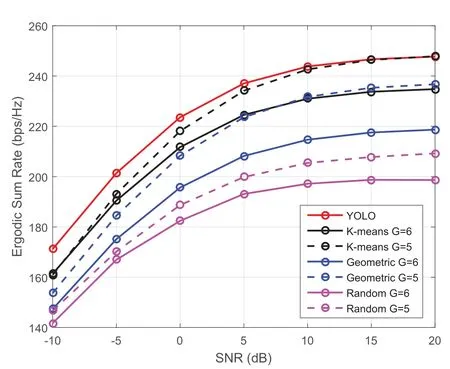
Figure 8.Ergodic sum rate comparison of different user grouping algorithms under C =6.
From Figure 7,it can be seen that,the proposed YOLO-based algorithm outperforms the benchmark algorithms withG= 4.The proposed algorithm is only slightly inferior to the K-means based and Geometric block based algorithms withG= 3 in high SNR region.This is because the average number of user groups for the YOLO-based algorithm is larger than these benchmark algorithms.With more user groups,the proposed YOLO-based algorithm would produce stronger inter-user interference,since there might still remains interference between users in different groups.However,with more user groups,the amount of effective CSI to be fed back decreases,which will be shown later.From Figure 8,it can be seen that,with the average number of user groupsG= 5.72,the YOLO-based algorithm outperforms the benchmarks with bothG= 5 and 6.Moreover,different from these benchmarks that need the number of groups to be determined in advance,the proposed YOLO-based algorithm can automatically adapt to the user distribution,and decide the number of user groups by itself.
Note that different user grouping algorithms and different number of user groups will lead to different amount of CSI feedback overhead.For each user in groupg,its effective channel vector after the outer precoding,i.e.,hTgkBg,containsNgelements.To perform the followed ZF inner precoding,theseNgelements are required to be fed back to the BS.Therefore,we can obtain that the average number of elements needed to be fed back per user for a certain user grouping algorithm is

Then,under the conditions of Figure 7 and Figure 8,we compare this average numbers of feedback elements per user for different user grouping algorithms in Figure 9 and Figure 10,respectively.
From Figure 9 and Figure 10,it can be seen that the proposed algorithm requires the least CSI feedback amount for both cases,while the required amount of feedback for the benchmark algorithms increases as the number of user groups decreases.From Figure 7 and Figure 9,it can be seen that the ergodic sum-rate performance of the proposed algorithm is only slightly inferior to the K-means based and Geometric block based algorithms withG= 3 in high SNR region.However,under this case,the required feedback amount of the K-means based and Geometric block based algorithms is much larger than the required feedback amount of the proposed YOLO-based algorithm.These results indicate that,for the benchmark algorithms with the number of groups that have comparable performance with the YOLO-based algorithm,the YOLO-based algorithm requires much less CSI feedback overhead,and thus is more efficient.
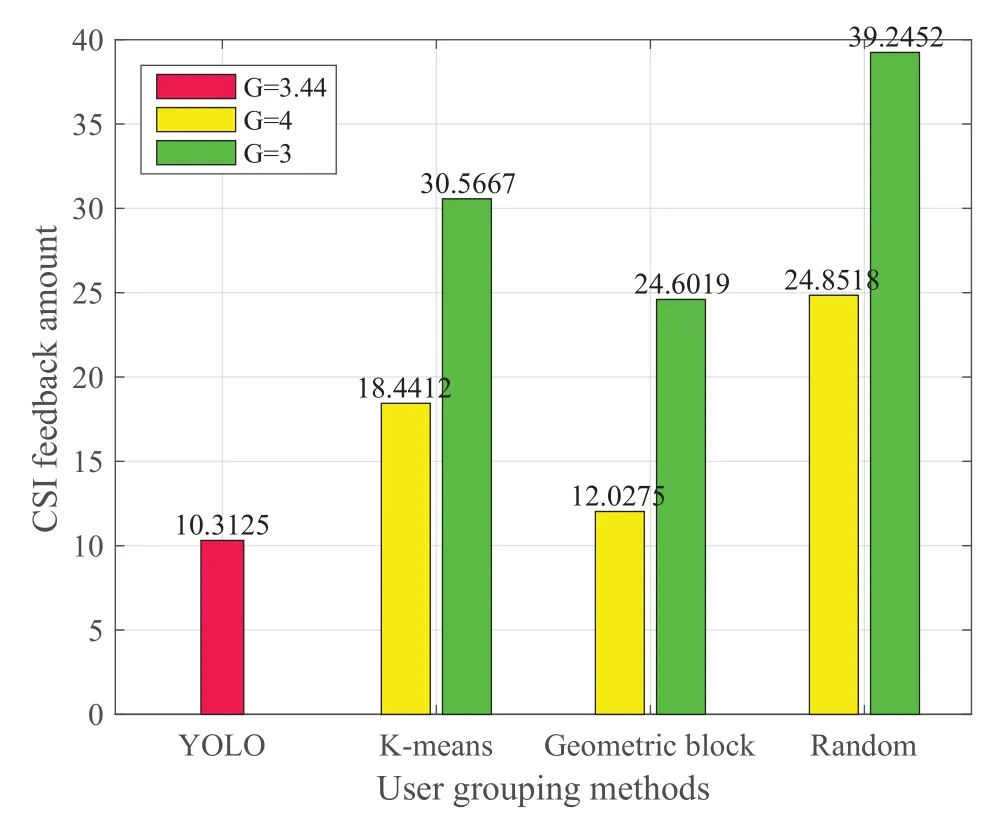
Figure 9.Averaged CSI feedback amount comparison of different user grouping algorithms under C =4.
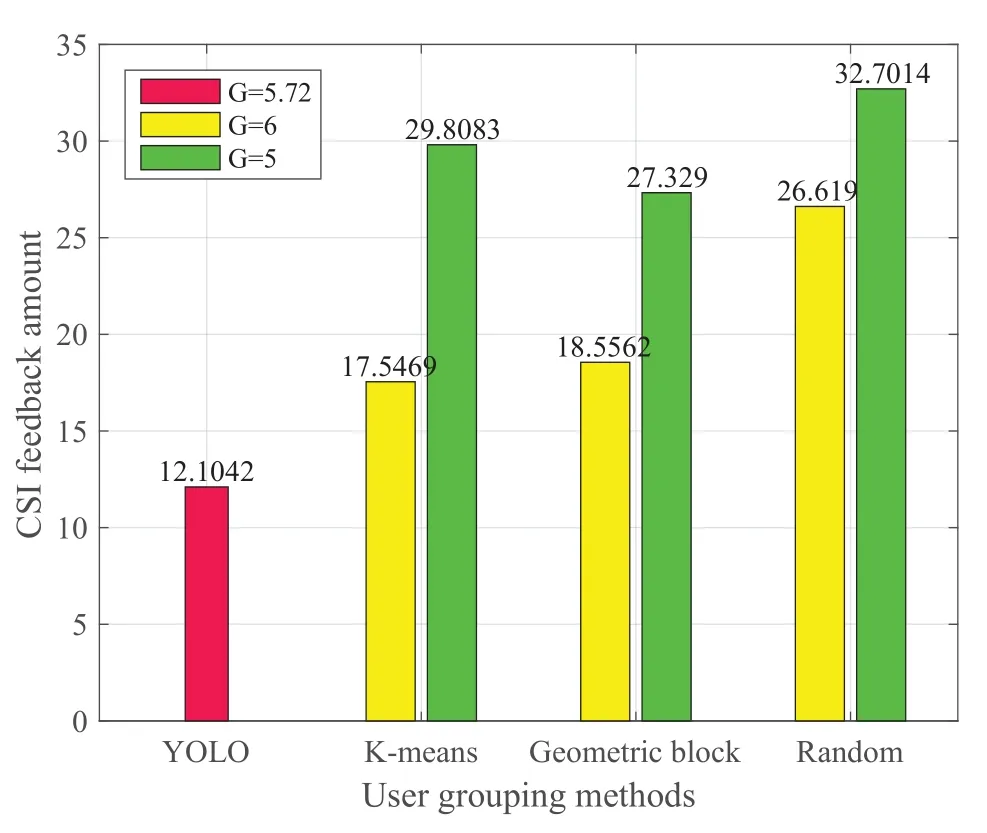
Figure 10.Averaged CSI feedback amount comparison of different user grouping algorithms under C =6.
To further verify the generalization of the proposed YOLO-based user grouping algorithm,we generate several statistical CSI images withC= 3,which is not included in the training dataset.Figure 11 gives two examples forC= 3,where Figure 11a and 11c are the original statistic CSI images,and Figure 11b,and 11d are the corresponding outputs of the YOLO network with the original images as inputs,respectively.Then,we use the same well-trained YOLO network as in Figure 7- Figure 8 to do the user group detection on these images.The corresponding ergodic sum-rate is shown in Figure 12,and the corresponding CSI feedback amount comparison of the proposed YOLO-based user grouping algorithm with the benchmarks is shown in Figure 13.From Figure 11,it can be seen that the YOLO network trained using the dataset withC={2,4,6,8}can work well on the user distribution withC= 3.We obtain that the proposed YOLO-based user grouping algorithm partitions all the users into 2.85 groups on average.Thus,we compare the performance of the benchmarks withG= 2 and 3 in Figure 12 and Figure 13.From Figure 12,it can be seen that the proposed YOLO-based algorithm can achieve almost the best ergodic sum-rate performance compared with the benchmarks,with the only exception that the performance of the proposed algorithm is slightly inferior to the performance of the Kmeans based method withG= 2.However,as analyzed before and shown in Figure 13,the amount of required CSI feedback for the proposed YOLO-based algorithm is much less than the K-means based algorithm withG=2.The results in Figure 12 and Figure 13 are consistent with the corresponding results in Figure 7-Figure 10.Therefore,the results in Figure 11-Figure 13 indicate that the proposed user grouping algorithm can be well transferred to other scenario with different user distributions.
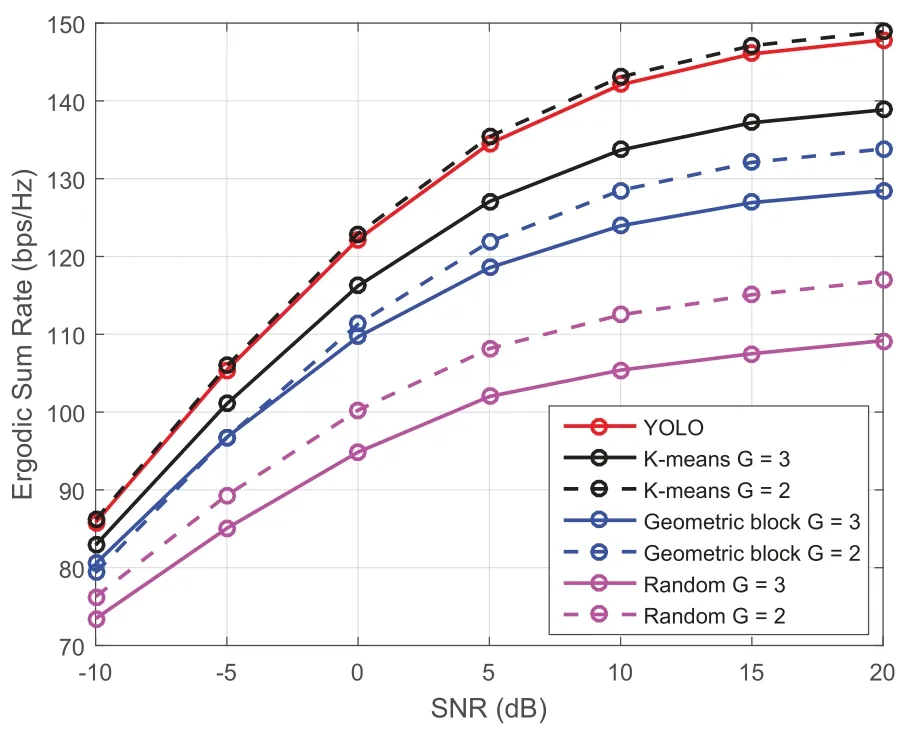
Figure 12.Ergodic sum rate comparison of different user grouping algorithms under C =3.
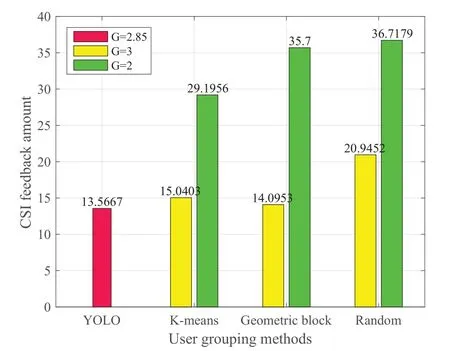
Figure 13.Averaged CSI feedback amount comparison of different user grouping algorithms under C =3.
Table 1 shows the time consumption of different user grouping algorithms,i.e.,the YOLO-based,the K-means-based,and the Geometric block-based approaches.It can be seen that the YOLO-based user groping algorithm requires the least time consumption compared with the other two methods.Moreover,as the number of user clusters grows,the time consumption of the proposed YOLO-based algorithm is nearly the same,while the time consumption of the Kmeans-based and the Geometric block-based methods increases greatly.Thus,the proposed YOLO-based user grouping algorithm is more efficient and practical than the benchmarks.
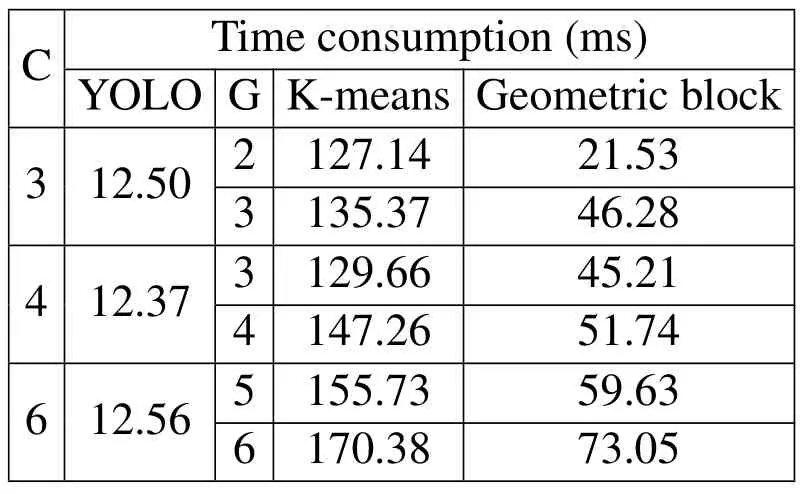
Table 1.Time consumption comparison.
V.CONCLUSION
In this paper,we proposed a new user grouping algorithm based on the object detection method YOLO network for the JSDM scheme under CUG model.The proposed algorithm constructs a statistical CSI matrix to describe the clustered users,and illustrates the matrix as an image for user grouping.Regarding the user groups as objects,a YOLO network is trained and utilized to rapidly detect the clustered users as different groups,which can thus reduces the time consumption while achieves better sum-rate performance.Simulations indicate that the YOLO network can detect all the user groups rapidly and adaptively,and the proposed YOLO-based user grouping algorithm can achieve higher throughput with less feedback.
ACKNOWLEDGEMENT
This work was supported in part by the National Key Research and Development Program of China under Grant 2017YFE0121500,and in part by the National Natural Science Foundation of China under Grants 61971126 and 61831013.
- China Communications的其它文章
- Joint Topology Construction and Power Adjustment for UAV Networks: A Deep Reinforcement Learning Based Approach
- Energy Model for UAV Communications: Experimental Validation and Model Generalization
- Joint Computing and Communication Resource Allocation for Satellite Communication Networks with Edge Computing
- An Intelligent Scheme for Slot Reservation in Vehicular Ad Hoc Networks
- CLORKE-SFS:Certificateless One-Round Key Exchange Protocol with Strong Forward Security in Limited Communication Scenarios
- Information-Defined Networks: A Communication Network Approach for Network Studies

