
Magnesium acetyltaurate prevents retinal damage and visual impairment in rats through suppression of NMDA-induced upregulation of NF-κB, p53 and AP-1(c-Jun/c-Fos)
2021-03-29 02:23:54LidawaniLambukIgorIezhitsaRenuAgarwalPuneetAgarwalAnnaPeresypkinaAnnaPobedaNafeezaMohdIsmail
中國(guó)神經(jīng)再生研究(英文版) 2021年11期
Lidawani Lambuk, Igor Iezhitsa , Renu Agarwal Puneet AgarwalAnna Peresypkina, Anna Pobeda, Nafeeza Mohd Ismail
Abstract Magnesium acetyltaurate (MgAT) has been shown to have a protective effect against N-methyl-D-aspartate (NMDA)-induced retinal cell apoptosis. The current study investigated the involvement of nuclear factor kappa-B (NF-κB), p53 and AP-1 family members (c-Jun/c-Fos)in neuroprotection by MgAT against NMDA-induced retinal damage. In this study, Sprague-Dawley rats were randomized to undergo intravitreal injection of vehicle, NMDA or MgAT as pre-treatment to NMDA. Seven days after injections, retinal ganglion cells survival was detected using retrograde labelling with fluorogold and BRN3A immunostaining. Functional outcome of retinal damage was assessed using electroretinography, and the mechanisms underlying antiapoptotic effect of MgAT were investigated through assessment of retinal gene expression of NF-κB, p53 and AP-1 family members (c-Jun/c-Fos) using reverse transcription-polymerase chain reaction. Retinal phospho-NFκB, phospho-p53 and AP-1 levels were evaluated using western blot assay. Rat visual functions were evaluated using visual object recognition tests. Both retrograde labelling and BRN3A immunostaining revealed a significant increase in the number of retinal ganglion cells in rats receiving intravitreal injection of MgAT compared with the rats receiving intravitreal injection of NMDA. Electroretinography indicated that pre-treatment with MgAT partially preserved the functional activity of NMDA-exposed retinas. MgAT abolished NMDA-induced increase of retinal phospho-NF-κB, phospho-p53 and AP-1 expression and suppressed NMDA-induced transcriptional activity of NF-κB, p53 and AP-1 family members (c-Jun/c-Fos). Visual object recognition tests showed that MgAT reduced difficulties in recognizing the visual cues (i.e.objects with different shapes) after NMDA exposure, suggesting that visual functions of rats were relatively preserved by pre-treatment with MgAT. In conclusion, pre-treatment with MgAT prevents NMDA induced retinal injury by inhibiting NMDA-induced neuronal apoptosis via downregulation of transcriptional activity of NF-κB, p53 and AP-1-mediated c-Jun/c-Fos. The experiments were approved by the Animal Ethics Committee of Universiti Teknologi MARA (UiTM), Malaysia, UiTM CARE No 118/2015 on December 4, 2015 and UiTM CARE No 220/7/2017 on December 8, 2017 and Ethics Committee of Belgorod State National Research University, Russia, No 02/20 on January 10, 2020.
Key Words: AP-1 (c-Jun/c-Fos); electroretinography; magnesium acetyltaurate; neuroprotection; NF-κB; N-methyl-D-aspartate; object recognition tasks; p53; retinal excitotoxicity; retrograde labelling
Introduction
Globally, although the leading cause of blindness is in fact cataract, glaucoma remains the leading cause of irreversible blindness. It is characterized by progressive loss of retinal ganglion cells (RGCs) and their axons leading to measurable structural and functional damage to the optic nerve, visual impairment, and blindness (Qu et al., 2012). In 2013, it was estimated that 64.3 million people are affected by glaucoma.It is expected that by 2020, this number would be closer to 76 million, and would reach 111.8 million by 2040 (Tham et al.,2014).
Most recent therapies are focused on lowering intraocular pressure (IOP) as it is considered the primary risk factor for the onset and progression of glaucomatous optic neuropathy(Song et al., 2015). However, recent evidence seems to suggest that glaucoma progression is not halted in all patients even after the lowering of IOP because numerous risk factors are involved in RGC apoptosis and elevated IOP is only one of them (Sihota et al., 2018).
Glutamate is an important excitatory neurotransmitter in the retina. However, its excessive levels are known to cause excitotoxicity, which has been reported to be a key mechanism contributing to RGC death in glaucoma (Manabe and Lipton,2003). Glutamatergic excitotoxic insult via stimulation of N-methyl-D-aspartate (NMDA) receptors results in intracellular accumulation of Na+and Ca2+ions leading to apoptosis of RGCs(Opere et al., 2018). In excitotoxicity, intracellular Ca2+rise is induced by glutamate. Thereafter, various intracellular events can be observed. Among them are upregulation of neuronal NOS (nNOS), dysfunction of mitochondria and reactive oxygen species (ROS) production (Kritis et al., 2015). While it has been proposed that multiple pathways contribute to apoptotic RGC death after excitotoxicity, there is evidence of involvement of endoplasmic reticulum (ER) stress in addition to lysosomal enzymes release (Ebneter et al., 2011). Additionally, tumor necrosis factor (TNF) signaling and c-Jun N-terminal kinase (JNK)activation have also been suggested to be involved. Irrespective of the initiating injury and the pathways involved, the caspase cascade is activated, expression of proapoptotic genes such as Bax/Bid increases, and that of antiapoptotic genes, such as Bcl-2/Bcl-xl, downregulates. All of these result in non-inflammatory programmed cell death (McIlwain et al., 2013). A number of transcription factors such as nuclear factor kappa B (NF-κB), p53 and AP-1 upregulate, thereby mediating the increase in Bax/Bcl-2 ratio, caspase-3 activation and RGC apoptosis (Li et al., 2002;Bessero et al., 2010; Dvoriantchikova and Ivanov, 2014).
Magnesium (Mg) and taurine (2-aminoethanesulfonic acid)have been studied as the antagonist of NMDA-receptors and might be considered as a therapeutic instrument in the prevention of RGC degeneration (Ekici et al., 2014; Iezhitsa and Agarwal, 2021). NMDA receptor-mediated component of synaptic transmission is blocked by Mg ions.In vivoandin vitroexperiments (Gromova et al., 2011; Singh et al., 2012) have established that systemically administered Mg antagonizes the neurotoxic effects of NMDA. Another potential agent that can provide neuroprotective effects is taurine, a known antioxidant and the predominant free amino acid in the retina (Macaione et al., 1974). In addition to its role as a neurotransmitter, it also maintains membrane structural integrity, regulates calcium binding and transport (Lambert et al., 2015), and inhibits neuronal and retinal excitotoxic insult(Froger et al., 2014; Jafri et al., 2018; Lambuk et al., 2019).
Magnesium acetyltaurate (MgAT), a combined salt of Mg and taurine, has been shown to have a protective effect against NMDA- and endothelin-1 (ET-1) induced retinal damage(Iezhitsa and Agarwal, 2018). Intravitreal administration of MgAT (320 nmol) has been shown to prevent retinal and optic nerve damage induced by NMDA (160 nmol) and ET-1 (2.5 nmol) (Arfuzir et al., 2016; Lambuk et al., 2017). Apoptotic response to NMDA and ET-1 can be attenuated by MgAT,resulting in fewer apoptotic cells (Arfuzir et al., 2016; Lambuk et al., 2017). Rats treated with MgAT demonstrated significant reduction in NMDA- and ET-1-induced oxidative and nitrosative stress (Arfuzir et al., 2016; Jafri et al., 2017; Lambuk et al.,2017; Nor Arfuzir et al., 2018). MgAT has also been shown to upregulate BDNF level (Lambuk et al., 2017) and abolish NMDA-induced increase in retinal Ca/Mg and Na/K ratios(Jafri et al., 2017). We have shown earlier that MgAT is more efficacious as a pre-treatment than as co- or post-treatment in protecting against NMDA- and ET-1-induced retinal and optic nerve damage (Arfuzir et al.., 2016; Jafri et al., 2017;Lambuk et al., 2017; Nor Arfuzir et al., 2018). Recently, we showed that it protects against ET-1 induced increase in the retinal expression of interleukin 1β (IL-1β), interleukin 6 (IL-6)and tumor necrosis factor-α (TNF-α) proteins and genes and activation of NF-κB and c-Jun (Nor Arfuzir et al., 2020).
However, involvement of various transcription factors in the antipoptotic effects of MgAT remains unknown. In our previous study, the inhibition of apoptosis by MgAT was accompanied by restoration of the Bax/Bcl-2 ratios and downregulation of caspase-3 in rat retinas (Lambuk et al., 2017). The current study was done to investigate if MgAT provides an antiapoptotic effect against NMDA-induced excitotoxicity through modulation of retinal gene expression of NF-κB, p53 and AP-1 family members (c-Jun/c-Fos) and suppression of retinal phospho-NF-κB, phospho-p53 and AP-1 levels, and confirm that the antiapoptotic effect of MgAT could be associated with inhibition of NMDA-induced activation of transcription factors such as nuclear factor kappa B (NF-κB), p53 and AP-1.
Materials and Methods
Animals
Male Sprague-Dawley rats were obtained from the Laboratory Animal Care Unit of Universiti Teknologi MARA. Eight to twelve week-old rats, weighing 200-250 g, were chosen for the study. The standard laboratory conditions (12-hour lightdark cycle and 23 ± 3°C temperature) were observed during the entire experiment. Unrestricted access to pellet food and water was provided. The animals were subjected to systemic and ophthalmic examination and were acclimatized to daily handling for 2 weeks. If animals were subjected to temporary stressful procedures, they received appropriate anesthetics(refer to study design). All procedures and animal handling were done in accordance with the ARVO (Association for Research in Vision and Ophthalmology, 2020) Statement for the Use of Animals in Ophthalmic and Vision Research and local animal ethics requirement of Universiti Teknologi MARA(UiTM), Malaysia, UiTM CARE No 118/2015 on December 4,2015 and UiTM CARE No 220/7/2017 on December 8, 2017 and Ethics Committee of Belgorod State National Research University, Russia, No 02/20 on January 10, 2020.
MgAT
MgAT was synthesised at the Laboratory for the Synthesis of Innovative Drugs of the Research Centre for Innovative Medicines (Volgograd State Medical University, Volgograd,Russian Federation) as described previously (Lambuk et al.,2017; Ozerov et al., 2017).
Study design
A total of 144 male rats were randomly divided into three groups of 48 rats each. Group 1 served as a negative control(PBS, vehicle), whereas group 2 served as a positive control(NMDA). Group 3 received pre-treatment with MgAT 24 hours before NMDA (24MgAT + NMDA). Administration of all tested compounds was done bilaterally through intravitreal injections as the rats were later subjected to visual function tests in Open Field Arena and Water Maze.Intraperitoneal injection of the mixture of ketamine (Ilium Ketamil, 100 mg/mL, #51188, Troy Laboratories, Glendenning,New South Wales, Australia) and xylazine (Xylazil-100,100 mg/mL, #3828, Troy Laboratories) (0.1 mL/100 g of body weight) was given to induce maximum sedation and immobility. Powdered NMDA (#M3262-1G, Sigma-Aldrich,St. Louis, MO, USA) and MgAT were dissolved in 0.1 M of phosphate buffered saline (PBS, #P5244, Sigma-Aldrich) at 160 and 320 nmol, respectively. Alcaine 0.5% (#NDC0998001615,proparacaine hydrochloride ophthalmic solution, Alcon Laboratories, Geneva, Switzerland) was topically applied before the procedure. A 30-gauge needle (#7803-07,Hamilton Company, Reno, NV, USA) mounted on a 10-μL Hamilton syringe (#7635-01, Hamilton Company) was used to administer the intravitreal injections. All intravitreal injections were done in a total volume of 2 μL (Figure 1).
The direction and location of the needle was monitored using the dissecting microscope. The sclera was punctured near the dorsal limbus using the needle, after which the solution was injected into the vitreous chamber. To ensure there was no pressure-induced retinal damage, this process was carried out slowly over 2 minutes. Animals were allowed to recover from anesthesia and gentamicin 0.3% (#NDC6131463305,gentamicin sulfate ophthalmic solution, Alcon Laboratories)was applied topically after the intravitreal injections to prevent bacterial infection. Retrograde labelling of RGCs was done in three rats from each group by intracranial injection of the fluorogold 24 hours after intravitreal administration using stereotaxis. Subsequently, the eyes were enucleated and animals were sacrificed after 7 days. The retinae were isolated and flat-mounted to determine the RGC count in each retina.Using a different set of animals, BRN3A immunostaining was done 7 days after treatment (three rats per group).
Electroretinography (ERG) was performed 7 days after treatment using eight different animals from each group(eight rats per group). Subsequently, animals were euthanized after 3, 6, 24 hours and 7 days of NMDA injection; eyes were enucleated and retinae were separated from the eyeballs for protein and gene expression detection. Tissue samples taken for western blot (NF-kB p65, phosphorylated NF-kB p65, p53,phosphorylated p53 and AP-1) (three rats/group/time point)and RT-PCR (NF-kB p65, p53, c-Jun and c-Fos) (three rats per group/time point) were immediately processed for protein and RNA extraction. For both parameters, retinae of two eyes from the same rat were pooled and considered as one sample.In each group, three biological and three technical replicates were used for western blot and RT-PCR.
Open field test and Morris water maze test (10 rats per group)were performed to assess visual function 7 and 14 days after treatment, respectively. For Morris water maze test, rats were trained on the 8thday after the beginning of the experiment and their visual function was assessed 7 days after training (on the 15thday after the beginning of experiments).
Fluorogold-labeled RGC count on retinal flatmounts
Fluorogold (FG) labels approximately 95% of RGCs. The fluorescence density resulting from exposure to FG lasts for at least 3 weeks. All animals were injected intraperitoneally with a mixture of ketamine (Ilium Ketamil, 100 mg/mL, #51188,Troy Laboratories) and xylazine (Xylazil-100, 100 mg/mL,#3828, Troy Laboratories) to induce (0.1 mL/100 g of body weight) maximum sedation and immobility. In this study,FG was injected directly to the superior colliculus (SC) area on day 2 post intravitreal injection. FG was injected directly to the SC area by using a stereotaxic apparatus (#51600,Stoelting Co, Wood Dale, IL, USA). To expose the skull, a 2 cm incision was made along the midline of the scalp, after cleaning with povidone-iodine (#Y0000466, Sigma-Aldrich).A high-speed micro dental drill (0.6 mm, #58610, Stoelting Co) was used to make holes on the skull at the location 7.5 mm behind the bregma, 2.0 mm on both sides from the midline, and up to a depth of 4.0-4.5 mm to reach the SC area (Schlamp et al., 2013). Two μl of 3% FG (#sc-358883,Santa Cruz Biotechnology, Dallas, TX, USA) diluted in sterile 0.1 M PBS was injected at a rate of 1 μL/min over 2 minutes on either side using a 10-μL Hamilton syringe (Schlamp et al., 2013). The skull holes were fully covered with dental cement (#10000786, Stoelting Co) and the exposed scalp was sutured. The eyes were maintained hydrated during the procedure by applying one drop of saline solution (0.9%sodium chloride, #S6546, Sigma-Aldrich). The rat was allowed to fully recover from the anesthesia and then was transferred back to the home cage. The animals were euthanized 6 days after FG injection. The enucleated eyes were immersed in 4%paraformaldehyde solution (#AAJ19943K2, Thermo Scientific,Waltham, MA, USA) at 4°C for 2 hours. The eyeballs were then washed in 1 M PBS at room temperature to remove the excess paraformaldehyde. The retina was dissected from the eyecup using a surgical microscope (#S100, OPMI Pico, Carl Zeiss,Goeschwitzer Strasse, Jena, Germany). The retinal flatmounts were prepared by giving four incisions from the periphery of the retina (Figure 2). To observe the FG-labelled RGCs, a fluorescence microscope was used with a 515 nm rhodamine fluorescence filter (#IX81, Olympus IX81 microscope, Olympus America, Center Valley, PA, USA). From each of the four retinal quadrants, the images were captured from three areas (central, mid and peripheral field of retina) with 400×magnification (Figure 2D). For counting the FG-labelled RGCs,the image analysis software, ImageJ version 1.53g (National Institutes of Health, Bethesda, MA, USA) was used. The RGC counting was performed by three blinded investigators in 12 images representing 12 areas, three in each quadrant of each retina. The counts of FG-labelled RGCs in each image were then converted into RGC density per square millimetre (cells/mm2). The RGC densities of all 12 images were averaged for each retina as described earlier and the average values for all six retinae per group were used for statistical analysis (Schlamp et al., 2013; Nor Arfuzir et al., 2020).

Figure 1 |Flow chart of study design.
BRN3A immunohistochemistry and quantification of BRN3A-positive cells in retinal tissue sections
The eyeballs were bisected at the equator and the lenses were removed. The posterior eyecups were processed through a series of graded alcohols and xylene (#3803686; #3803665,Leica Biosystems, Heidelberger Strasse, Nussloch, Germany)and embedded in paraffin (#39601006, Leica Biosystems).The tissue sections of 3 μm thickness were obtained and mounted onto polysine histology slides (#PO425-72EA, Sigma-Aldrich). PBS 0.5% Triton (#X100, Sigma-Aldrich) was used to fix the sections for 15 minutes at -70°C. This was followed by a rinse in PBS 0.5% Triton, and overnight incubation at 4°C with rabbit-anti BRN3A antibody (#sc-8429, Santa Cruz Biotechnology) diluted with 1:100 in blocking buffer (PBS, 2%bovine serum albumin, 2% Triton, #01863-64, Nacalai Tesque,Nakagyo-ku, Kyoto, Japan). After washing with PBS, sections were incubated for 2 hours at room temperature with the secondary antibody (goat anti-rabbit HRP, #sc-2030, Santa Cruz Biotechnology) diluted to 1:500 in blocking buffer. The slides were again washed vigorously in PBS, and subsequently mounted, with vitreous side up. Observations were made under light compound microscope (Leica DM1000, Leica Microsystems, Ernst-Leitz-Strasse, Wetzlar, Germany) with 20× objective magnifications. The BRN3A-positive signals were counted in each ganglion cell layer using image analysis software, ImageJ version 1.53 g (National Institutes of Health,Bethesda, MA, USA) by two investigators in masked fashion.The number of BRN3A-positive signals per 100 μm2area of GCL in three randomly selected fields of view from each section was counted. The average numeric values of the three random fields of view from each retina were taken for further statistical analysis.
ERG
ERG was performed 7 days after treatment. The rats were first adapted by keeping them for 30 minutes in the dark.Subsequently, the animals were anesthetized and corneal silver electrode was placed on the cornea, the reference needle electrode (#EL452, Biopac System, Goleta, CA, USA)was placed subcutaneously in the region of the skull and ground needle electrode (#EL450, Biopac System) was placed subcutaneously at the base of the tail (Shabelnikova et al., 2016). A stroboscope TSD122B with a flash of white light connected to the stimulator (#STM200, Biopac System)was placed in front of the animal. Evoked biopotentials were amplified using ERS100C Evoked Response Amplifier(#ERS100C, Biopac System). An MP150 data acquisition and analysis system (#MP150, Biopac Systems) was used to represent them graphically. Each rat was subjected to only a single stimulation of 0.5 seconds to obtain the ERG recording.Changes in the amplitudes of the a- and b-waves of ERG were used to assess the functional state of the retina after pretreatment with MgAT and NMDA exposure. The readings from each group of eight animals were included into the protocol and used to calculate the mean.
Reverse transcription polymerase chain reaction
Total RNA from retinas was isolated using the GeneJET RNA purification kit (#K0731, Thermo Scientific) as described in the manufacturer’s protocol. Total RNA (100 ng/μL) in RNAsefree water (#10977035, Invitrogen, Carlsbad, CA, USA) was used for cDNA synthesis using Maxima First Strand cDNA Synthesis kit (#K1641, Thermo Scientific) for RT-qPCR. DNAand DNase-free RNA up to 1 μg was added to 5X Reaction Mix(contained reaction buffer, dNTPs, oligo [dT]18 and random hexamer primers), Maxima Enzyme Mix (contained Maxima Reverse Transcriptase and Thermo Scientific RibolockRNase Inhibitor), and nuclease-free water in a sterile RNAsefree microcentrifuge tube. The mixture was subjected to Eppendorf 6331 Nexus Gradient Mastercycler Thermal Cycler (#6331000017, Eppendorf). Reverse transcription polymerase chain reaction (RT-PCR) was then done using the Luminaris Color HiGreen qPCR master Mix kit (#K0391,Thermo Scientific). One μL of cDNA was used in 10 μL of master mix containing 5 μL of 2X Master Mix (Hot Start Taq DNA polymerase, uracil-DNA glycosylase, double-stranded DNA (dsDNA) binding dye and dTNPs mix), 0.3 μL of forward/reverse primer (1:9) (Macrogen, Gangnam-gu, Seoul, Republic of South Korea) (Table 1), and 3.4 μL of nuclease-free water.The mixture was subjected to DNA amplification using the Bio-Rad CFX96 Real Time PCR Detection system (#6093, Bio-Rad,Hercules, CA, USA).
Three independent biological replicates and three technical replicates were processed for each reference (beta-actin andGAPDH) and target genes (NF-κB p65, p53, c-Jun and c-Fos).Standard curves were developed using four-fold dilution series(1:9 to 1:6561) for each gene to calculate the PCR efficiencies ranging from 90% to 110%. The expression of target genes was presented as relative quantification after normalization to GAPDH and β-actin as the reference genes via ‘Double Delta CT’ method.

Table 1 |Primer sequence used for quantitative real-time polymerase chain reaction
Western blot analysis
All retinas (two retinas were pooled as one sample) were homogenized in radioimmunoprecipitation assay (RIPA)buffer (150 mM NaCl, 1.0% IGEPAL CA-630, 0.5% sodium deoxycholate, 0.1% sodium dodecyl sulfate (SDS), and 50 mM Tris, pH 8.0) (#89900, Life Technologies, Carlsbad,CA, USA) with protease inhibitor (#0088266, Thermo Scientific) and phosphatase inhibitor (#4906845001, Roche,Grenzacherstrasse, Basel, Switzerland). The ratio was 1 mg retina weight to 10 μL RIPA buffer. It was then centrifuged for 13 minutes at 11,000 ×gat 4°C. The supernatants were collected and total protein in retinal extracts was measured using a standard Protein Assay Bradford (#5000201,Bio-Rad) and nanodrop (#ND-1000, NanoDropTM1000 Spectrophotometer, Thermo Scientific). Retinal extracts were resuspended in 4× sample buffer (60 mM Tris-HCl pH 7.4,25% glycerol, 2% SDS, 14.4 mM 2-mercaptoethanol, 0.1%bromophenol blue) (#1610747, Bio-Rad) at a 4:1 ratio in 90°C for 5 minutes. It was resolved by 12% sodium dodecyl sulfate polyacrylamide gel electrophoresis (#161-0301, Bio-Rad) for 2.5 hours at 300 mA. Proteins were transferred onto a nitrocellulose membrane (0.45 μm, #1662807, Bio-Rad). To ensure equal protein loading and uniform transfer, the blots were immersed with Ponceau S staining (#P7170, Sigma-Aldrich) for 5 minutes to visualize the protein bands. Blots were washed in Tris-buffered saline containing Tween 20 and blocked for 1 hour with 5% blocking buffer in Tris-buffered saline containing Tween 20 buffer (20 mM Tris-HCl pH 7.6, 137 mM NaCl and 0.1% Tween 20) (#03953, Blocking One, Nacalai Tesque, Nakagyo-ku, Kyoto, Japan). Blots were then probed for overnight using 1:500-1:1000 dilutions of antibodies against β-actin (1:1000, mouse monoclonal beta-actin, #HC201-02,Transgen Biotech or #sc-47778, Santa Cruz Biotechnology),phospho-NF-κB p65 (1:500, mouse monoclonal anti-phospho-NF-κB p65, #sc-101752, Santa Cruz Biotechnology), NF-κB p65 (1:1000, mouse polyclonal anti-NF-κB p65, #PA1-30408,Thermo Scientific), phospho-p53 (1:500, mouse monoclonal anti-phospho-p53, #sc-135772, Santa Cruz Biotechnology),and p53 (1:1000, mouse monoclonal anti-p53, #sc-126, Santa Cruz Biotechnology) and AP-1 (1:500; rabbit polyclonal anti-AP-1, #ENT0244, Elabscience, Wuhan, Hubei Province, China).The blots were then probed with 1:5000-1:10,000 dilutions of horseradish-peroxidase (HRP)-conjugated goat anti-rabbit secondary antibody (#sc-2004, Santa Cruz Biotechnology)or rat anti-mouse secondary antibody (#sc-2750, Santa Cruz Biotechnology). An enhanced chemiluminescence system(WesternBright ECL HRP Chemiluminescent, #K-12045-D20,Advansta, San Jose, CA, USA) and X-ray film (CL-XPosure Film, #34090, Thermo Scientific) was used to detect bound antibodies. Signal intensity was measured using image analysis software, ImageJ version 1.53g (National Institutes of Health,Bethesda, MA, USA) and obtained from three separated blots.Mean values were presented as the ratio in densitometry protein/densitometry β-actin as “relative intensity”.
Assessment of exploratory and anxiety-related behavior of rats in the open field test
The open field test was utilized to assess the exploratory and locomotor activity of rats as a stress reaction associated with visual loss (Bailey and Crawley, 2009). The assessment was done according to the previous studies (Iezhitsa et al., 2011;Mohd Lazaldin et al., 2020). A polyvinyl chloride (PVC) square arena measuring 100 cm (length) × 70 cm (height) × 100 cm(width) was placed in a soundproof room. The apparatus was demarcated into “peripheral” (10,000 cm2each 100 cm(length) × 100 cm (width)) and “central” [2500 cm2each 50 cm (length) × 50 cm (width)] zones. A 100-W tungsten lamp illuminated the apparatus while a camera was installed above the central part. The 10 minute exploratory activity began when each rat was placed in the central square. Exploratory activities including total distance travelled, number of squares crossed, number of rearings (frequency with which the rat stood on its hind legs in the field), freezing periods, number of grooming episodes and number of faecal boli were recorded.Faecal boli and urine were removed and the open field arena was wet mopped with 75% ethanol to avoid transmission of olfactory cues. To ensure consistency of experience and avoid increased activity levels, the rats were taken to the testing room, 1 hour before the experiment. All behavioral responses were recorded and AnyMaze software (#60000, ANY-maze video tracking software, Stoelting Co) was used to analyze them. The exploratory and anxiety-related behavior in rats was assessed from day 8 to day 14 (7 days) after treatment.
Object recognition test using an open field arena
The object recognition test (ORT) was done to assess the neuroprotective effect of MgAT against NMDA-induced changes in visual behavior assuming that observed changes were due to visual loss rather than the amnesic effect of NMDA. The ORT using an open field arena was staged into three phases: familiarization, object displacement, and object replacement (Luparini et al., 2000; Leger et al., 2013; Mohd Lazaldin et al., 2020). Five different objects were located at specific distances to allow exploration by the rats. This test was on the premise that rats had an innate preference for novelty and they could recognize familiar objects. They would characteristically explore a novel (unfamiliar) object rather than a familiar one (Leger et al. 2013). Assuming that intravitreally-injected NMDA in rats did not cause partial or total loss of memory, the failure to distinguish novel objects and spending more time with familiar objects was solely due to visual loss secondary to retinal damage. For ORT, six objects were utilized; (1) glass cylindrical water bottle with rounded end (), (2) hexagon-shaped bottle (), (3) coneshaped bottle (), (4) cube-shaped bottle (), (5) jam jar (),and (1A) sphere jar (). The objects were placed in the same way as described by Mohd Lazaldin et al. (2020). Each rat was placed in the centre square of the open field arena, and left in the habituation stage for 10 minutes. Five different objects were then introduced into the arena. The first was a 5-minute familiarization stage. It comprised three trials of 5 minute each, giving the rats the opportunity for spatial memory development. There were two stages in this spatial test: displacement and replacement. In the displacement test, object number 4 () was removed from the original postion and placed in between objects number 1 () and 2() (non-displaced objects). Meanwhile, object number 5 ()was placed in the original postion of object number 4. The rats were allowed to explore with new locations of object 4() and 5 () (displaced objects) for 2 trials of 5 minute each.Lastly, in the replacement stage, object number 1 () was replaced with object number 1A () (replaced object). The rats were observed for 5 minutes, their exploratory activities were recorded, number of approach towards objects was counted and analysed using AnyMaze software. Prior to each session, faecal boli and urine were removed and the apparatus surfaces and objects were wet mopped with 75%ethanol (#3803686, Leica Biosystems) to avoid transmission of olfactory cues. The behavioral activity of rats in ORT using open field arena was observed on day 8 after treatment.
ORT using water maze
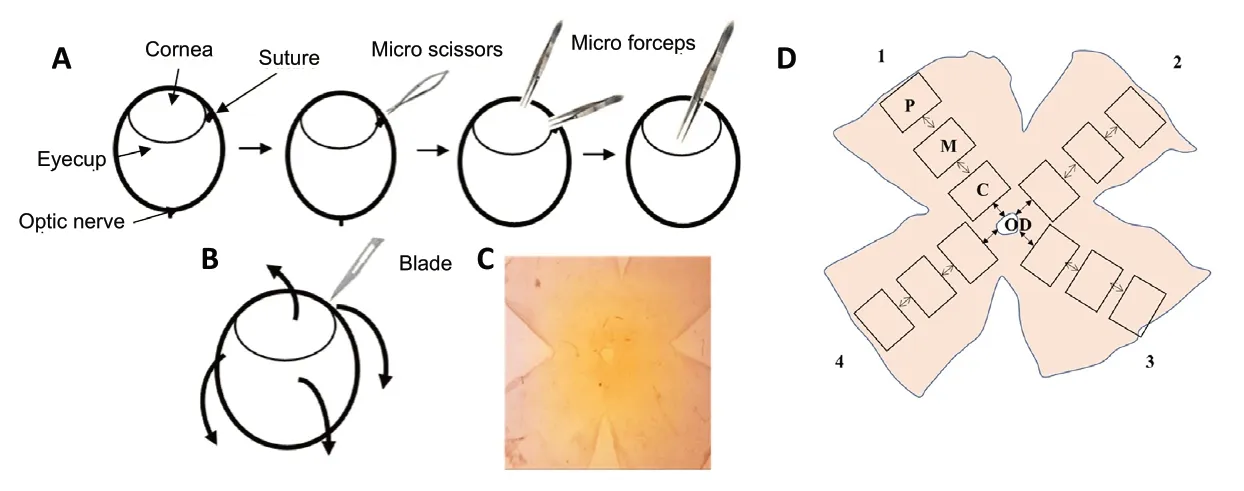
Figure 2 |Schematics describing the procedure of retinal flatmount preparation.

Figure 3 |Representative fluorescent micrograph of retinal flatmount after superior colliculus injection with fluorogold.
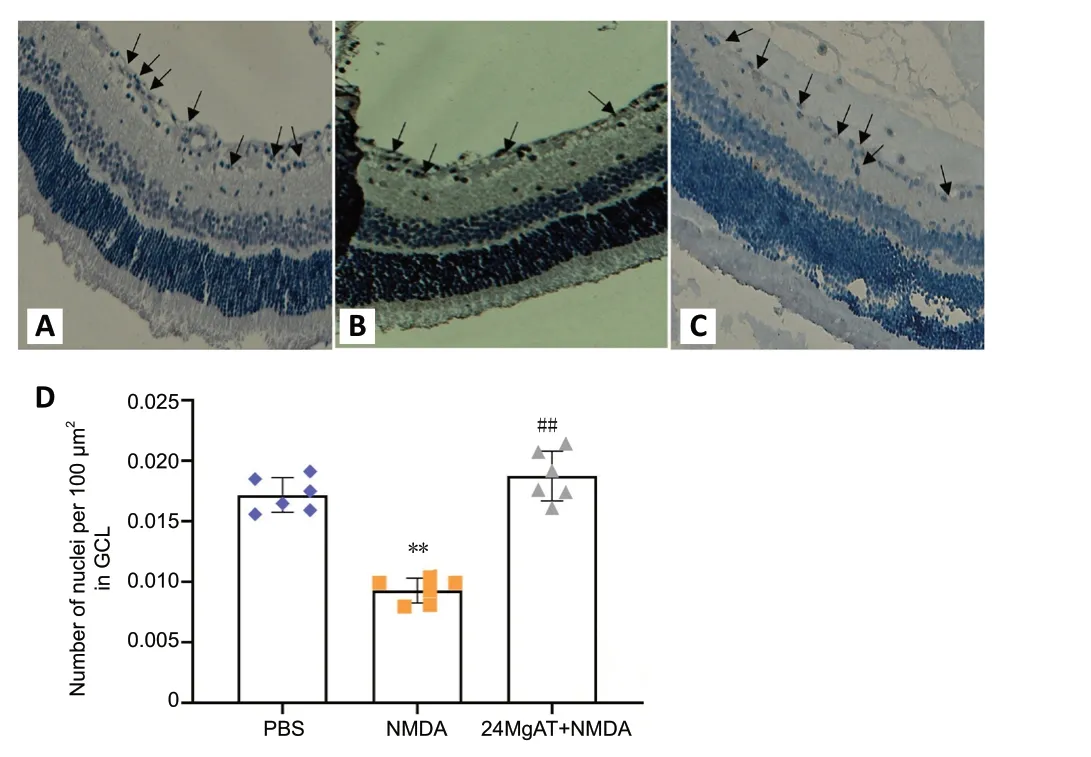
Figure 4 |Representative light micrographs of BRN3A immunostained retinal sections showing the effect of MgAT against NMDA-induced RGC loss.

Figure 5 |Effect of MgAT on NMDA-induced changes in a- and b- wave amplitudes (μV) in ERG.
Object recognition by rats can be assessed using a water maze. It is a popular paradigm for assessing the rats’ spatial cognition or the learning and memory (Morris, 1984; Vorhees and Williams, 2014). In the water maze, the rats were trained to navigate the submerged platform, which was hidden just below the water surface, with the help of distal visual cues surrounding the pool (Robinson et al., 2001). Morris test was used to assess visual impairment in rats after intravitreal NMDA injection and the possible neuroprotective effect of MgAT. The assumption was again that it was visual loss more than the central amnesic properties of NMDA that was responsible for any observed changes. The test was done using a previously described protocol (Morris 1984) with modifications (Vorhees and Williams, 2014; Mohd Lazaldin et al., 2020). The procedure was performed in a circular tank 150 cm in diameter, and 60 cm high. The acquisition phase involved daily training sessions. Each rat underwent two trials from day 8 to day 14 post-treatment. The platform was placed in the center of the selected quadrant and the object cue (triangular and circular objects) was paired at the chosen quadrant on the wall of the pool with elevation one inch from water surface. The objective of these sessions was to allow the rats to get familiarized with the environment. Subsequently,with the help of the object cue, they were expected to find the platform within 60 seconds and escape from the water. A visual recognition test (day 15 post-treatment) was conducted after 7 days of training. Tap water (21 ± 1°C) was poured into the tank, and white non-toxic paint was added to it, to render it opaque. The platform was hidden under the water and the animals had to navigate using the object cue (triangle shape)to reach the platform. The time they took to find the platform was recorded and analyzed with the AnyMaze software.
Statistical analysis
The sample size in the study was calculated based on the resource equation method, kept “E” between 10 and 20, and hence considered as adequate (Arifin and Zahiruddin, 2017).The sample size for visual function, western blot analysis and RT-PCR were considered adequate to test the respective biological effects. The sample size was also in accordance with recommendation of the animal ethics research committee(UiTM Care: 220/7/2017). Investigators blinded to the experimental groups collected the data. Data for FG-labelled RGC and BRN3A-IHC were expressed as the mean ± SD from six biological replicates. Data from electroretinogram were presented as the mean ± SD from eight biological replicates.Data for gene and protein expressions were expressed as the mean ± SD from three biological and three technical replicates. The results were first checked for normality using Shapiro-Wilk test. One-way analysis of variance was used to assess statistical significance, and SPSS 22.0 for Windows (IBM,Armonk, NY, USA) was used forpost hocBonferroni analysis for multiple comparisons, withP< 0.05 considered statistically significant. Data for visual function test were presented as the mean ± standard error of the mean from ten biological replicates. The results were first checked for normality using the Shapiro-Wilk test, while SPSS 22.0 for Windows analyzed the statistical significance using non-parametric (Kruskal-Wallis test) method.P< 0.05 was considered statistically significant.
Results
Effect of MgAT against NMDA-induced RGC loss
Fluorogold-labelled RGC count in retinal flatmounts
The number of FG-labelled RGCs signals was the lowest in NMDA exposed retinas, with a significantly lower RGC density by 10.5 folds (365.85 ± 216.91 cells/mm2,P< 0.01) when compared to PBS group (3832.21 ± 200.40 cells/mm2). Pretreatment with MgAT preserved the number of RGCs and in this group RGC density was significantly higher when compared to NMDA group (3663.46 ± 652.91 cells/mm2,P< 0.01). The RGC density was comparable between PBS and 24MgAT + NMDA groups with no significant differences (P= 1.00; Figure 3).
BRN3A immunoreactivity
After the intravitreal administration of NMDA, 1.85 fold lesser BRN3A-positive nuclei were observed in GCL compared with the PBS group (0.009 ± 0.001vs. 0.017 ± 0.001,P< 0.01). The 24MgAT + NMDA group (0.018 ± 0.002) showed 2-fold higher number of BRN3A-positive cells compared to the NMDA group(P< 0.01). However, the number of BRN3A-positive cells in both the PBS and 24MgAT + NMDA groups was comparable with no significant differences (P= 0.312; Figure 4).
Effect of MgAT against NMDA-induced changes in ERG
A representative of ERG of rat in the control group is shown in Figure 5B. After exposure to NMDA, the amplitudes of a-wave(52.50 ± 22.52,P< 0.01) and b-wave (70.00 ± 28.78,P< 0.01)were clearly lower than the same amplitudes in PBS-treated rats(P< 0.01) (Figure 5C). While the amplitude of a-wave and b-wave remained significantly lower compared with the PBS group (P=0.002 andP< 0.01, respectively) (Figure 5A and Table 2), pretreatment with MgAT caused significantly (Figure 5D) greater b-wave amplitude compared with the NMDA group and the difference amounted to 67.9% (117.50 ± 23.14,P= 0.016).

Table 2 |Effect of MgAT on NMDA-induced changes in a- and b-wave amplitudes (μV) in electroretinography
Effect of MgAT on NMDA-induced changes in the retinal NF-κB p65 gene expression
NF-κB p65 is one of the transcription factors that promote apoptotic cell death in response to glutamate excitotoxicity by stimulating proapoptotic signaling cascades (Iomdina et al.,2007). Therefore, in this study, NF-κB p65 gene and protein expressions were measured at four time points (3, 6 and 24 hours and 7 days post-treatment). The time course analysis revealed an increased NF-κB gene expression in NMDAinjected retinas that peaked after 6 hours of NMDA exposure.As shown in Figure 6A, the NMDA group showed significant upregulation of NF-κB gene expression after 3, 6, 24 hours and 7 days after intravitreal administration by 3 (3 ± 0.75,P=0.009), 3.9 (3.87 ± 0.23,P< 0.01), 2.4 (2.45 ± 0.21,P< 0.01)and 2.5 (2.55 ± 0.13,P< 0.01) folds, respectively, compared to the PBS group. In contrast, NF-κB gene expression in the 24MgAT + NMDA group was downregulated after 6 hours and was sustained on that level until day 7. NF-κB gene expression in the 24MgAT + NMDA group was 1.2 (1.24 ± 0.12,P< 0.01),1.4 (1.37 ± 0.11,P< 0.01) and 1.4 (1.42 ± 0.12,P< 0.01) folds lower at 6, 24 hours and 7 days after treatment, compared to the NMDA group.
Effect of MgAT on NMDA-induced changes in retinal NF-κB p65 protein expression: Western blot assay
In this study, the expression of NF-κB p65 protein was estimated using western blot assay (Figure 6B). Densitometric analysis is presented in Figure 6C. The NF-κB protein expression in NMDA exposed retinas was found to be significantly higher after 24 hours by 1.9 (0.33 ± 0.04,P=0.001) folds and after 7 days by 2.8 (0.33 ± 0.02,P< 0.01)folds compared to the PBS group. Pre-treatment with MgAT suppressed NMDA-induced NF-κB upregulation in the retina by 2 (0.16 ± 0.01,P= 0.01) folds at 24 hours and by 2.2 (0.15 ±0.02,P< 0.01) folds after 7 days. In MgAT-treated retinae, NFκB protein expression was comparable to the PBS group at alltime points post-treatment.
Effect of MgAT on NMDA-induced changes in p53 gene expression in retina: RT-PCR
p53 gene and protein expression were evaluated at four time points (3, 6 and 24 hours and 7 days). The time course analysis for the NMDA group showed increased gene expression of p53 at all time points compared to the PBS group. The highest level of p53 gene expression was seen at 3 hours after intravitreal NMDA injection amounting to a 3.7 fold difference from the PBS group (3.75 ± 0.5,P= 0.001). The p53 gene expression in the NMDA group gradually declined over the next 24 hours. However, it remained significantly higher compared to the PBS group after 6, 24 hours and 7 days by 2.5 (2.56 ± 0.1,P< 0.01), 2 (2.0 ± 0.9,P= 0.001) and 2 (1.97± 0.2,P< 0.01) folds, respectively. In MgAT pre-treated group,p53 gene expression initially peaked at 3 hours with a 3 fold difference from the PBS group (3.0 ± 0.5,P= 0.003). However,it declined after 6 hours and became comparable to the PBS group subsequently. In fact, at 6, 24 hours and 7 days posttreatment, p53 gene expression in the 24MgAT + NMDA group was lower by 2.5 (1.0 ± 0.13,P< 0.01), 1.6 (1.3 ± 0.2,P= 0.004),and 1.8 (1.0 ± 0.05,P< 0.01) folds compared to the NMDA group (Figure 7A).
Effect of MgAT on NMDA-induced changes in p53 protein expression: Western blot assay
p53 protein expression was significantly upregulated by 3.7(1.1 ± 0.1,P< 0.01) and 4 (0.9 ± 0.1,P< 0.01) folds after 6 and 24 hours respectively in the NMDA group compared to the PBS group. Pre-treatment with MgAT suppressed NMDAinduced p53 upregulation in the retina by 3.2 (0.35 ± 0.04,P< 0.01) and 4 (0.22 ± 0.01,P< 0.01) folds after 6 and 24 hours, respectively, as compared with the NMDA group.The expression of p53 in the 24MgAT + NMDA group was comparable to that in the PBS group at 6 hours post-treatment and its expression persisted at that level subsequently (Figure 7B and C).
Effect of MgAT on NMDA-induced changes in c-Jun gene expression in the retina: RT-PCR
c-Jun gene expression leads to the formation of AP-1 transcription factor which is involved in the transcription of pro apoptotic genes. In this study, c-Jun gene expression in the NMDA group was upregulated at 3, 6 and 24 hours with the peak effect seen at 24 hours after injection as compared with the PBS group with a difference of 3.1 (3.13 ± 0.16,P= 0.002), 3.1 (3.1 ± 0.06,P< 0.01), and 4.4 (4.4 ± 0.1,P<0.01) folds, respectively. Expression of c-Jun was significantly downregulated in the 24MgAT + NMDA group at 3, 6 and 24 hours by 1.8 (1.7 ± 0.7,P= 0.016), 2.4 (1.2 ± 0.5,P= 0.001),and 3.3 (1.3 ± 0.1,P< 0.01) folds as compared with the NMDA group. The gene expression in both the NMDA and 24MgAT +NMDA groups was comparable to that in the PBS group after 7 days of intravitreal administration (Figure 8A).
Effect of MgAT on NMDA-induced changes in c-Fos gene expression in the retina
c-Fos is one of the immediate early genes which binds to the AP-1 complex to promote cell death. The gene expression of c-Fos in NMDA exposed retinae was upregulated after 3 hours of intravitreal administration and was significantly higher by 9 (9.2 ± 0.1,P< 0.01) folds compared with the control group.Subsequently, the expression of c-Fos peaked at 6 hours post NMDA injection and drastically reduced after 24 hours of injection. At 3 hours after treatment, c-Fos expression in the 24MgAT + NMDA group displayed a 6-fold (5.9 ± 1.0,P<0.01) upregulation compared the PBS group. The c-Fos gene expression in the 24MgAT + NMDA group was lower by 1.5(P= 0.003), 3.9 (3.6 ± 0.5,P< 0.01) and 2.4 (1.27 ± 0.1,P=0.001) folds at 3, 6 hours and 7 days, respectively (Figure 8B)compared with the NMDA group.
Effect of MgAT on NMDA-induced changes in AP-1 protein expression in the retina
AP-1 is a ubiquitous protein complex that can be activated by the NMDA-induced excitotoxicity and leads to the activation of Jun and Fos family members. Figure 8C and D shows that in NMDA exposed retinae, AP-1 protein expression was upregulated at 3 and 6 hours after the intravitreal administration compared with the PBS group at the corresponding time points. At these time points, the NMDA group showed greater AP-1 expression than did the PBS group by 3.6 (P< 0.01) and 3.2 (P< 0.01) folds, respectively.The 24MgAT + NMDA group showed significantly lower AP-1 expression at 3 and 6 hours post injection by 3.9 (P< 0.01)and 3.3 (P< 0.01) folds when compared with the NMDA group. The AP-1 protein expression in all three groups was comparable after 24 hours of intravitreal treatment.
Effect of MgAT on exploratory and locomotor activity of rats after NMDA exposure
The open field test was done to measure the exploratory and locomotor activity of rats. The animals were first habituated to the open field arena. As shown in each of the behavioral activity in Figure 9, the behavioral patterns of NMDA-treated rats as measured by total distance travelled, number of line crossing, rearing, number of freezing and grooming episodes and faecal boli count, indicated significantly higher exploratory activity compared with PBS and MgAT-treated rats.
Effect of MgAT on visual function in rats after NMDA exposure
ORT in the open field arena
During ORT (Figure 10A) at the familiarization phase (Trial 1),the number of approaches to novel objects was similar among rats in all tested groups. At the object displacement phase (Trial 2) (Figure 10B), when objects 4 () and 5 () were relocated to a novel location, the numbers of approaches to the nondisplaced objects 1 (), 2 () and 3 () in the 24MgAT + NMDA group were significantly lower by 2.4 (6 ± 1.08,P= 0.001), 1.6(11.6 ± 1.68,P= 0.023), and 1.7 (11.25 ± 0.7,P= 0.000) folds,respectively, and in the control group by 2.15 (6.9 ± 0.5,P=0.002), 1.5 (12.4 ± 0.9,P= 0.039), and 1.3 (14.25 ± 2.16,P=0.013) folds, respectively, compared with the NMDA group.In the next trial for object replacement (Trial 3) (Figure 10C),when object 1 () was replaced by object 1A (), the number of approaches to the non-replaced objects 2 (), 3 (), 4 ()and 5 () was lower in the PBS group by 2.3 (6.6 ± 1.9,P=0.006), 2.2 (7.14 ± 0.1,P= 0.005), 2 (7.8 ± 1.5,P= 0.014) and 3.4 (4 ± 1.44,P= 0.000) folds, respectively, and in the 24MgAT+ NMDA group by 2.98 (9.1 ± 1.2,P= 0.003), 3.2 (9.23 ± 1.23,P< 0.01), and 4 (9.36 ± 1.15,P< 0.01) and 1.8 (8.5 ± 0.82,P= 0.029) folds, respectively, compared with the NMDA group.The number of approaches to the replaced object 1A (was higher than that to non-replaced objects 2 (), 3 (), 4 () and 5 () in the MgAT and PBS groups. However, no difference was observed in the number of approaches to replaced objects versus non-replaced objects in the NMDA group.
ORT using a water maze
A modified Morris water maze was also used for the ORT. In this test, we recorded how much time the rats took to find the platform. No significant differences were observed among the three groups from day 1 to day 5. However, from day 6 to day 7, task performance was significantly lower in the NMDA and 24MgAT + NMDA groups than that in the PBS group. On testing day 8, the NMDA group showed a significantly lower(3.1 fold) task performance (59.35 ± 0.4,P= 0.000) than the PBS group (19.0 ± 2.6). Meanwhile, the task performance in the 24MgAT + NMDA group was comparable to that in the control group (Figure 11), but it showed a significantly higher task performance of 2.6 (23.14 ± 5.2,P= 0.001) folds compared with the NMDA group.
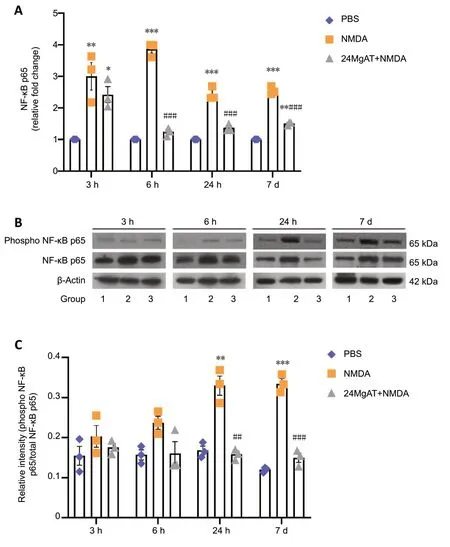
Figure 6 |Effect of pre-treatment with MgAT on NMDA induced changes in NF-κB gene and protein expression as determined at 3, 6, 24 hours and 7 days post-treatment.

Figure 7 | Effect of pre-treatment with MgAT on NMDA induced changes in p53 gene and protein expression as determined at 3, 6, 24 hours and 7 days post-treatment.

Figure 8 | Effect of pre-treatment with MgAT on NMDA-induced changes in c-Jun/c-Fos gene and AP-1 protein expression as determined at 3, 6, 24 hours and 7 days post-treatment.
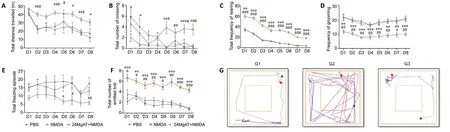
Figure 9 | The effect of MgAT against NMDA-induced changes in exploratory and locomotor activity of rats using the Open Field Test.

Figure 10 | The effect of MgAT against NMDA-induced changes in visual function using an open field arena.

Figure 11 | The effect of intravitreal administration of MgAT against NMDA-induced changes in visual recognition using a water maze.
Discussion
The quantitation of RGCs has become a standard procedure in almost all studies on retinal degenerations or glaucomatous optic neuropathies, as glaucoma is characterized by apoptotic loss of RGCs in the GCL. In this study, retrograde labeling of RGCs by FG (the neuronal tracer) and BRN3A immunostaining were the techniques employed to investigate the protective effects of MgAT against NMDA-induced RGC loss. Retrograde neuroanatomical tracer can specifically label alive RGCs in the GCL. The use of other non-specific stains does not adequately differentiate RGCs from other neurons in the GCL (Vidal-Sanz et al., 1988). A family of transcription factors that is specifically expressed exclusively in RGCs is the BRN3. Thus,BRN3A immunostaining is also used for the identification of RGCs. According to Danias et al. (2002), with FG, the highest RGC density did not appear to consistently localize in any one quadrant, suggesting that rat retina does not exhibit strict radial symmetry (Liang and Clarke, 2001; Nagata et al., 2014; Maekawa et al., 2017). Therefore, in the current study, RGC counts over three areas in four quadrants gave a reasonably accurate estimate of a representative RGC count over the entire retina. Since, the 24MgAT + NMDA group showed significantly greater RGCs count compared with the NMDA group with both the retrograde labeling and BRN3A staining, its neuroprotective effect was evident and this was in accordance with our previous study that showed preservation of retinal morphology after pre-treatment with MgAT (Lambuk et al., 2017). These findings lead to the conclusion that pretreatment with MgAT prevents NMDA-induced RGC loss by protecting RGCs from apoptosis.
Several transcription factors are known to be involved in the control of retinal neuronal apoptosis, including the protein families of NF-κB, p53, c-Jun and c-Fos (Fan and Cooper,2009; Vuong et al., 2012; Sakamoto et al., 2017). At the early stage of apoptotic signaling cascade, these regulatory genes control the internucleosomal DNA fragmentation (Estus et al., 1994). In cultured cells, these factors have been shown to be modulated by antisense, antibody, gene mutation,and different pharmacological agents leading to delay in the apoptotic death, suggesting that these factors may contribute to the generation of apoptotic cascades (Estus et al., 1994;Ham et al., 1995; Laurie et al., 2006; Jia et al., 2013). In this study, we investigated the mechanism of antiapoptotic effect of MgAT against NMDA-induced excitotoxicity through the evaluation of gene and protein expressions of NF-κB, p53 and AP-1 family members (c-Jun/c-Fos).
Several studies have shown that glutamate receptor stimulation strongly activates NF-κB and its inhibitor protects neurons against excitotoxicity (Uberti et al., 2000; Fan and Cooper, 2009). It also plays a role in ROS mediated apoptosis(Neill and Kaltschmit, 1997; McInnis et al., 2002; Iomdina et al., 2007). On the contrary, NF-κB can be protective as it activates Bcl-2 family of proteins, which can counteract the proapoptotic effect of Bax (McInnis et al., 2002). NF-κB may be instrumental in proapoptotic cascade upon excitotoxic stimulation and antiapoptotic role under non-excitotoxic stimuli, for instance, optic nerve transection and serum deprivation (Grilli and Memo, 1999; Choi et al., 2000; Charles et al., 2005). Among other NF-κB proteins, p65 has been shown to be activated in NMDA-induced retinal excitotoxicity as well as other neurodegenerative diseases (Pizzi et al., 2002,2007; Kitaoka et al., 2004, 2007). The current investigation has enabled us to determine the expression of NF-κB p65 gene and protein.
The present study also demonstrated that the exposure to NMDA increases the retinal expression of NF-κB p65 gene and protein. A single dose administration of NMDA led to increased NF-κB p65 gene expression as early as 3 hours post-treatment and accordingly the protein expression was significantly increased at 24 hours. Increased phospho-NFκB expression indicated its increased activation in response to NMDA. It is likely that the observed changes in NF-κB expression at these early time points also involve acute response to NMDA in glial cells as glutamate has been shown to activate NF-κB in retinal cells other than RGCs(Fan and Cooper, 2009). The subsequently increased NFκB expression at a later time point of 7 days post injection could be due to the constitutive response of RGCs (Wu et al., 2002; Herkenham et al., 2011). Pre-treatment with MgAT reduced both NF-κB p65 gene and protein expression. It also suppressed phospho-NF-κB expression, indicating its reduced activation. Our previous studies have also noted that NMDA induces retinal and optic nerve damage in association with suppression of proapototic markers and this effect of NMDA was abolished by pre-treatment with MgAT (Lambuk et al.,2017).
It could therefore be concluded that the protective effect of MgAT against NMDA-induced apoptosis was likely to be the outcome of the suppressed expression and activation of NF-κB. The suppression of NF-κB activation may involve the suppression of the phosphorylation of IKB as glutamate has been shown to promote NF-κB migration to the nucleus by promoting IKB phosphorylation (Kwon et al., 2016).
Our study also investigated the effect of MgAT on NMDAinduced changes in the expression of p53 gene and protein.NMDA-induced RGC loss corresponded with increased levels of p53 gene and protein. This was in accordance with the findings of previous studies, which showed that increased p53 activity leads to RGC apoptosis after axotomy (Wilson et al.,2013, 2014) and inactivation or low expression of p53 provide a protective effect against retinal ischemia or excitotoxic insult(Rosenbaum et al., 1998; Li et al., 2002; Liebermann et al.,2007). There is evidence that p53-mediated RGC apoptosis is accompanied by upregulation of Bax and Bid level,accompanied by cytochrome C release from mitochondria and the activation of caspase-3 dependent signaling cascade (Libby et al., 2005; Maes et al., 2017). There is strong correlation between p53 and Bax/Bcl-2 ratio, suggesting that Bax and Bcl-2 expressions are highly regulated by p53 gene (Xiang et al.,1998; Hudson et al., 2005; Singh et al., 2015).
In the present study, increased p53 expression after NMDA exposure was evident as early as 3 hours post-treatment and persisted throughout the experimental period. Pre-treatment with MgAT protected against NMDA-induced increase in the expression of p53. This protective effect was not evident at an early time point of 3 hours, however, subsequently during entire experimental period the downregulation of p53 was prominent. It is notable that the ratio of phospho p53/total p53 was significantly altered only at 6 hours post-treatment and at subsequent time points. Therefore, the onset of the effect of MgAT on the expression and activation of p53 seemed to be appropriately timed to provide protection against NMDA-induced changes. Continued suppression of p53 expression and activation by MgAT pre-treatment up to 7 days post-treatment correlated with its protective effect against NMDA-induced RGC loss as observed by retrograde labelling and BRN3A staining. Our findings were in accordance with other studies demonstrating that attenuation of p53 activity prolongs retinal cells survival following ischemia or optic nerve crush (Joo et al., 1999; Munemasa and Kitaoka,2013). Importantly, p53-mediated expression of proapoptotic proteins, such as Noxa and Bax, might be antagonized by BRN3A pro-survival function in RGCs through the activation of antiapoptotic genes, for example Bcl-2 and Hsp27 (Hudson et al., 2005; Beckerman and Prives, 2010). Reduced p53 expression after MgAT pre-treatment seemed to restore the balance between pro- and anti-apoptotic proteins resulting in greater RGC survival.
Our study investigated both the transcription factors AP-1 as well as c-Jun and c-Fos. The latter are partners in the AP-1 complex which influences several cellular processes such as differentiation, proliferation and apoptosis, depending on the cellular context and stimulus (Gass and Herdegen, 1995;Herdegen and Leah, 1998). Enhanced activation of c-Jun and c-Fos has been shown to promote apoptosis (Ershov et al.,1996; Oshitari et al., 2000; Kim et al., 2008). The excitotoxic retinal cell loss in GCL and INL is associated with the activation of c-Jun/c-Fos proteins (Levkovitch-Verbin et al., 2005;Munemasa et al., 2005). This study also showed increased expression of AP-1, c-Jun and c-Fos as early as 3 hours post NMDA exposure. It has been suggested that a substantial increase of c-Jun/c-Fos gene expression after excitotoxic insult in RGCs and amacrine cells could lead to the secondary injury in other retinal and/or glial cells by promoting proapoptotic gene expression (Raivich, 2008; Bessero et al., 2010).
MgAT pre-treatment protected against NMDA-induced increase in the expression of AP-1, c-Jun and c-Fos. Although gene expression of c-Fos in the 24MgAT + NMDA group was shown to be upregulated at the first 3 hours, it was reduced abruptly after 6 hours of intravitreal injection. These findings are in line with other studies which showed that blockade of c-Jun/c-Fos upregulation inhibits retinal cell death after excitotoxic insults (Meade et al., 2010; Fahrenthold et al.,2018). Downregulation of AP-1 has also been shown to prevent apoptosis of photoreceptors (Jia et al., 2013).
It is noteworthy that observations made in this study may have resulted from a cross-talk among NF-κB, p53 and AP-1.Since, p53 activation has been shown to occur downstream of NF-κB activation (Aleyasin et al., 2004), it is likely that the effect of MgAT pre-treatment on the expression of p53 is secondary to its effects on NF-κB expression. Similar studies have shown cross talk between AP-1 and NF-κB. Accordingly,in TNF-α-treated mammalian retina, induction of AP-1 was shown to activate IKK complex, which in turn activated NFκB (Zhao and Lee, 1999; Yang et al., 2001). Therefore, it is also likely that the effects of MgAT pre-treatment on NF-κB expression are secondary to its effects on AP-1 expression. In Figure 12, we propose the possible mechanisms underlying the neuroprotective effects of MgAT against NMDA-induced RGC loss based on the results of the current study as well as earlier findings.
In this study, ERG was used to confirm if the molecular changes in the retina were associated with functional changes.From an experimental standpoint, ERG has confirmatory rather than primary diagnostic value because damage to any of the retinal cell types could result in changes in ERG:photoreceptors (a-wave ERG), and amacrine, bipolar, and,mainly, Müller cells (b-wave ERG) (Mdzomba et al., 2018;Peresypkina et al., 2019). The amacrine and bipolar cells are located in the inner nuclear layer, and are known to be sensitive to NMDA-induced pathology (Hughes, 1997;Lam et al., 1999; Fischer et al., 2015). A degeneration of photoreceptor cells was also reported via ERG in patients with late stage of glaucoma progression (Velten et al., 2001).According to Cheng et al. (2014), retinal exposure to NMDA in rats causes a marked decrease in the amplitudes of a- and b-wave. However, studies in rabbit retina suggested that a noticeable contribution to b-wave generation is the result of activity in third-order neurons (Dong and Hare, 2000). The results of this study indicate that pre-treatment with MgAT partially preserved the functional activity of the retina against NMDA-induced excitotoxicity.
To corroborate this, the functional outcome of the cellular changes in rat retinas, visual functions were examined using three behavioral paradigms from day 8 and onward after intravitreal administration of MgAT. Two ORTs - open field test and Morris water maze test - were employed to examine the visual functions of rats. First, the exploratory (locomotor activity) and anxiety-related behavior in rats were assessed using the open field test. Then, they were exposed to objects with different shapes in the open field arena (Bailey and Crawley, 2009). The presence of objects in the open field arena helped to examine the innate preference by which rats with healthy vision spend more time exploring a novel object compared with rats with impaired vision. Next, the rats were subjected to the Morris water maze test, where the submerged platform was paired with triangle-shaped card. All tests were carried out in dim white light to maintain the same intensity for all animals. To avoid the auditory stimuli, the tests were done in a completely sound proof experimental room.
In this study, rats exposed to NMDA demonstrated high exploratory activity and anxiety-like behavior when placed in the open field arena suggesting a response towards stress associated fear of navigation in unfamiliar environment.Additionally, rats with poor vision are known to rely more on the olfactory sense. Rats with healthy vision can recognize better and quickly adapt themselves to the new surroundings compared with those with poor vision. In this study, NMDAadministered rats demonstrated significant increase in most of the parameters indicating the higher exploratory behavior,more so than the PBS- and MgAT-treated rats. Among all groups, the NMDA group showed longer total distance travelled, lowest number of freezing episodes, and higher numbers of line crossing, rearing, grooming and faecal boli.This data was in line with a previous study by Avni and coauthors, who demonstrated that blind mole rats exhibited greater exploratory activity when exposed to unfamiliar environment (Avni et al., 2008). Thus, from the OFT, it was evident that rats treated with PBS and MgAT exhibited relatively greater “comfort” due to better vision compared with rats treated with NMDA.
ORT has been widely used as a measure of memory in rodents(Ennaceur, 2010). For this study, the total exploratory time spent by rats with the objects was measured to rule out any inherent differences in memory and learning abilities. To achieve the objectives, the ORT was divided into three phases:object familiarization phase, object displacement, and object replacement. The test was based on the innate preference of rats in recognizing the familiar object (Liang and Clarke, 2001).Rats with poor vision, on the other hand, failed to recognize the novel objects as they were unfamiliar to the novel objects and preferred to spend equal time around familiar and unfamiliar objects.
During the object familiarization phase, the rats in all test groups had a similar number of approaches to novel objects.During the displacement phase, objects 4 () and 5 () were displaced to a novel location (displaced objects), while objects 1 (), 2 (and 3 () were maintained in their original locations(non-displaced objects). When objects 4 () and 5 () were moved to different positions, rats in the MgAT and PBS groups showed a fewer number of approaches to the non-displaced objects 1 (), 2 () and 3 () than the NMDA group. This indicates that animals that received PBS and MgAT “visualize”and “remember” the original training experience from the familiarization phase. Thus they were found to approach the novel objects (displaced objects) more than the familiar ones (non-displaced objects). Meanwhile, rats exposed to NMDA demonstrated an almost similar number of approaches to all five objects. This variation between the numbers of approaches is probably because of the failure of NMDAtreated rats to recognize (visualize) familiar and novel objects as could PBS- and MgAT-treated rats. While rats from the PBS and 24MgAT + NMDA groups recognized the familiar objects and explored novel objects more, NMDA-treated rats seemed to show no preference and approached all objects at almost equal frequency.
During the stage of object replacement, when object 1 () was replaced by object 1A (), PBS and 24MgAT + NMDA groups had a fewer number of approaches to the non-replaced objects 2 (), 3 (), 4 () and 5 (than did the NMDA group,but markedly more in the case of replaced object 1A (). This result indicated that the animals treated with MgAT and PBS recognized that the object 1A () was novel, thus following their preference of exploring novel objects more than familiar ones. There was no similar observation in the NMDA group.
Thus the object recognition in OFT illustrated impaired visual function in NMDA-treated rats and this was probably the reason for their difficulty in recognizing objects. On the other hand, the 24MgAT + NMDA group as well as the rats in the PBS group performed better in the test, possibly because of their relatively preserved vision.
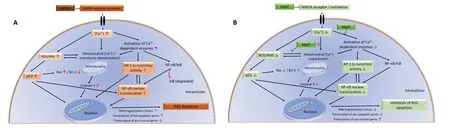
Figure 12 |Schematic representation of effect and antiapoptotic mechanism of neuroprotection by MgAT against NMDA-induced retinal damage.
Morris water maze test is a popular behavioral test for spatial learning and memory. The test requires animals to get away from a pool of water towards the safety of a platform using the object cues (triangular and circular objects). The platform is then hidden under the water’s surface so that the animal is required to remember its location, using the object cue(triangular and circular objects) for navigation, in order to escape. This part of the study was designed to evaluate visual impairment in rats after intravitreal NMDA injection.The objective was to evaluate if MgAT had a neuroprotective effect, the premise being that it is visual loss and not the amnesic properties of NMDA that was responsible for the observed changes. Another presumed assumption is that any difference between the groups would probably be due to visual impairment and not impaired learning and memory.
Among PBS-, NMDA- and MgAT-treated rats, there was no difference in the time taken to find the platform during the training period from day 1 to day 5 (days 8 to 12 postintravitreal administration). However, on days 6 and 7 (days 13 and 14 post-intravitreal administration, respectively), PBStreated rats located the platform faster than NMDA- and MgAT-treated rats. Although the animals were unable to quickly locate the platform during the several early training sessions, there were some significant changes several days later after they recognized the location of the platform based on the visual cues. The rats showed improvement in finding the platform as training progressed, which meant they seemed to have learnt the strategies on how to locate the platform and what to do with it.
On test day 8 (day 15 post-intravitreal administration), PBSand MgAT-treated rats found the platform much faster than did the NMDA-treated rats. This could be because the rats from these two groups could locate the exact platform position based on the triangle cue. NMDA-treated rats took longer time to find the platform than those in the PBS and 24MgAT + NMDA groups. This could be attributed to the animals’ difficulty to recognize the triangle object clue and find the submerged platform. Overall, rats in the PBS and 24MgAT + NMDA groups recognized the location of the hidden platform faster than those in the NMDA group. This finding could be considered further evidence of the protective effect of MgAT on visual function. Additionally, the track plot from the test day 8 demonstrated that rats made an instant choice to swim toward the submerged platform after being released to the pool. Rats with poor vision, on the other hand, showed a tendency to swim along the side walls. This observation was in accordance with a previous study, which suggested that animals with healthy vision could head immediately towards the cue (Robinson et al. 2001).
The current design of the experiment, however, has some limitations. It did not include some of the elements that have been considered important in the evaluation of visual functions in rodents. First, the viewing distance for the animals from the release point to the cue card was not fixed (Robinson et al., 2001). This could affect object recognition, hence,differently affecting the visual acuity among rats. Second,the current design of the experiment did not accommodate visual function assessment of one or the other eye. Third, the experiment did not measure the visual acuity of the animals,i.e. their ability to see closely placed objects and borders closely and clearly (Morris, 1984). Despite limitations, the current study provides an opportunity for testing the visual ability of rats to recognize the objects of different shapes.
Conclusions
MgAT abolishes NMDA-induced increase of retinal phospho-NF-κB, phospho-p53 and AP-1, c-Jun and c-Fos expression.These molecular effects of MgAT correlated with greater RGC survival, improved electroretinograms and preserved visual functions. However, more research is required on the therapeutic potential of MgAT before it can be used for clinical applications. Moreover, the current study used an intravitreal route of administration which may not be appropriate in clinical practice. The current need is to develop such formulations of MgAT that could be administered noninvasively for future clinical application.
Acknowledgments:We acknowledge the administration and facility support by Research Management Institute, Institute of Medical Molecular Biotechnology and Laboratory Animal Care Unit, UniversitiTeknologi MARA, Malaysia.
Author contributions:All authors have contributed substantially to the conception, design, drafting of the article, and approved the final version of the manuscript to be submitted. All authors have jointly decided to designate Prof Dr. Igor Iezhitsa to be responsible for decision-making regarding the presence of authors and the order of their presence in the manuscript. Prof Dr Igor Iezhitsa has also been selected by all authors to be responsible for all future communication with the journal regarding this manuscript.
Conflicts of interest:The authors declare that no competing interests exist.
Financial support:This study was financially supported by Ministry of Higher education, Government of Malaysia, under the grant No.RAGS/2013/UITM/SKK03/2 [UiTM file no. 600-RMI/RAGS 5/3 (103/2013)]and the Institut Pengurusan Penyelidikan (RMI), Universiti Teknologi MARA, Malaysia, under the grant 600-IRMI/MyRA 5/3/LESTARI(0088/2016).
Institutional review board statement:All performed procedures were approved by the Animal Ethics Committee of Universiti Teknologi MARA(UiTM), Malaysia, UiTM CARE No 118/2015 on December 4, 2015 and UiTM CARE No 220/7/2017 on December 8, 2017 and Ethics Committee of Belgorod State National Research University, Russia, No 02/20 on January 10, 2020.
Copyright license agreement:The Copyright License Agreement has been signed by all authors before publication.
Data sharing statement:Datasets analyzed during the current study are available from the corresponding author on reasonable request.
Plagiarism check:Checked twice by iThenticate.
Peer review:Externally peer reviewed.
Open access statement:This is an open access journal, and articles are distributed under the terms of the Creative Commons Attribution-NonCommercial-ShareAlike 4.0 License, which allows others to remix,tweak, and build upon the work non-commercially, as long as appropriate credit is given and the new creations are licensed under the identical terms.
 中國(guó)神經(jīng)再生研究(英文版)2021年11期
- 中國(guó)神經(jīng)再生研究(英文版)的其它文章
- Glycans to improve efficacy and solubility of protein aggregation inhibitors
- A biophysical perspective on the unexplored mechanisms driving Parkinson’s disease by amphetamine-like stimulants
- It takes more than tau to tangle:using proteomics to determine how phosphorylated tau mediates toxicity in neurodegenerative diseases
- Evaluation of glial cell proliferation with non-invasive molecular imaging methods after stroke
- Neutrophil in diabetic stroke:emerging therapeutic strategies
- Magnet-targeted delivery of bone marrow-derived mesenchymal stem cells improves therapeutic efficacy following hypoxic-ischemic brain injury