Numerical investigation on electron effects in the mass transfer of the plasma species in aqueous solution
School of Electrical Engineering,Shandong University,Jinan 250061,People’s Republic of China
Abstract
Keywords:plasma species,electron effect,mass transfer,aqueous solution,plasma biomedicine
1.Introduction
Plasma biomedicine has made great progress in recent years[1,2].The biochemical reaction of reactive oxygen species(ROS)plays an important role in acting on living cells[3].To date,many achievements have been made in the experimental and theoretical research on production mechanism[4],concentration regulation[5],and chemical reaction path for ROSs[6].But when it comes to applications such as wound healing[1],surgical procedures[7,8],teeth whitening[9,10],dermatology[11,12],disinfection[13],and cancer treatment[14-17],gaseous plasma must pass through the aqueous solution with the thickness from several tens to hundreds of micron in the surface of an organism before it can act on target[18].Due to quick and complex chemical reactions of the plasma in water,the hydrated ROSs finally acted on the target may be quite different from those in the gas region[19].Therefore,it is necessary to conduct an in-depth study on the interaction between plasma and aqueous solution to reveal the concentration and the reaction pathway of ROS in water.
Much effort has devoted to the investigation on the plasmas passing through aqueous solution,i.e.the mass transfer of the plasmas in aqueous solution,and a few satisfactory results have also been obtained by way of the experiment or theoretical simulation[20-22].However,it is still difficult to explore and show the detailed mass transfer process because the chemical diagnosis of liquid region plasma by experimental approach is very dependent on probe or detection reagent[23-25],and therefore,the numerical simulation becomes an alternative way to solve this problem.Recent years,many simulation models have been developed to describe the interaction between plasma and aqueous solution.A series of studies conducted by Kushner’s group demonstrated the interaction between air DBD plasma and water layer[26,27].Liu’s one-dimensional model of deionized water treated by gaseous plasma showed the mass transfer process of various ROS and RNS in aqueous solution,including the concentration regulation under parameter adjustment[28-31].Very recently,it has been shown in Jiang et al[32]that electrons play an important role in the interaction between the plasma and aqueous solution by changing the energy of electrons.In spite of the above investigations,it is still worthwhile to pay attention to electrons in the plasma and especially in the mass transfer of the plasma in aqueous solution since electrons,as important species,actively participate in the interactions of the plasma with aqueous solution,in which there are still many questions left open.As a matter of fact,the reactive species finally arriving at the surface of living cells are a result of the interaction or synergy between the plasma species.What effect do electrons have in this interaction process?How do electrons cooperate with the other species in the mass transfer?To what extent do electrons affect the reactive species finally acting on living cells?These are unclear at present.
Motived by probing into the synergy between the plasma species in the action on living cells,this work aims at exploring the effect of electrons on the mass transfer of plasma species in aqueous solution.To achieve this task,the plasma species are divided into two parts,i.e.electrons and the other species.Three groups of particles are considered respectively to enter into aqueous solution.These three group of particles are all the plasma species,the other species,and only the electrons,respectively.In each case,the depth distributions of major reactive species are calculated and analyzed in detail.
2.Simulation model
The data of the plasma used in the present simulation origin from a previous work[33],where the discharge is generated between two parallel metal plates with a separation of the 0.2 cm gap by applying a sinusoidal voltage,as shown by figure 1.The working gas is He/O2mixture with the oxygen concentration of 1%,and the gas temperature and the gas flow rate are 300 K and 1 slm,respectively.Furthermore,the applied sinusoidal voltage is of the amplitude of 511 V,the frequency of 13.56 MHz,and the average energy density of 40 W cm?3.The sample was placed on one side of the electrode to receive the irradiation of the plasma.
The mass transfer of plasma species in aqueous solution proceeds sequentially in the following three regions,i.e.the gas region(the region of generating the plasma),the gasliquid boundary region,and the liquid region.A simplified mass transfer diagram of plasma species in these three regions is shown in figure 2.
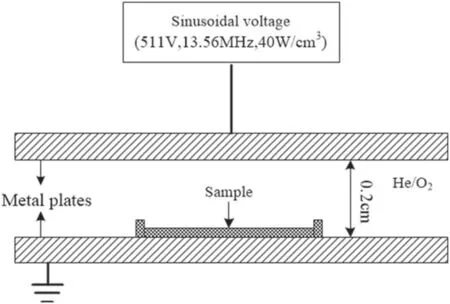
Figure 1.A schematic diagram of the system setup.
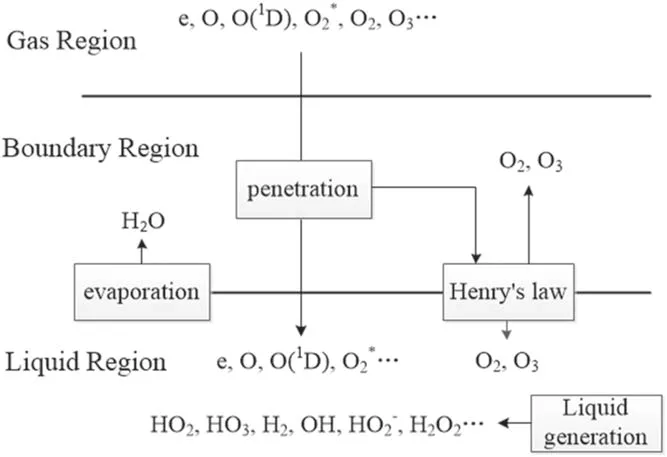
Figure 2.Mass transfer schematic diagram of plasma species from the gas region to the liquid region.The plasma is in the gas region,the liquid region represents the aqueous solution on the surface of the treated targets,and the boundary region indicates the gas/liquid interface layer with a thickness of submicrometer.
In figure 2,the plasma is in the gas region,the liquid region represents the aqueous solution on the surface of the treated targets,and the boundary region refers to the gas/liquid interface layer which is on a submicrometer scale in length[31].In the boundary region,there is a penetration of plasma species into the liquid region and in this process they will interact with the water molecules evaporating from the liquid region.Furthermore,some neutral species such as O2and O3are impacted by partial gas pressure according to Henry’s law.The main difference between the boundary region and the gas region is that in the boundary region,there are the water molecules of very high concentration evaporating from the liquid region and before entering into the liquid region,the plasma species from the gas region will be subject to reactions with these water molecules.In addition,some neutral species such as O2and O3will be rebalanced by partial gas pressure according to Henry’s law(see[31]and references therein).The input data used are the same as those in a previous work[32],where the details of the input data were given.Hence,only a brief description of these data in conjunction with the corresponding boundary condition is presented here for completeness.The transports of plasma species in the gas region and in the liquid region were modeled separately[33].Thus the fluxes and time-averaged concentrations of the plasma species generated in the gas region are taken from the simulation mentioned above and it is assumed that when the plasma species leave from the gas region,there is no loss of their fluxes(see[33]and references therein).In gas-liquid boundary region,an instantaneous mass transfer accompanied by pressure balance,ion hydration,and dehydration is reasonably assumed due to nanosecond timescale of mass transfer events in this region.Under this assumption,most neutral species and electrons can be considered to maintain their fluxes when going through the gas-liquid boundary region,and only some neutral species,such as HO2,O2,and O3,need to be treated particularly because the densities of these neutral species depend on the partial gas pressure due to Henry’s law[33].In addition,for ion speciesthey suffer from reactions with water molecules evaporating from the liqui d region,followed by charge transfer reactions,and consequently,ionic water clusters such as H+·(H2O)n=1-7andare produced.These water clusters may be considered to be absorbed into the liquid surface through rapid dehydration,releasing ions,and.Based on the above considerations,table 1 lists the fluxes of relevant species of entering the liquid region as the boundary condition in simulating the mass transfer of the ROSs.The thickness of the liquid region is 1 cm.The concentration of O2dissolved in water is considered to be saturated.There are 21 species in the liquid region,i.e.O2(b),OH,OH?,and e.In this work,the main 84 reactions are considered and listed in table 2,and a one-dimensional diffusion-reaction model is used to simulate the depth distribution of different reactive species in the liquid region.This model is appropriate to the liquid phase and also considers the drift due to the electric field of penetrating charged particles.The details of the model can be found elsewhere in[32,33].
As emphasized earlier,the aim of this work is to explore the effect of electrons on the mass transfer of plasma species in aqueous solution.Due to this,the plasma species are divided into two parts,i.e.electrons and the other species.The other species are also called the plasma species with an electron exclusion.An electron exclusion refers to removing electrons from plasma species.Figure 3 presents the mass transfer of the ROSs in the case of the electron exclusion.
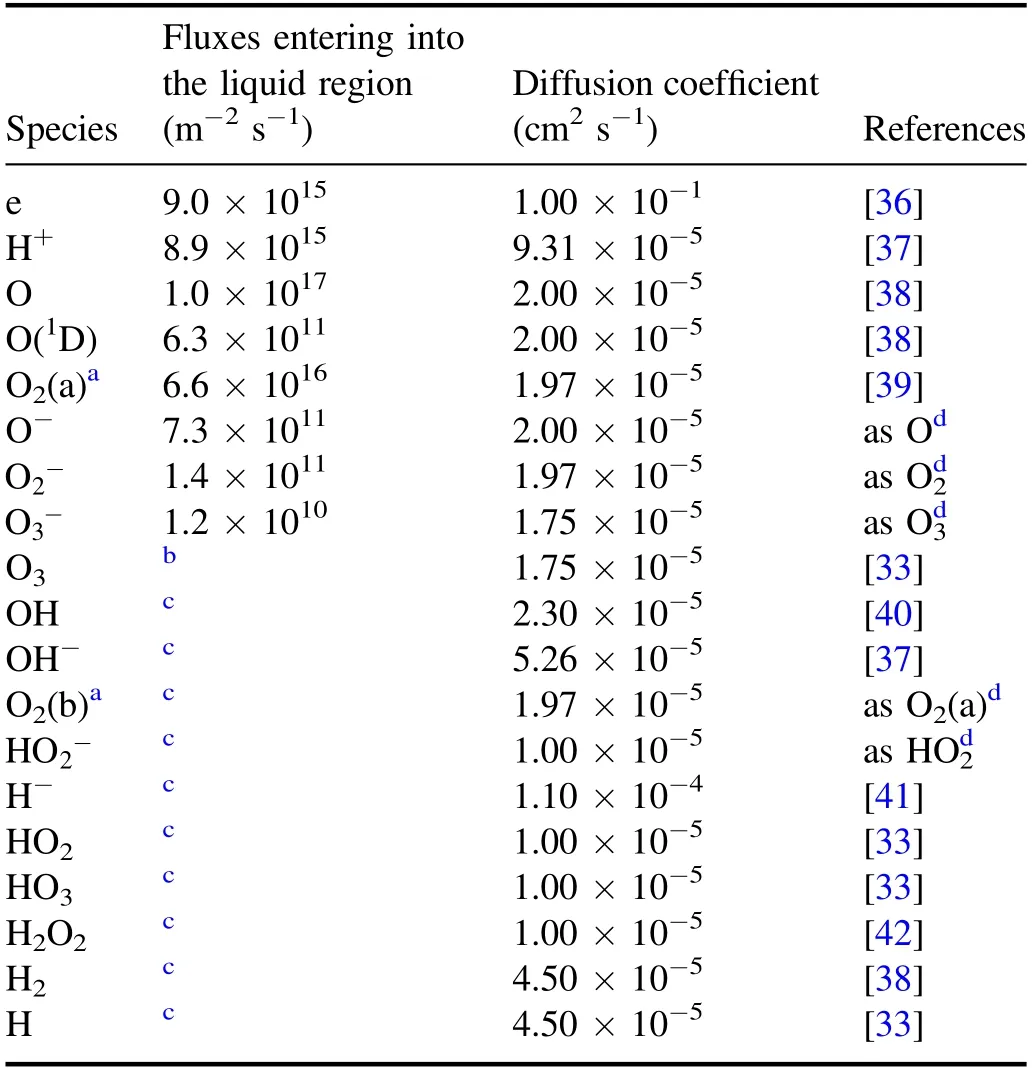
Table 1.Fluxes and diffusion coefficients of related species entering into the liquid region.
3.Results and discussion
Based on the model mentioned above,the mass transfer of plasma species in the three scenarios will be systematically calculated.The three scenarios are denoted by the scenarios I,II,and III,respectively.Specifically,three group of particles are considered respectively to enter into aqueous solution,and the mass transfer of each group of particles is simulated.The three group of particles include all the plasma species in the scenario I,the other species or the plasma species with an electron exclusion in the scenario II,and only the electrons in the scenario III.For making discussions clear below,key features for each scenario are listed in table 3.
In the scenario I,as pointed out in a previous work[32],after entering the liquid region,short-lived species such as e,H,O,and O(1D)react mainly with the oxygen or water molecule,leading to the formation of more long-lived species such as OH,O3,HO2,O2,and H2O2in the depth below 1 μm.Thus,in each scenario the depth distributions of these five major ROSs as well as the reaction pathway contribution to the five ROSs are calculated.Here,a reaction pathway contribution is defined as a ratio Ys/Ytwhere Ysis the yield of a species from a reaction and Ytis that from all the related reactions.Further,the analyses on the difference between the distributions of each ROS in the different scenarios will be made along the following line:firstly,comparing the result in the scenario I with that in the scenario II and elucidating the mechanism inducing the difference between the two results;secondly,implementing a superposition of the results in the scenarios II and III(called the scenario II+III); finally,analyzing the difference between the results in the scenario I and in the scenario II+III for revealing the effect of the electrons on the mass transfer.
In the present simulation,all the calculations are corresponding to the mass transfer after 60 s of plasma treatment to aqueous solution.In addition,the following
consideration needs to be mentioned here.It has well shown from the reported studies that electrons of entering into aqueous solution are of a short lifetime and thus have a small depth distribution compared to even short-lived radicals,but the electrons are an important precursor for other reactive species[34].Hence,the present work does not consider the distribution of electrons and focuses upon the effect of the electrons on the mass transfer of the ROSs in the liquid region,as mentioned earlier.
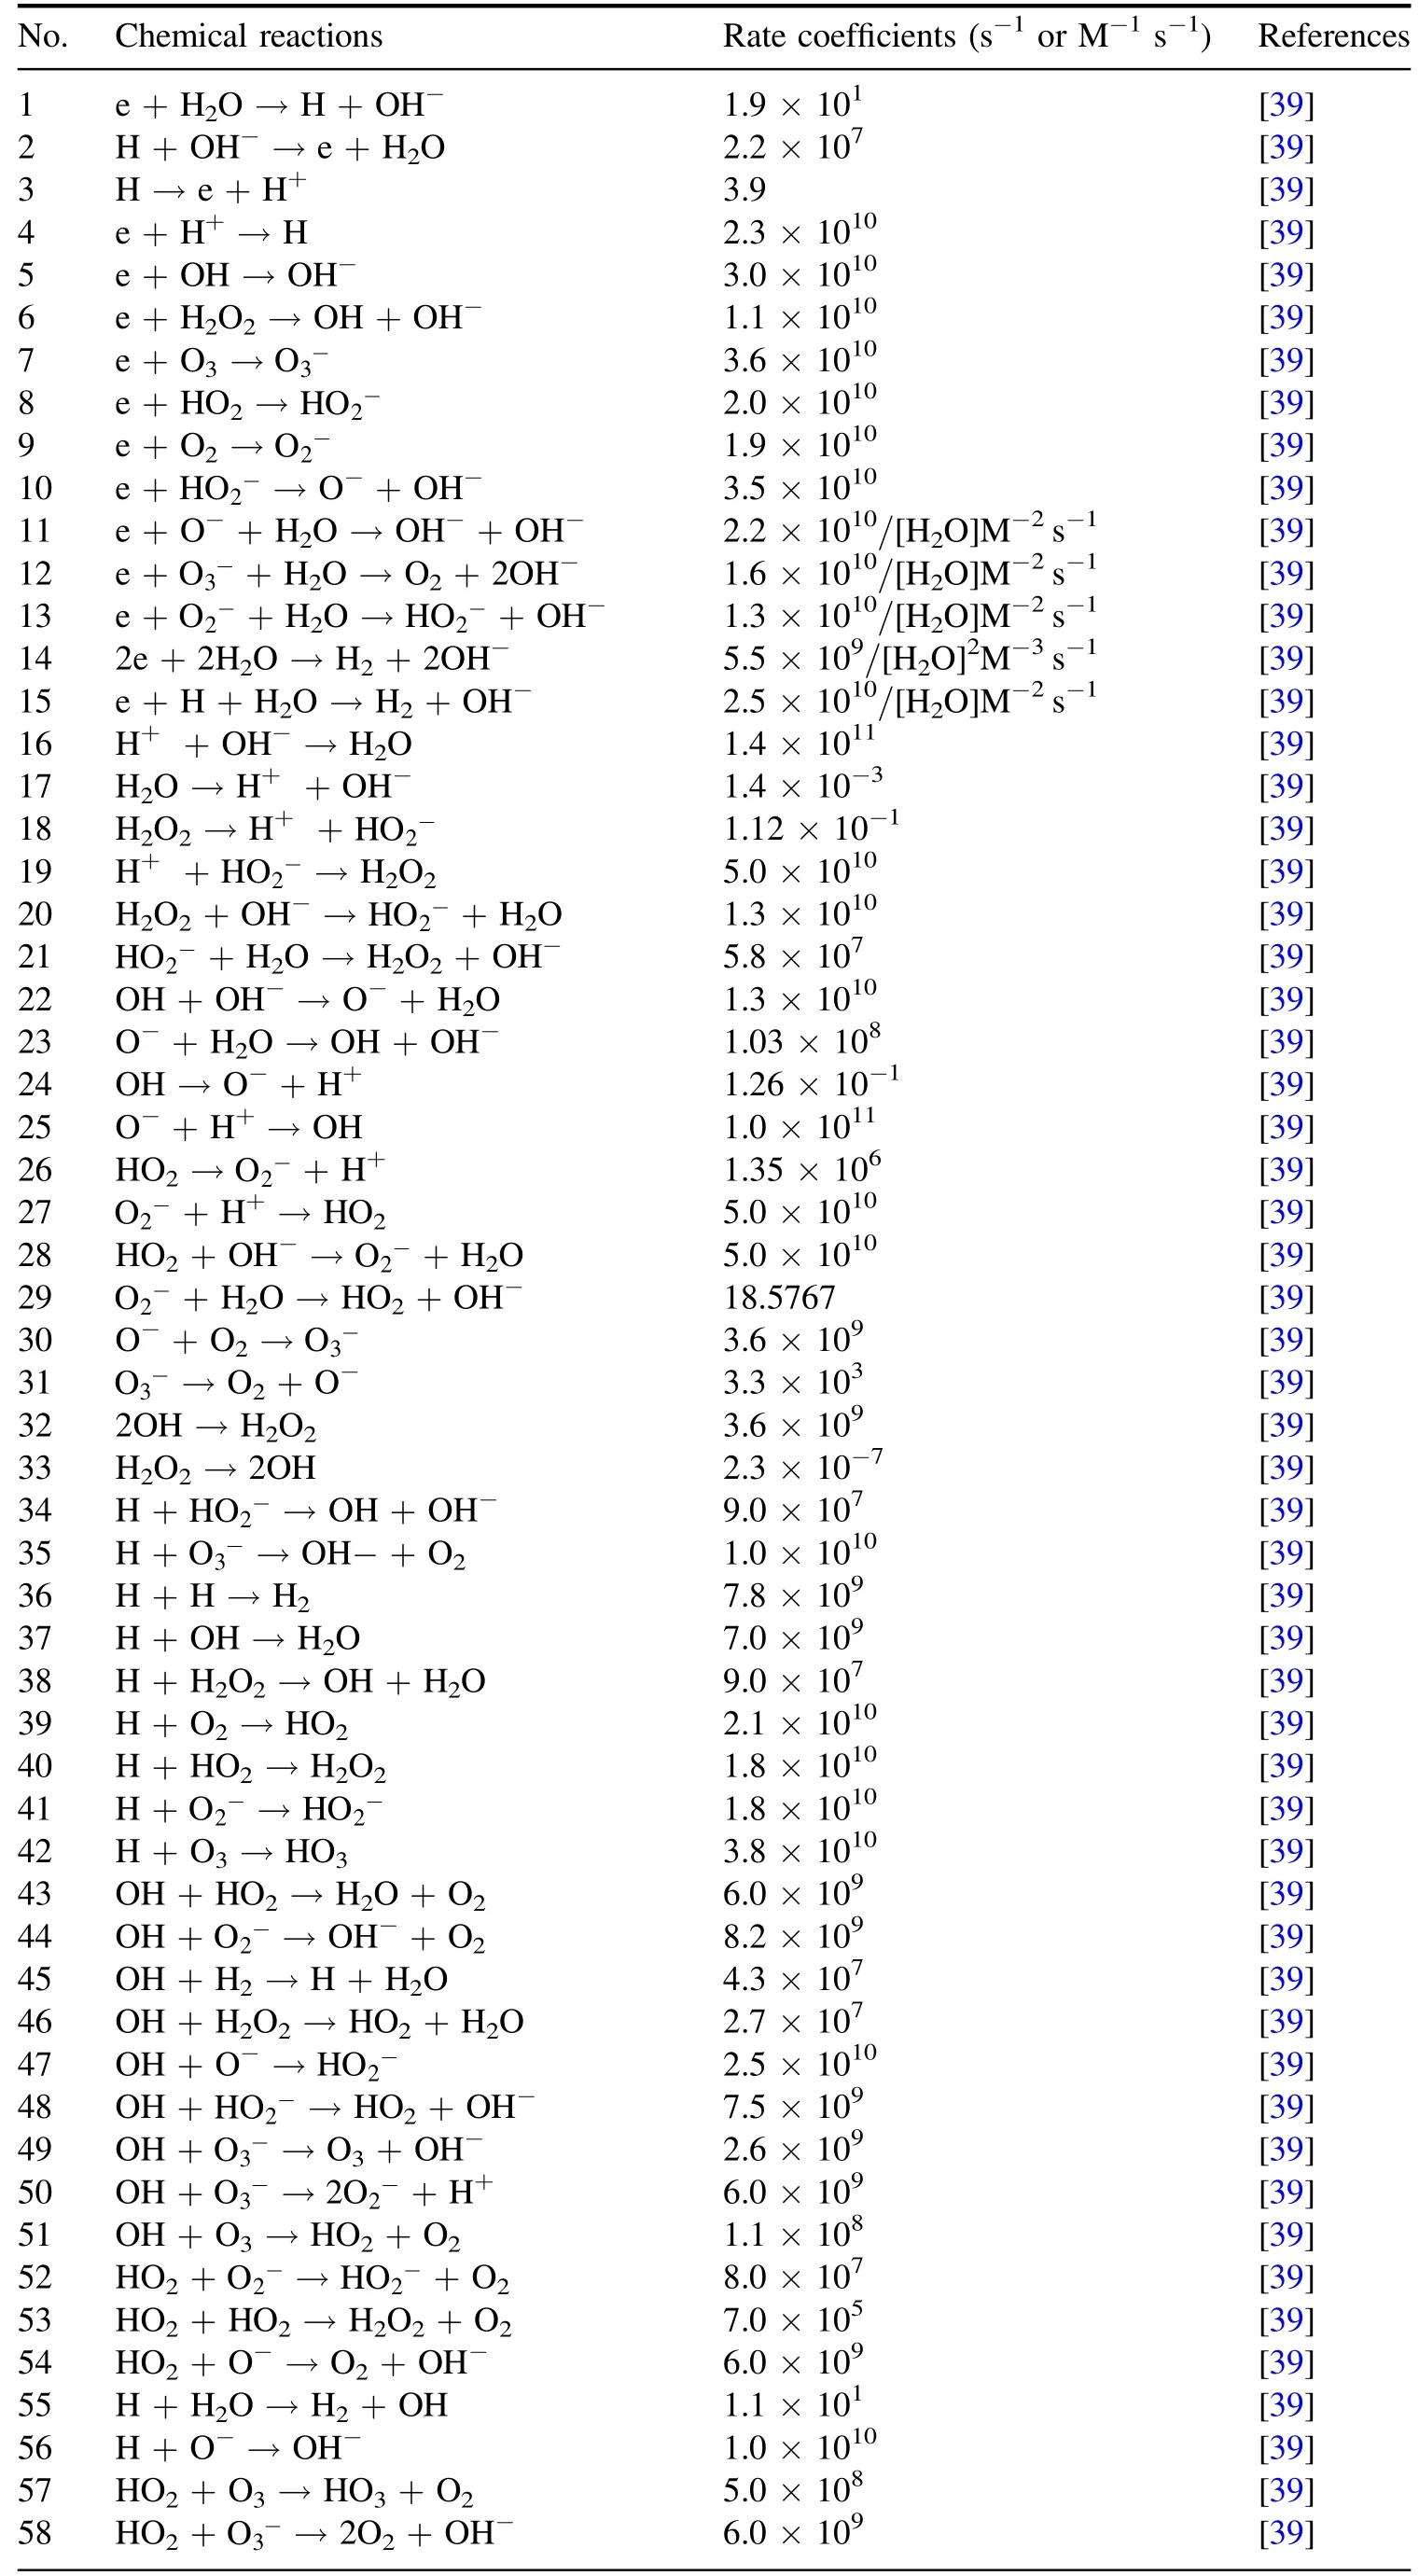
Table 2.Chemical reactions in the liquid region and the corresponding reaction rate coefficients.Note:M represents mol l?1(1 mol l?1=6.02×1020 cm?3).
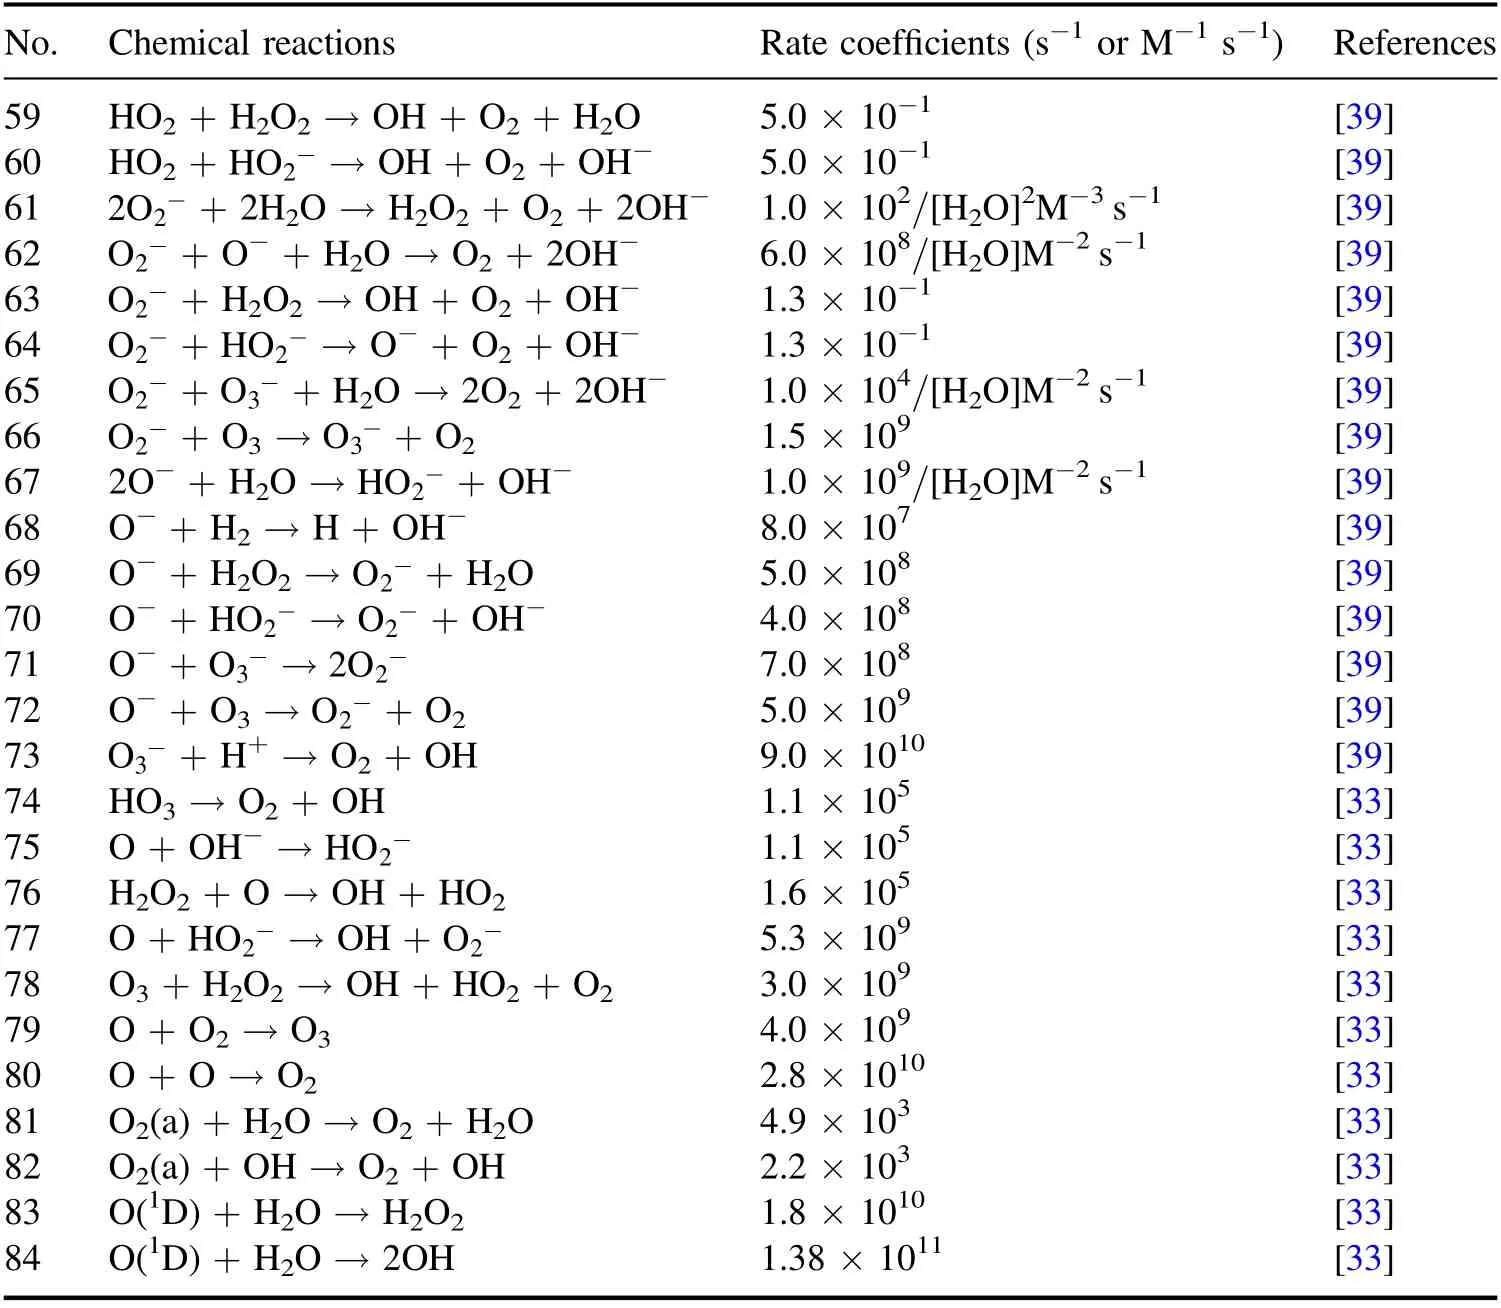
Table 2.(Continued.)
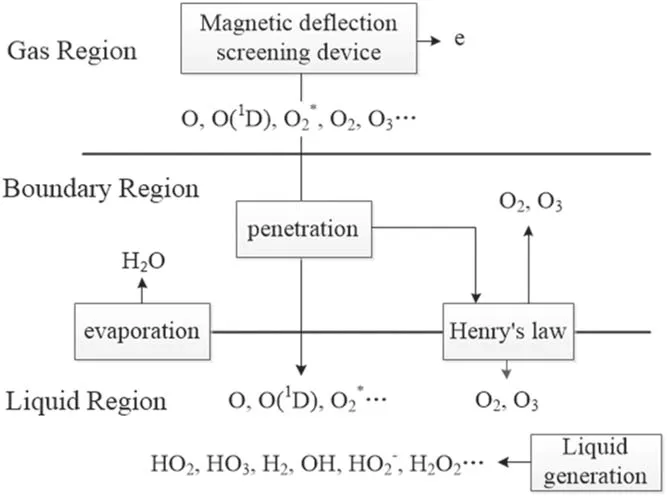
Figure 3.Schematic diagram of the plasma species mass transfer with an electron exclusion.
3.1.Comparison between the scenarios I and II
Figure 4 allows a comparison between the depth distributions of each ROS after 60 s of plasma treatment in the scenarios I and II.Figure 4(a)displays the results in the scenario I which are in agreement with the other theoretical evaluations[32,33].According to the figure 4(a),the penetration depths of OH and O3are about 6 and 7 μm,respectively,which are evidently small in comparison with those of HO2,O2?,and H2O2,i.e.0.19,1.1,and 1.3 mm.Noticing that the water layer on the surface of biological tissue generally is of 50-400 μm thickness,the effect of most species,having the penetration depth below 10 μm,is extremely limited due to the water layer.Figure 4(b)exhibits the depth distributions of the five ROSs in the scenario II.
Comparing figures 4(a)with(b),it is shown that the electron exclusion is of evident influence on the depth distributions of the five ROSs,leading to the increase or decrease in the penetration depth,from 6 to 10 μm for OH,from 7 to 11 μm for O3,from 190 down to 120 μm for HO2,and from 1100 down to 320 μm forO2?,and also indicating a higher concentration for OH and O3and a lower one for HO2and O2?.In addition,the concentration of H2O2decreases evidently,but its penetration depth is not changed,remaining at about 1.3 mm.Here,it needs to be mentioned that in this work the threshold concentration for each species is set at 6.02×1011cm?3,as made in[33]based on the consideration that this threshold concentration is at least one order of magnitude below the minimum inhibition concentration of the species such as H2O2and O3for planktonic bacteria.
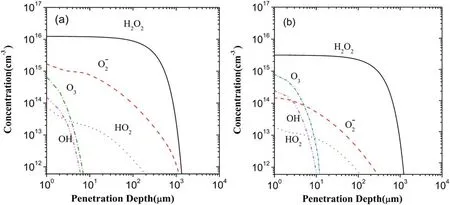
Figure 4.Depth distributions of the five major ROSs in the liquid region in the scenarios I(a)and II(b).
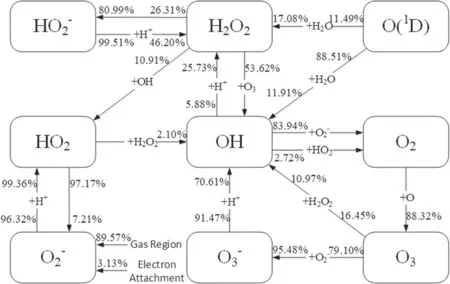
Figure 5.Pathway map of the main reactions related to the generation and loss of the five ROSs in the liquid region in the scenario I.A directed line segment together with the associated species represents a reaction pathway.The reaction between the two species respectively located in the beginning and the middle of the line segment or the decomposition of the species located in the beginning of the line segment generates the species pointed to by the arrow.

Table 3.Three scenarios and the corresponding initial fluxes of plasma species entering into the liquid region.
From the point of view of reaction kinetic,the calculation of the reaction pathway contribution to these species may help to understand and elucidate the mechanisms governing the above differences,and thus help to reveal the effects of the electrons on the mass transfer of the ROSs in the liquid region.In this context,the main reaction pathways plus their contributions to the five ROSs have been drawn from the present calculations in the scenarios I and II,respectively,as illustrated in figures 5 and 6.In these two figures,the two percentage numbers near the end and beginning of the line segment indicate respectively the contributions of the reaction pathway to the generation and loss of the species.
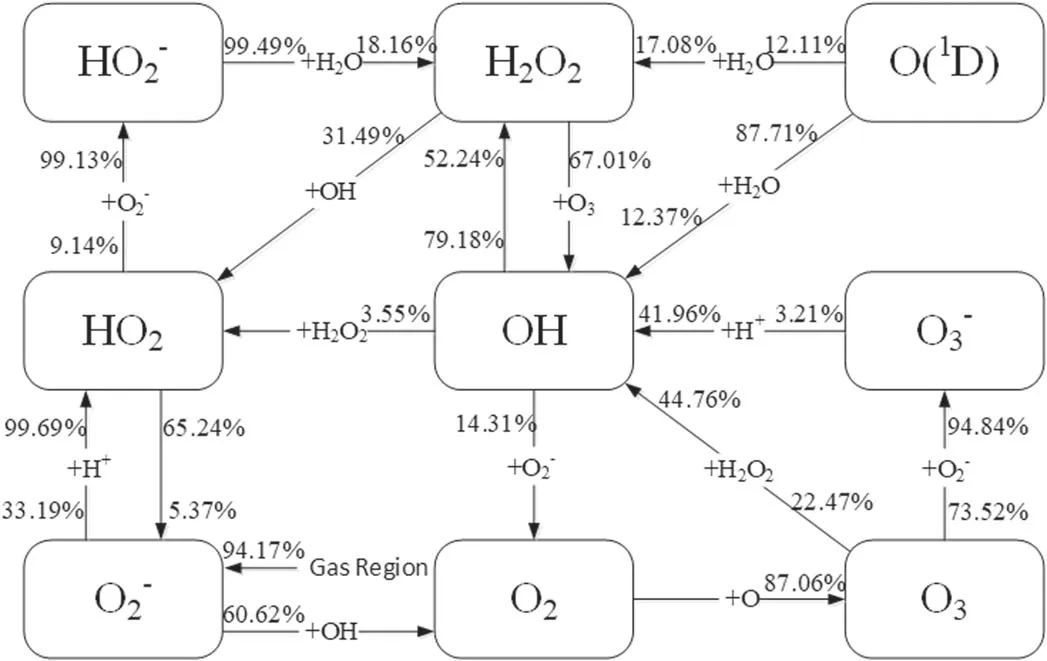
Figure 6.Pathway map of the main reactions related to the generation and loss of the five ROSs in the liquid region in the scenario II.The description for the reaction pathway as well as its contributions to the generation and loss of the species is the same as in figure 5.
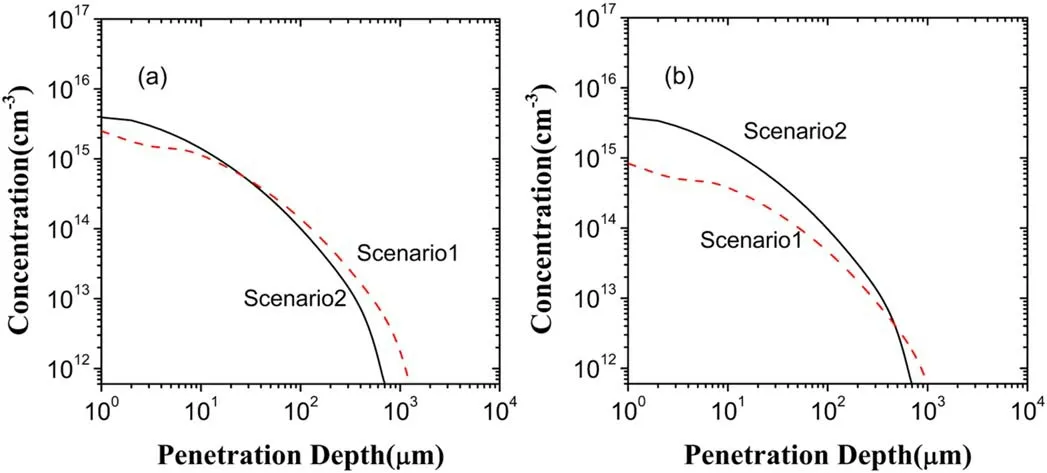
Figure 7.Depth distributions ofO2? in the liquid region in the scenarios I and II:(a)generatedO2?,(b)lostO2?.
As can be seen clearly from figure 4,the electron exclusion gives rise to the increase ofO2?not only in the distribution range but also in the concentration,compared to the scenario I.In fact,theO2?in the liquid region is mainly from the gas region in the scenarios I and II.TheO2?from the gas region accounts for about 89.57% in the scenario I and about 94.17% in the scenario II.Due to this,it may be deduced that in contrast with the scenario I,the change of the depth distribution ofO2?in the scenario II results mainly from the increase ofO2?loss.This deduction can be confirmed by the calculations of the generation and lossO2?in the scenarios I and II presented in figure 7.From figure 7,there is no evident difference betweenO2?generations in the two scenarios,butO2?loss increases significantly due to the electron exclusion.Further,from figures 5 and 6 it is shown t hat inthescenarioI,O2?lossisalmostfrom reactionO2?+H+→HO2,beingofacontributionofabout 99%,but in the scenario II this reaction contributes only 33.19% ofO2?loss and the reaction dominatingO2?loss becomes OH+O2?→OH?+O2with acontributionof60.62%.
In figure 4,the penetration depth and concentration of O3in the scenario II increase,compared to the scenario I.This can be shown through the depth distributions of both generated O3and lost O3in the scenarios I and II,as shown in figure 8.From figure 8(a),at depths below about 2 μm the concentration of O3generated in the scenario I is larger than that in the scenario II,but above 2 μm the reverse is true.Hence,O3s generated in the two scenarios are close to each other in spite of a deeper penetration in the scenario II.However,as can be seen in figure 8(b),there is an evident decrease of O3loss in the concentration in the scenario II in comparison with the scenario I.Accordingly,it is O3loss that leads to the increase of O3in both the penetration depth and the concentration.The decrease of O3loss can be attributed to the reaction of dominating O3loss,i.e.O2?+O3→O3?+O2because of the aforementioned decrease of?O2in the scenario II.
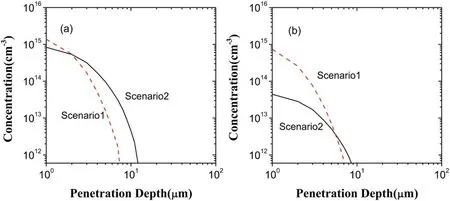
Figure 8.Depth distributions of O3 in the liquid region in the scenarios I and II:(a)generated O3,(b)lost O3.
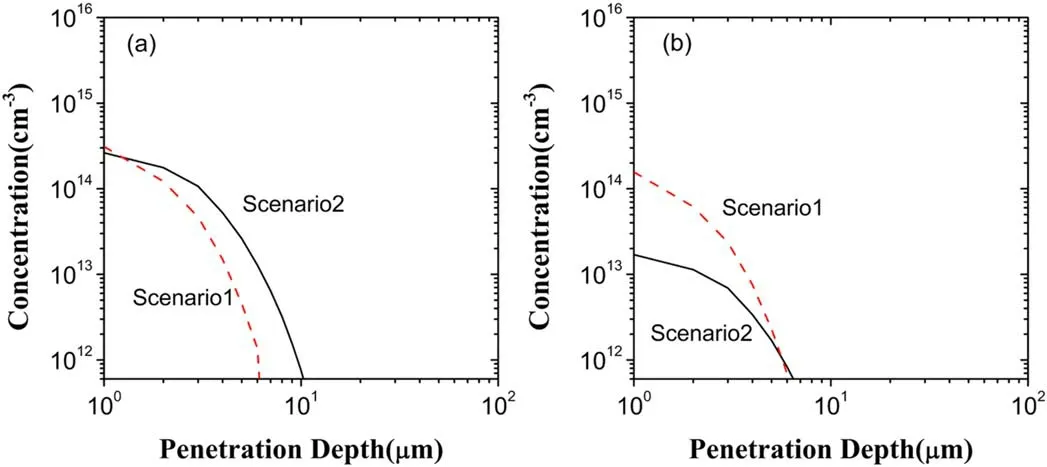
Figure 9.Depth distributions of OH in the liquid region in the scenarios I and II:(a)generated OH,(b)lost OH.
The differences between the depth distributions of both generated OH and lost OH in the two scenarios can be observed from figure 9 and are similar to figure 8,which induces the increase of OH in both the penetration depth and the concentration due to the electron exclusion,as shown by figure 4.From figures 5 and 6,OH generation depends mainly on two reactions O3+H2O2→OH+HO2+O2andO3?+H+→O2+OH in the two scenarios.However,in the scenario II the respective contributions of these two reactions to OH generation become 44.76% and 41.96%,a total 86.72%,rather than 10.97%and 70.61%in the scenario I,a total 81.58%.In spite of a small difference between the both total contributions,the contribution of O3+H2O2→OH+HO2+O2increases from 10.97% in the scenario I up to 44.76% in the scenario II.Because of this and considering the increase of O3shown above,OH generation increases in the scenario II,compared to the scenario I.On the other hand,the reaction of dominating OH loss is OH+O2?→OH?+O2in the two scenarios with the contributions of 83.94% and 79.18%,respectively.This dominant reaction plus?O2decreased evidently in the scenario II results in a significant decrease of OH loss in figure 9(b).
Going back to figure 4,HO2decrease evidently in the penetration depth and in the concentration due to the electron exclusion.This is because HO2generation decreases and its loss increases,as presented in figure 10.From figures 5 and 6,in the scenarios I and II,reactionO2?+H+→HO2dominates HO2generation,having the contributions of 99.36% and 99.69%,respectively.Due to this as well as the considerable decease of O2?in the scenario II shown in fgiure 10(a),HO2generation is much lower than that in the scenario I.In addition,the reaction of dominating HO2loss is HO2→O2?+H+in the scenario I,but in the scenario II it becomes HO2+OH→H2O+O2,HO2+O3→O2+HO3,HO2→H++?O2and HO2+?O2→O2+?HO2with the contributions of 22.89%,4.4%,65.24%,and 6.58%,respectively.Specifically,at depths below 13 μm HO2loss is mainly induced by reactions HO2+OH→H2O+O2and HO2+O3→O2+HO3because of the existence of OH and O3,presenting increase of HO2loss due to the increase of OH and O3.Above 13 μm,there are no OH and O3,and thus HO2loss is from the reactions HO2→H++O2?and HO2+O2?→O2+HO2?.
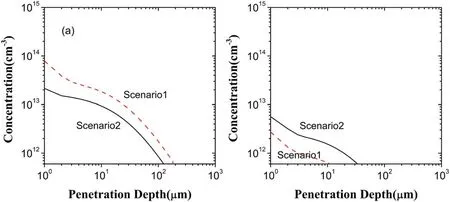
Figure 10.Depth distributions of HO2 in the liquid region in the scenarios I and II:(a)generated HO2,(b)lost HO2.
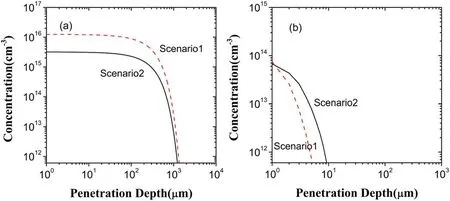
Figure 11.Depth distributions of H2O2 in the liquid region in the scenarios I and II:(a)generated H2O2,(b)lost H2O2.
According to figure 4,the electron exclusion leads to a concentration of H2O2being about one order of magnitude lower than that in the scenario I.This is due to the fact that,compared to the scenario I,H2O2generation decreases and its loss increases in the case of the electron exclusion,as displayed in figure 11.In generating H2O2in the scenario II,there are three dominant reactions,i.e.2OH→H2O2,HO2?+H2O→H2O2+OH?,and O(1D)+H2O→H2O2.They are of the contributions of 52.24%,18.16%,and 17.08%,respectively.In these three reactions,the contribution of O(1D)+H2O→H2O2is hardly changed due to O(1D)resulting mainly from the gas region,2OH→H2O2has a contribution larger than in the scenario I because of the increase of OH in the scenario II,and the contribution ofHO2?+H2O→H2O2+OH?gets less,which is caused by the reaction e+HO2→?
HO2almost eliminated by the electron exclusion.Accordingly,the decrease of H2O2generation may be mainly ascribed to the direct effect of the electron exclusion.For H2O2loss in the scenario II,the main reactions are O3+H2O2→OH+HO2+O2and HO2+H2O2→OH+O2+H2O with the respective contributions of 67.01% and 31.49%.Due to the increase of both OH and O3shown above,H2O2loss increases and this increase only occurs within the penetration depth of OH and O3.By reason of this,in the liquid region,there are no the other reaction pathways to consume H2O2at deeper depth.Consequently,H2O2can reach the same depth as in the scenario I.
3.2.Depth distributions of the five ROSs in the scenario III
After having a detailed analysis on the depth distributions of the five ROSs in the scenarios I and II and clarifying the mechanisms governing the differences between the distributions of each ROS in the two scenarios,the focus in the scenario III will be again placed on these ROSs in the liquid region.As shown earlier,in the scenario III only the electrons are considered to enter into the liquid region,and the initial fluxes of the other plasma species are set to zero.Accordingly,in the scenario III the reactive species involved are less,and the reaction system is relatively simple.
Figure 12 shows the depth distributions of H2O2,OH,O2?,HO2and O3in the scenario III.As can be seen from figure 12,OH,O3,and HO2present both a very small penetration depth and a low concentration,and?O2is of the concentration about 3-4 times larger than in the scenario I in spite of its distribution range close to the scenario I.Specifically,the distribution of H2O2is almost the same as in the scenario I.This is of great interest because it is shown that the vast majority of H2O2result from a series of the reactions related to electrons.The probable reaction chains can be described as follows.One chain:e+H2O→H+OH?generates OH,followed directly by 2OH→H2O2and thus generating H2O2H2O2; another chain:e+O2→?O2generatesO2?,and throughO2?+H2O→HO2+OH?followed by HO2+HO2→H2O2+O2or by e+HO2→HO2?andHO2?+H2O→H2O2+OH?,H2O2is produced.
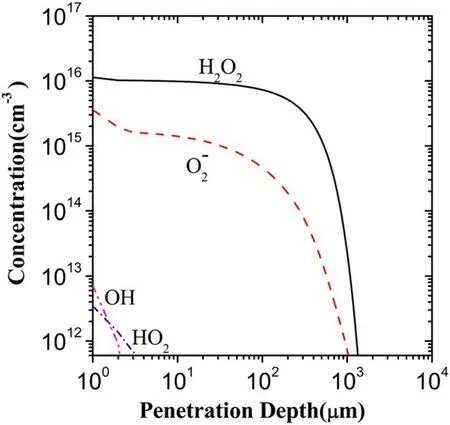
Figure 12.Depth distributions of the five major ROSs in the liquid region in the scenario III.
3.3.Electron-species synergy effect on the mass transfer
In fact,the effect of the electrons on the mass transfer of plasma species can also be described as a synergy effect of the electrons and the other species on the mass transfer because the generation and loss of a reactive species in the liquid region correlate with the complex interactions between the electrons and the other species.Hereafter,the synergy of the electrons and the other species is called the electron-species synergy for simplicity.To probe the electron-species synergy effects or the role of the electrons in the mass transfer of plasma species,the respective superposition of the depth distributions of the five major ROSs after 60 s of plasma treatment in the liquid region in the scenarios II and III are implemented and are presented in figure 13(b).This superposition is denoted by the scenario II+III.In addition,the depth distributions of the five major ROSs in the scenario I are again displayed via figure 13(a)for the purpose of comparison.
From figures 12 and 13(b),comparing the depth distribution of H2O2in the scenario III with that in the scenario II+III,it can be seen clearly that both distributions are nearly the same,thus showing that the electrons contribute to almost entire H2O2in the superposition.Further,it is also clear from figures 13(a)and(b)that the depth distribution of H2O2in the scenario II+III is very close to that in the scenario I.Accordingly,it is shown that the electrons dominate the generation of H2O2in the mass transfer of plasma species in the liquid region.More recently,the theoretical simulation[31]has also showed the dominant role of the electrons in the generation of H2O2in the mass transfer.Very recently,in the experimental study[35]where the amounts of various reactive species in the plasma-activated media exposed by a microwave-excited atmospheric pressure argon plasma jet were estimated using colorimetric methods,the generation of H2O2was actually attributed to the result induced by electrons via dissociative electron attachment to the water molecule and electron-ion dissociative recombination,which show an agreement with the present simulation,but at the same time,the important role of O and O3O was also pointed out in producing the gaseous H2O2.
As forO2?,its depth distribution in the scenario II+III is nearly the same as in the scenario III,as can be observed from figures 13(b)and 12.This similarly shows the dominant role of the electrons in the contribution to?O2in the superposition.However,as shown in figures 13(a)and(b),the concentration of?O2in the scenario II+III is,on average,about 3-4 times larger than that in the scenario I,in spite of the distribution ranges in the two scenarios being close to each other.This sheds light the electron-species synergy effect on the generation of?O2in the mass transfer,namely,the electron-species synergy evidently weakens the generation of?O2in the liquid region,compared to the scenario III.
As indicated by the comparison between the depth distributions of HO2in the scenario II+III and in the scenario III from figures 12 and 13(b),electrons in the plasma species have only a very small contribution to HO2in the superposition.But,compared to figures 13(a),(b)shows the depth distribution of HO2in the scenario II+III with a concentration and a distribution range about two times lower than in the scenario I,showing that the electron-species synergy evidently promotes the generation of HO2in contrast with the scenario III.
Considering O3and OH,in analogy with HO2,the contributions of the electrons to O3and OH are very small in the superposition and occur in the surface layer of the liquid region.But,the electrons together with the other species exert a synergistic action on O3and OH opposite to that on HO2in the scenario I,namely the electron-species synergy evidently weakens the generations of O3and OH,leading to the distribution with a low concentration and a small range in the liquid region.
Here,it should be pointed out that in the scenarios II and III,the significant charging of liquid will be induced due to the charge imbalance.Accordingly,the electric filed can be created and impacts the transport of charged species.
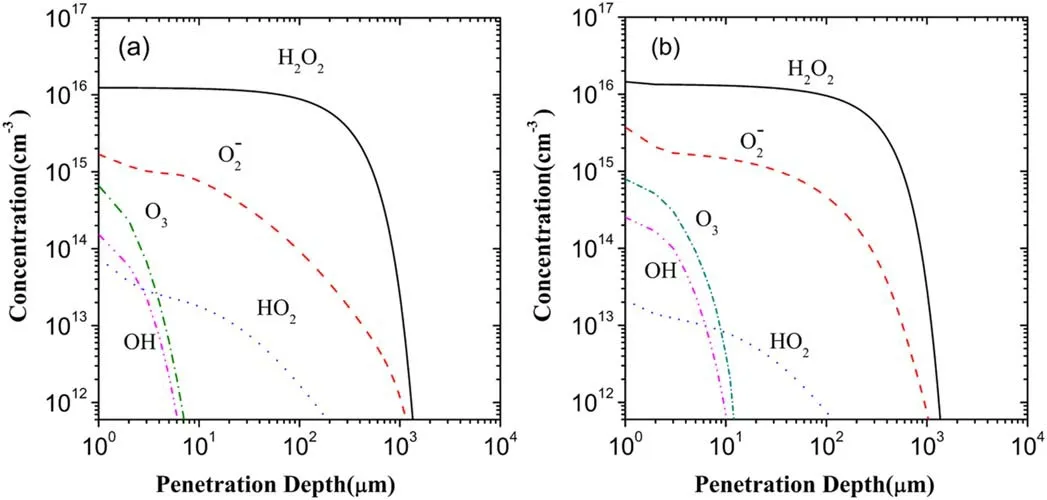
Figure 13.Depth distributions of the five major ROSs in the scenarios I(a)and II+III(b)in the liquid region.
4.Conclusions
This work carried out an investigation on the effects of electrons on the mass transfer of the ROSs in aqueous solution by means of a systematical numerical simulation based on a one-dimensional diffusion-reaction model.The depth distributions of the five major reactive species,O3,O2?,OH,HO2,and H2O2,have been calculated in the three scenarios.The differences between the depth distributions of each ROS in these three scenarios have been analyzed in detail.The present work shows that the electrons play an important role in the mass transfer of reactive species in aqueous solution and also reveals the electron-species synergy effects.
The vast majority of H2O2result from a series of the electron-related reactions in aqueous solution,and thus the generation and transport of H2O2in the mass transfer are hardly affected by the electron-species synergy.The electron-species synergy evidently weakens the effect of the electrons on the generation of?O2in the liquid region in comparison with that when only considering the electrons to enter into the liquid region.The electrons,in their mass transfer in the liquid region,only slightly influence the generation of HO2,but the electronspecies synergy significantly promotes the generation of HO2in the liquid region.In addition,the electrons together with the other species exert a synergistic action on both O3and OH,evidently weakening the generations of O3and OH in the liquid region,compared to only action of the electrons.
Acknowledgments
This work was supported by the Fundamental Research Funds of Shandong University(2018TB037).
 Plasma Science and Technology2020年11期
- Plasma Science and Technology的其它文章
- The effect of resonant magnetic perturbation with different poloidal mode numbers on peeling-ballooning modes
- Soft landing of runaway currents by ohmic field in J-TEXT tokamak
- Numerical simulations of the wavefront distortion of inter-spacecraft laser beams caused by solar wind and magnetospheric plasmas
- Effect of insulating oil covering electrodes on the characteristics of a dielectric barrier discharge
- Numerical study on the modulation of THz wave propagation by collisional microplasma photonic crystal
- Study of partial discharge characteristics in HFO-1234ze(E)/N2 mixtures
