Power absorption,plasma parameters and wave structure in inductive RF plasma source with low value external magnetic field
Physical Electronics Department,Faculty of Physics,Lomonosov Moscow State University,Moscow 119991,Russia
Abstract
Keywords:radio-frequency,plasma,helicon,Trivelpiece-Gould waves,inductive discharge
1.Introduction
The low-pressure radio-frequency(RF)inductive discharge located in an external magnetic field is an important part of numerous ground and space technologies.Due to its ability to generate high-density plasma with relatively low RF power input,this type of discharge has found applications in plasma reactors for etching in the semiconductor industry,as the active medium of electric propulsion engines for spacecraft[1-3],in the processes of surface modification[4-6],and deposition of coatings with ion assistance[7-31].
RF inductive discharge with an external magnetic field is of great interest not only from the applied point of view.To date,an enormous number of papers[1-37]have been accumulated in the literature on the studies of the fundamental properties of the discharge.The effect of a significant rise of electron density in RF inductive discharge under external magnetic fields about 1000 Gs was discovered by R Boswell in the 1970s.His first papers[1-3]were followed by many works[4-44]conducted in laboratories all over the world.
Modern ideas about physical properties of the discharge,which is usually called in literature a helicon one,can be briefly characterized as follows.
Under conditions when the inequality ωLi?ω ?Ωc?ωLeis satisfied(ωLeand ωLiare the electron and ion plasma frequencies respectively,and Ωcis electron cyclotron frequency),two waves,i.e.helicon and Trivelpiece-Gould(TG)waves can be resonantly excited in a limited plasma volume.The helicon azimuthal component of the RF electric field substantially exceeds the longitudinal one,while for the TG wave,on the contrary,the longitudinal component of the RF electric field significantly exceeds the azimuthal one.Calculations show that the absorption of RF power in the discharge at low pressures(less than 133 mPa),weak external magnetic fields(less than 200 Gs)and relatively low plasma densities(less than 1012cm-3)occurs due to Cherenkov’s mechanism of TG wave damping[19-23].A considerable number of studies on helicon discharges consider the values of an external magnetic field induction of 500-1,000 Gs and RF power values of about 1 kW.In this case,the concentration of electrons reaches values of about 3×1012cm?3,while the frequency of electron-ion collisions exceeds the value of kνTe,which characterizes the collisionless absorption(here k is the wave number and νTeis the thermal velocity of the electrons).An increase in the number of electron-atom or electron-ion collisions with an increase in pressure or plasma density leads to a decrease in the role of the TG wave[6,7,23,39].This is due to the fact that under conditions typical for helicon experiments,the TG wave is strongly absorbed and attenuates rapidly as it propagates from the boundaries into the depth of the plasma.At the same time,helicons penetrate well into the bulk of the plasma and damps due to the collisional mechanism.
The papers[24-33]studied the properties of the discharge in the region of low(up to 100 Gs)external magnetic fields.It was found that in some cases the efficiency of the RF power input(characterized by equivalent plasma resistance)had a local maximum at external magnetic fields of about 30 Gs.The nature of the local maximum in[23,25-27]is associated with the excitation of a TG wave,which under these conditions is capable of penetrating deep into the plasma[23,39].
It is worth underlining that in general,it is not easy to define the nature of excited waves based only on the measurements of RF magnetic field components,especially in the case when partially standing waves are excited in a plasma source.The reason is that the experimentally measured values of RF fields are the superposition of both helicon and TG wave fields.In order to obtain more physical information from experiments,researchers use theoretical models,numerical calculations and indirect measurements such as discharge mode transition,peculiarities of the RF coupling efficiency,etc.For instance,in[43],time-resolved measurements of an edge-to-core power transition in the high-density light-ion helicon discharge were carried out.The authors obtained direct evidence that the slow wave was suppressed in favor of the fast wave that was responsible for power coupling in the on-axis region.However,the authors of[43]mentioned that the physical mechanism that drove the edge-to-core transition was not fully understood yet.Later,based on the self-consistent helicon discharge model,it was shown in[44]that in the first time phase,the surface source flux by the TG wave power absorption formed the surface localized density profile.In the second time phase,the centrally peaked density profile is formed by the core source flux by the helicon wave power absorption,while the surface source flux is balanced with the loss flux toward the wall and that results in the centrally peaked density profile at the steady-state.Thus,at the stationary state of the inductive discharge with a high magnetic field and high electron density,helicon waves can be considered as the waves responsible for power coupling in the near-axis parts of the discharge.On the contrary,at relatively low electron density(below 3×1011cm?3),a TG wave can be a volumetric one and can contribute to the RF power absorption not only near the edge,but near the axis of the plasma source,too[44].
In the present work,we attempt to detect the TG wave excitation on the basis of comparative analysis of the axial distributions of RF magnetic field components.
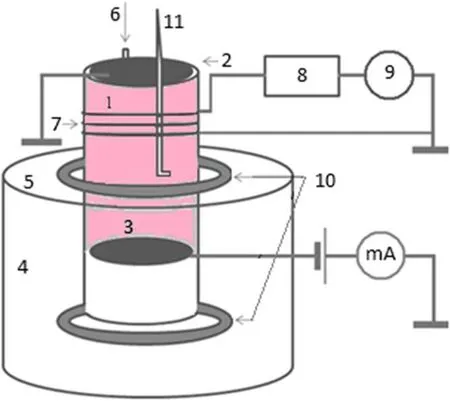
Figure 1.Scheme of experimental facility.1-quartz gas-discharge chamber,2-metal grounded flange,3-movable metal electrode,4-vacuum chamber,5-upper metal flange,6-gas drive,7-spiral antenna,8-RF matching system,9-RF power supply,10-magnetic system,11-magnetic probe.
2.Experimental procedure
2.1.The scheme of the experimental facility
The scheme of the experimental facility is shown in figure 1.The plasma source(PS)consists of the quartz cylinder 1 with a diameter of 20 and a height of 42 cm.The top end of the PS is covered with the metal grounded flange 2.The movable metal electrode 3 is located downstream and limits the length of the PS.Three PS lengths,i.e.52,32 and 22 cm were investigated.
The PS is mounted on a metal vacuum chamber 4 with a diameter of 60 and a height of 36 cm.The bottom part of the quartz cylinder is located 12 cm below the upper metal flange 5 of the vacuum chamber.In some experiments the flange 3 was removed and the discharge was limited from below by the bottom flange of the vacuum chamber.In this case the length of the discharge was 52 cm.
The vacuum chamber is pumped out by the rotary pump DRP-1300 and the turbomolecular pump KYKY FF-250/2000E.Residual pressure in the chamber was not worse than 1.3 mPa.Argon was supplied with a gas drive 6.
The RF power input unit is represented by a cooled threeturn spiral antenna 7 located around the gas-discharge chamber at a distance of 8-12 cm from the upper end of the PS.The antenna is made of a hollow copper tube 3 mm in diameter.It is cooled with distilled water at a temperature of 20°C.
The antenna is connected to the RF power source through an automatic matching system 8.RF power supply YSR-10AF(denoted by 9)with an operating frequency of 13.56 MHz and variable power in the range of 0-1000 W is used for the discharge ignition and sustaining.
The PS magnetic system 10 consists of two electromagnets:the first one is located on the flange 5 of the vacuum chamber; the second electromagnet is located on the bottom of the vacuum chamber.The selected configuration of the magnets provides the external magnetic field configuration shown in figure 2.The range of variation of the external magnetic field induction in the region of antenna is 10-65 Gs.In the upper part of the plasma source the external magnetic field is weakly divergent(see figure 2).
The components of RF magnetic field were m?easured using a
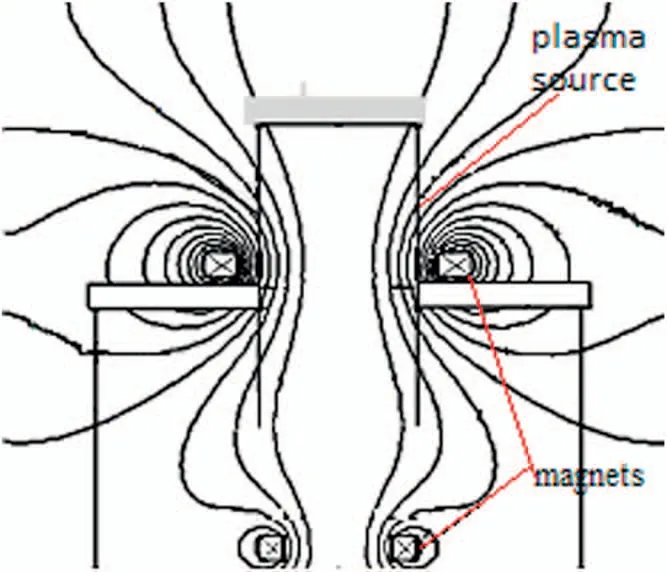
Figure 2.External magnetic field lines on the plasma source crosssection.

Figure 3.Circuit of magnetic probe.1-coil,2-copper tube,3-RF transformer 1:1,4-coaxial cable,5-glass insulation case.
2.2.RF magnetic field measurements
movable L-shaped B-dot probe 11(see figures 1 and 3).The B-dot probe is represented by a small inductor,consisting of 10-15 wire turns in a glass insulation case.At the output from the inductor,the wires were intertwined and passed through a 5 mm copper tube,through which the signal wire was led out from the PS.The probe was introduced to PS through the process port on the top metal flange of quartz cylinder 2.The longitudinal component of the magnetic field Bzwas measured along the PS axis and radius.The radial Brand azimuthal Bφcomponents of the magnetic field were measured only along the PS axis at the distance 5 cm from the PS axis.
All magnetic probes were balanced with a 1:1 transformer on a ferrite core to eliminate RF interferences(see figure 3).In[40,41],it was shown that Bzmeasurements performed with balanced magnetic probes were sufficiently more accurate and showed wave structure more precisely.
Calibration measurements without a discharge were performed to verify the accuracy of the measurements with magnetic probes.Also,computer modelling of the RF magnetic field components distribution in the PS in the absence of a discharge was made using the soft KARAT[7,12,13].The simulated curves were compared with experimental data obtained by the magnetic probe along a radius at a distance of 8 cm from the top flange 2.The considered region is located near the RF antenna.It can be seen from figure 4 that agreement between calculated and measured data is satisfactory.Thus,we can conclude that the magnetic probe method is applicable for measuring components of the RF magnetic field.
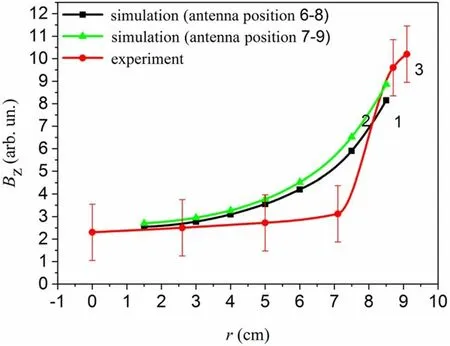
Figure 4.Radial distribution of Bz measured without discharge at a distance of 8 cm from the upper flange and simulated under the same conditions using KARAT program:(1)simulation,antenna is located at a distance z of 6-8 cm from the upper flange;(2)simulation,antenna is located at a distance z of 7-9 cm from the upper flange;(3)experiment.
2.3.Estimation of the RF power absorption efficiency
About 30 years ago,it was shown in a number of experimental works stimulated by the papers of V Godyak[45-47]that the power value absorbed by plasma Pplwas not equal to the power of the RF power generator Pgendue to the power losses in the external circuit of a RF generator.In order to characterize the ability of plasma to absorb RF power quantitively the concept of equivalent plasma resistance Rplwas proposed in[22].
Let us consider the expression for RF power value coupled to plasma[11]:

where Eφ,Er,Ezare azimuthal,radial and longitudinal components of the RF electric field in plasma;ε″⊥,ε″∣∣andg″are the imaginary parts of the components of the plasma permittivity tensor.The integration is across the entire plasma volume.
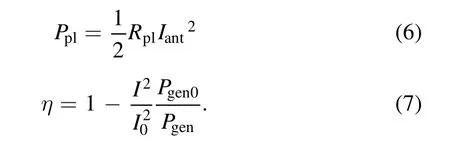
The origin of the RF fields in a plasma of the inductive RF discharge is the current flowing through antenna Iant.It means that all components of RF electric field are proportional to the antenna current amplitude.Thus,power Pplabsorbed by plasma is defined by a square of the current flowing through antenna Iant,and multiplier Rpl,having dimensionality of resistance,i.e.:

It is worth noting that equations(1)and(2)reveal the physical meaning of Rplas a value characterizing the ability of plasma to absorb RF power.The fundamental properties of the Rplwere studied in detail in[21-23].
Having in mind that the power Pgenof RF generator is coupled not only to plasma but to the external load,having the resistance Rant,the expression for the power balance in the RF generator external circuit takes the form:

The comparison of the expression(3)with that obtained on the basis of RF inductive discharge equivalent transformer circuit[45-47]shows their similarity.The difference in the present approach from that of[46]is that Rplvalues can be determined theoretically not from qualitative considerations,as in[46],but from a rigorous electrodynamic consideration.Experimental procedures of Ppldetermination proposed in the present paper and[46]are the same.The procedure of measurements is simple because it is necessary to measure external discharge parameters;there is no need to measure the current induced in plasma.
The experimental procedure of Rpland Ppldetermining is as follows.
First the antenna resistance must be determined using equation(3)based on the Pgen0and Iant0values measured without discharge:

As a rule,in our experiments the dependence of antenna current on Pgenwithout discharge was linear within 3%at the absence of reflected power.The presence of reflected power led to the increase of the error until 10%.
Then the equivalent plasma resistance can be determined using equation(3)based on Rantand Pgen,Iantvalues measured under current discharge conditions:
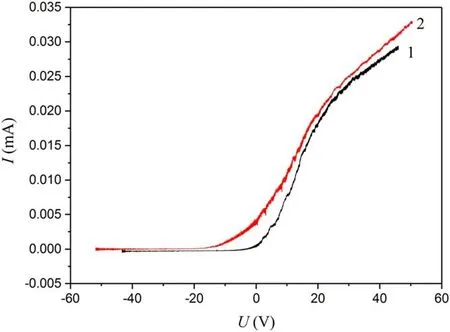
Figure 5.Typical current-voltage characteristic.125 mPa,RF power 200 W.1-measurement with resonant filter,2-measurement without resonant filter

The power absorbed by the plasma and power absorption efficiency η=Ppl/Pgencan be calculated using the formulas:
2.4.Langmuir probe method of plasma parameters determination
Langmuir probe was used to measure the electron temperature and density as well as plasma potential along the axis of the plasma source.The probe consisted of tungsten wire with a diameter of 0.6 mm with a probe tip length of 7 mm.The movable L-shaped probe was introduced into the discharge through the same process port in the top flange of the PS as the magnetic probe.The grounded flange was used as a reference electrode.To suppress the RF components of the probe current a resonant filter was used.This was the rejection filter that had high resistance on the first and second harmonics of the operating frequency.Figure 5 illustrates the influence of the filter at the measured probe current-voltage characteristics.They were received and recorded using an ADC connected to a computer.
However,in the present research work the induction of an external magnetic fields was less or equal to 65 Gs.In such a case,the Larmor radius of electrons with energy equal to or higher than 1 eV is at least 10 times larger than the Debye length.This means that under the conditions of our experiments,the distortions of the probe characteristics by magnetic field can be neglected.To confirm this conclusion,we compared the probe characteristics measured when the probe was oriented along the magnetic field and perpendicular to it.The obtained result,shown in figure 6,allowed us to use Langmuir probe method without corrections.
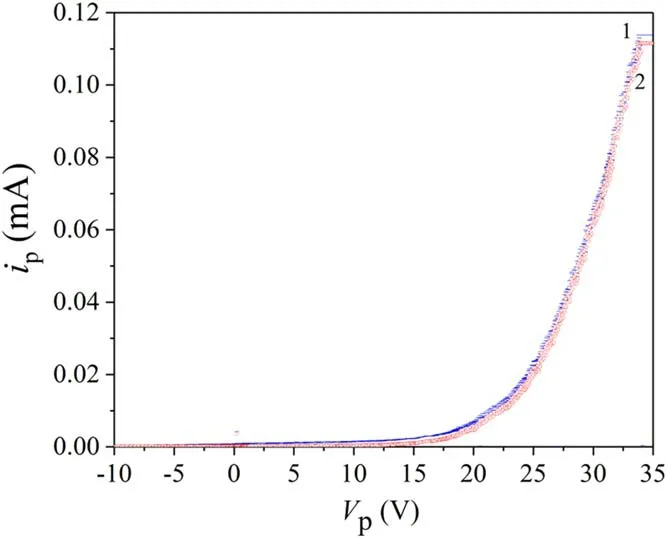
Figure 6.The probe characteristics measured when the probe was oriented along the magnetic field(1,blue curve)and perpendicular to it(2,red curve).Argon pressure is 90 mPa.RF power is 800 W,external magnetic field value is 65 Gs,z coordinate is 14 cm.
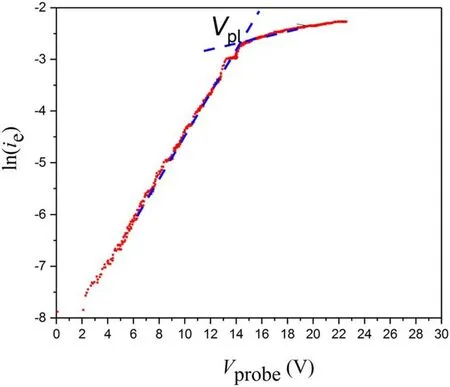
Figure 7.Typical current-voltage characteristic argon pressure is 90 mPa,RF power is 800 W,external magnetic field value is 36 Gs.
The standard procedure for processing probe curves was used to calculate parameters of a quasi-neutral plasma(the Debye length,which is about 0.003 cm,is much less than characteristic scales of plasma).First,the electron current iewas separated from the total probe current ipassuming that the dependence of ion current iion probe potential Vpwas linear:

Then the electron current-voltage curve ie(Vp)was used for defining main plasma parameters:plasma potential,electron temperature and electron density.Figure 7 shows that the semilog dependence of ieon Vpwas nearly linear,i.e.the electron energy distribution function(EEDF)was close to a Maxwellian one.In this case the following formula is valid:

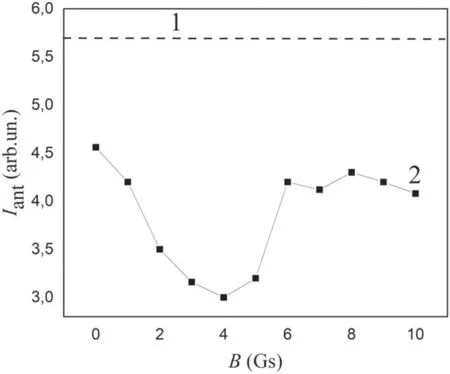
Figure 8.Antenna current versus external magnetic field induction.Pgen=300 W,argon pressure is 14.7 mPa.1-antenna current without discharge,2-antenna current with discharge.
and electron temperature is defined by the expression:

Here k is the Boltzmann constant,e is electron charge,Teis electron temperature,Vplis plasma potential andie0is electron current measured at Vp=Vpl.
The electron densitynewas calculated by the formula:

after determination of the plasma potential Vplas an intersection point of two lines as shown in figure 7.
In formula(11)S is the area of the probe tip surface,and m is the electron mass.
The measurements were carried out in argon in the pressure range of 13-140 mPa at values of external magnetic field from 10 to 65 Gs,and the power of the RF power supply in the range of 200-800 W.
3.Experimental results
3.1.RF power absorption efficiency
Experiments showed that variation of the external magnetic field induction B caused the significant change of antenna current(see figure 8).At all considered B and fixed Pgenthe antenna current values,measured under conditions that the discharge was on,were less than in the case when the discharge was off.That means that absorption of RF power by plasma took place in our experiments(see formula(3)).Moreover,the existence of a local minimum of Iant(B)shows that the power absorption efficiency η non-monotonically depends on B(see formula(7)).
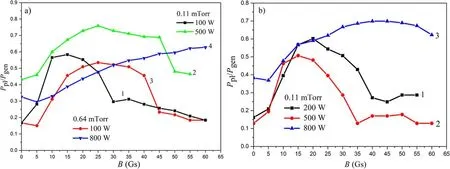
Figure 9.RF power absorption efficiency versus the external magnetic field induction.Plasma source(a)L=22 cm:(1)argon pressure 14.7 mPa,Pgen=100 W;(2)argon pressure 14.7 mPa,Pgen=500 W;(3)argon pressure 85.3 mPa,Pgen=100 W;(4)argon pressure 85.3 mPa,Pgen=800 W.Plasma source(b)L=52 cm:(1)argon pressure 14.7 mPa,Pgen=200 W;(2)argon pressure 14.7 mPa,Pgen=500 W;(3)argon pressure 14.7 mPa,Pgen=800 W.
Figure 9 shows the RF power absorption efficiency η=Ppl/Pgenversus the external magnetic field induction B measured under different experimental conditions in the PS 22(figure 9(a))and 52 cm long(figure 9(b)).Similar to[10,11]the non-monotonous dependence of η was observed in the experiments with all considered plasma sources.
In the case of the PS with a length 22 cm at a pressure 13.3 mPa there is a maximum of η(B)in the range of external magnetic fields 12-28 Gs.The increase of Pgenas well as an argon pressure pArshifts the maximum position to the region of higher magnetic fields.In addition,the peak becomes broader.The increase of Pgenleads to the growth of RF power absorption efficiency.At the maximal value of the considered powers from the RF power supply(800 W)η reaches 0.85.At the RF generator power of 800 W and pressure 85.3 mPa the position of the η peak shifts to the region of external magnetic fields that exceed the maximal B values considered in this work.
The results obtained for the PS with a length 52 cm qualitatively coincide with that obtained with short PS.However,the absolute values of η are lower.
3.2.RF fields structure
It was supposed that the observed increase of the plasma absorption efficiency was the result of the resonant excitation of waves in the PS.To check the supposition,the spatial distributions of RF magnetic field components were measured with the help of a B-dot probe.
Let us consider figure 10 where the axial variations of RF longitudinal magnetic field amplitude Bz(z)(figures 10(a)and(b))and phase φ(z)(figures 10(c)and(d))are represented.At B=20 Gs Bzand φ do not noticeably change with z within experimental error.At B=28 Gs the amplitude of Bzgrows.It peaks in the vicinity of antenna location,then decreases with z and finally exhibits local maximum at z~28 cm.The phase variation indicates the appearance of partially propagating wave downstream antenna.The growth of B up to 36 Gs results in the formation of the partially standing wave with the half wavelength close to 8 cm.Further increase of the external magnetic field leads to the decrease of the local maxima number.The increase of the argon pressure up to 13.3 mPa leads to the shift of the magnetic field where the formation of the partially standing wave is observed to B=48 Gs.It is worth remembering that the same trend was found in experiments devoted to the study of the RF power absorption efficiency.
Subsequent experiments were aimed at a more careful study of the wave structure arising at the external magnetic field equal to 36 Gs and higher.Figure 11(a)shows the axial distributions of all three components of the RF magnetic field measured at B=40 Gs normalized for the maximal value of their amplitudes.The axial distributions of the azimuthal magnetic field Bφand longitudinal one Bzare close to each other.However,the positions of local Bφ(z)maxima and minima are shifted relative to the field extrema of Bz(z),so that the positions of the Bφ(z)maxima coincide with the Bz(z)minima,and the positions of Bφ(z)minima coincide with the positions of Bz(z)maxima.The same effect is typical for all considered lengths of PS(see figure 12).
Experiments showed that at B=36 Gs the axial distribution of the RF radial magnetic field Br(z)differed drastically from the Bz(z)and Bφ(z)ones.The axial dependence of Brhas only one maximum contrary to three maxima of Bz.The position of Brpeak weakly depends on the external magnetic field value.However,due to the strong dependence of Bz(z)on B,the axial dependencies of the functions Bz(z)and Br(z)become similar at external magnetic field equal to 60 Gs(see figure 11(b)).The shift of Bz(z)peak position relative to Br(z)was earlier observed in[3]under conditions of helicon waves excitation.
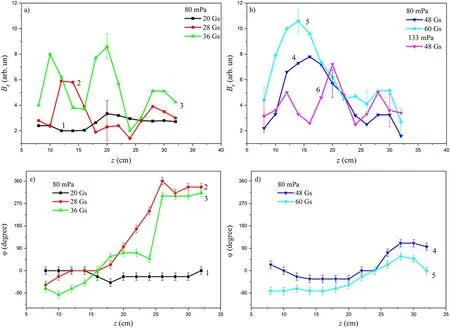
Figure 10.Axial distributions of amplitude(a),(b)and phase(c),(d)of Bz component for different values of external magnetic field.PS length is 32 cm.Argon pressure 80 mPa:(1)20 Gs;(2)28 Gs;(3)36 Gs;(4)48 Gs;(5)60 Gs.Argon pressure 133 mPa:(6)48 Gs.
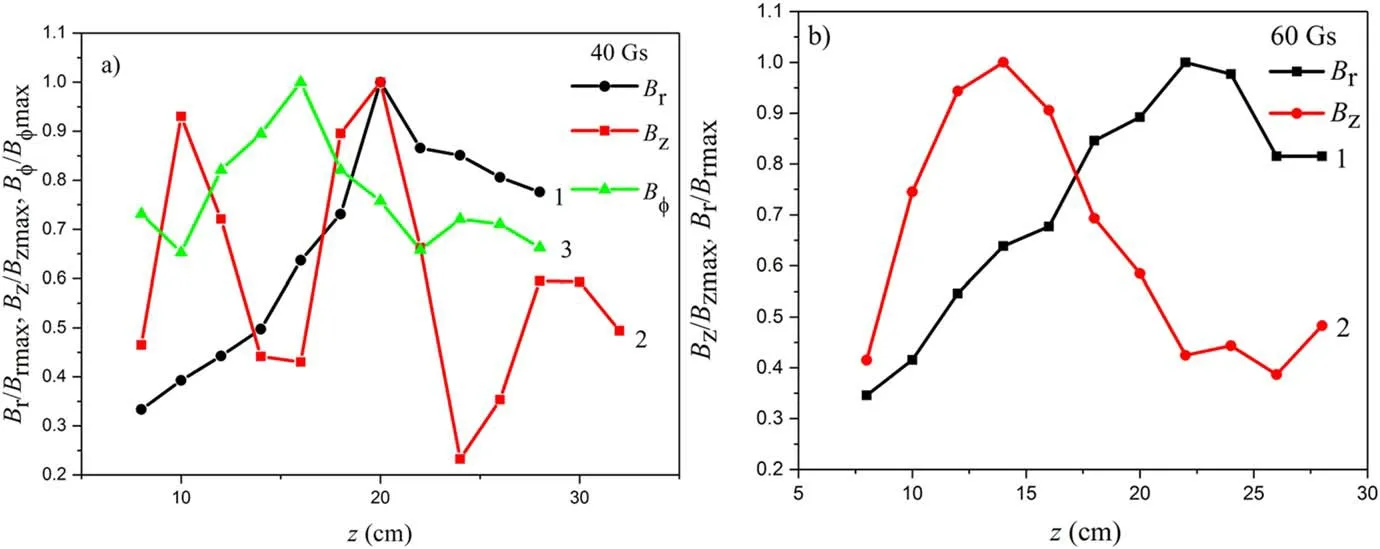
Figure 11.Axial distribution of components of RF magnetic field:(1)Br;(2)Bz;(3)Bφ.External magnetic field of 40(a)and 60 Gs(b);RF power 800 W,argon pressure 86.6 mPa.
Figure 13 shows the radial distributions of the Bzfield measured at various distances from the upper flange of the PS.Near the antenna,the RF field does not penetrate into the bulk of plasma in all considered cases.In the central part of the PS(z=16 cm)at external magnetic fields exceeding 20 Gs,confirming the fact of waves excitation in the bulk of plasma downstream antenna,the amplitude of the axial component of the RF magnetic field peaks on the PS axis.The larger the external magnetic field,the smaller the area near the axis where Bzis localized.Near the movable lower flange of PS the dependence Bz(r)becomes more complicated.At B>36 Gs the maximum of RF field amplitude Bzshifts to the middle of the radius.
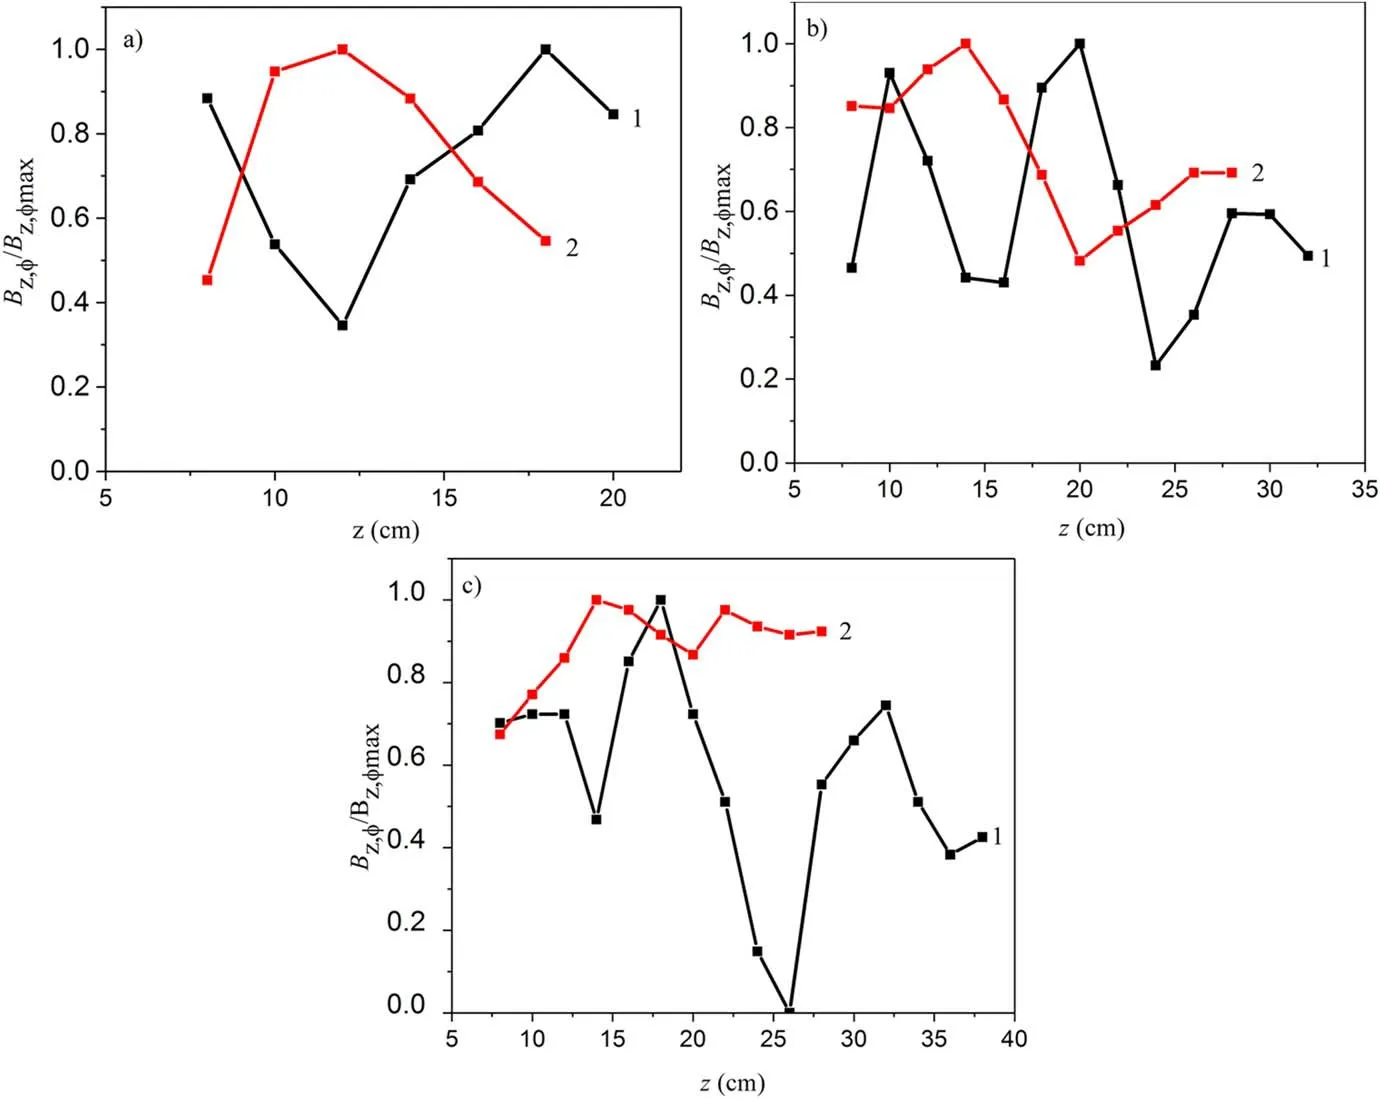
Figure 12.Dependence of the amplitude of Bz(1)and Bφ(2)on the axial coordinate for the PS with length of 20(a),32(b)and 52 cm(c).Induction of the external magnetic field is 36 Gs.The power of the RF generator is 800 W.The pressure of argon is 90.6 mPa.
3.3.Plasma parameters
Figure 14 represents the axial distribution of the electron density nein a PS with the length 22 cm.Electron density peaks with external magnetic field value that corresponds to the maximal RF input to discharge(B=28 Gs).Here the axial distribution of plasma density becomes more uniform.An increase of B above 28 Gs leads to a decrease in the plasma concentration in the entire volume of the PS.In addition,the area of plasma uniformity narrows.
The axial distribution of the electron density correlates with the distributions of the plasma potential Vpl(z)and electron temperature Te(z)on the PS axis(see figure 15).The plasma potential uniformity improves when B approaches 28 Gs.At B>28 Gs plasma potential grows and a bellshaped distribution Vpl(z)is formed with a maximum in the central part of the PS axis.The growth of the plasma potential is associated with an increase in the electron temperature(see figure 16).In this case it should be noted that the electron temperature within the experimental error does not depend on the z coordinate in the main plasma volume.Here Tevalues belong to the range of 2-4 eV.The smallest values of electron temperature are observed under conditions of the best RF power input.Near the bottom flange at about 2 cm above it,there is an increase in the electron temperature by 1-2 eV.
The results obtained in experiments with the PS 32 and 52 cm in length were in qualitative agreement with that described above.The absolute values of electron density measured at a fixed power of the RF power supply decrease with the growth of PS length(see figure 17).
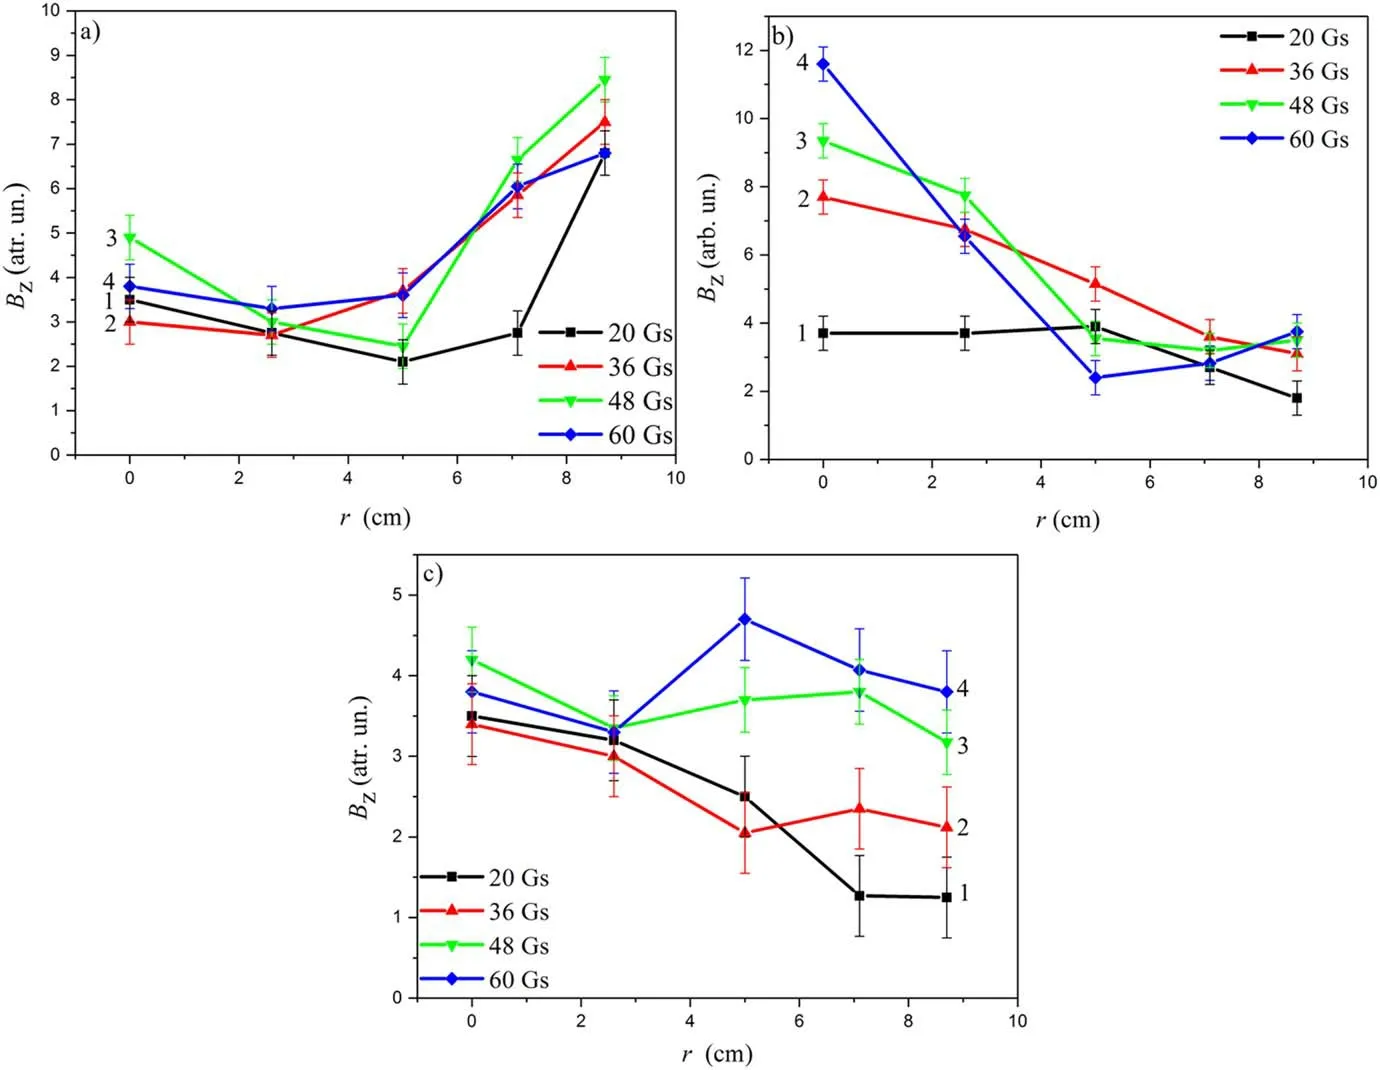
Figure 13.Radial dependence of the longitudinal component amplitude of RF magnetic field at axial coordinate z=8 cm(a);z=16 cm(b);z=22 cm(c).The external magnetic field values are 20 Gs(1);36 Gs(2);48 Gs(3);60 Gs(4).The RF power is 800 W.Argon pressure is 86.6 mPa.
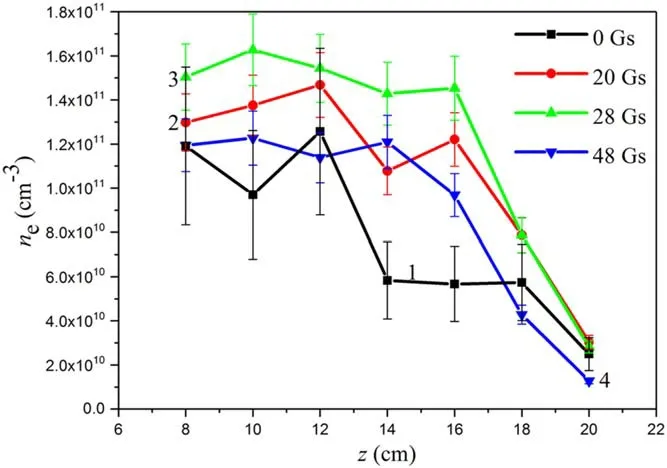
Figure 14.Axial dependence of electron concentration in a plasma source with a length of 22 cm.RF power is 500 W,argon pressure is 86.6 mPa.External magnetic field:(1)0 Gs;(2)20 Gs;(3)28 Gs;(4)48 Gs.
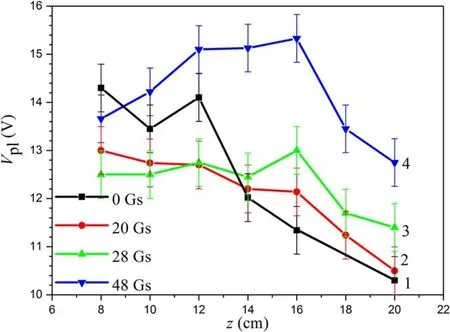
Figure 15.Axial dependence of the space potential in a PS with a length of 22 cm.RF generator power is 500 W,argon pressure is 90.6 mPa.External magnetic field:(1)0 Gs;(2)20 Gs;(3)28 Gs;(4)48 Gs.
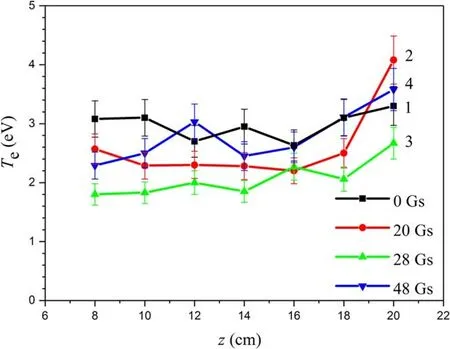
Figure 16.Axial dependence of electron temperature in a 22 cm PS.The RF power is 500 W,pressure of argon is 86.6 mPa.External magnetic field:(1)0 Gs;(2)20 Gs;(3)28 Gs;(4)48 Gs.
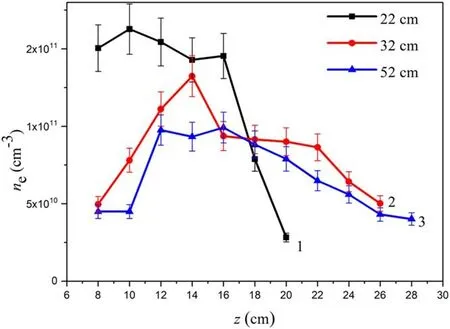
Figure 17.Axial distribution of plasma density in plasma sources with lengths of 22 cm(1),32 cm(2)and 52 cm(3).RF power is 500 W,argon pressure is 90.6 mPa.
4.Discussion
Estimations show that at the studied pressure of 86.6 mPa,the electron free path is about 20 cm,which is close to the length of the plasma source.Under such conditions,electrons undergo only a few collisions when they move along the plasma source axis,which is parallel to the magnetic field lines.The radial movement of electrons is limited because at the considered range of B the electron Larmor radius is less than the PS radius.In such a case[42]the following picture of physical processes is valid.The current,flowing along the antenna,excites a discharge in the PS.An external magnetic field prevents the movement of electrons across the magnetic field,and they mainly move along the field lines.At sufficiently large induction of the magnetic field,the electrons reach the lower boundary of the discharge,and the discharge closes on the bottom grounded flange.The appearance of a prolonged plasma column simplifies excitation of waves in the discharge.Estimations carried out on the base of the experimentally measured plasma parameters showed that inequality ωLi?ω ?Ωc?ωLewas satisfied in our experiments.It means that helicons and TG waves could be excited in the plasma source.The excited RF fields’structure and the RF power absorption efficiency depend on the plasma parameters that in turn depend on RF fields and Ppl.Thus,experiments revealed the self-consistent character of the RF inductive discharge located in the external magnetic field[22].
One of the most interesting results that was observed in the present experiments is the different impact of the external magnetic field on the z dependences of Bz,Bφand Br.In order to clarify the possible reason of the mentioned peculiarity the numerical simulation of RF electric and magnetic fields was carried out.
In accordance with theoretical models[2-4,17-21,25]the measured RF magnetic fields can be considered as the superposition of two solutions of electrodynamic problem;the first one represents the TG wave,and the second one represents helicon.In order to analyze qualitatively the contributions of the two solutions in the resulting RF field,we used a numerical model of a limited inductive RF plasma source placed in an external magnetic field[20,21].Under this approach the plasma source is considered as a resonator where a system of standing waves can be excited by a certain antenna under resonant values of magnetic fields.
The PS(see figure 18)is represented by a dielectric cylinder limited by metal top and bottom end-plates.The antenna azimuthal current is located on the lateral surface of the PS.The following boundary conditions were used[23]:

For dielectric surfaces on which the azimuthal current was located,the boundary conditions were not fixed; they were derived from the field equations[23]:

The electron density was assumed to be constant in the plasma source volume.The presence of the near-wall sheaths was neglected.The external permanent magnetic field B was directed along the cylinder.It was assumed that the following conditions were satisfied:

where νeis the frequency of electron collisions with heavy particles.
Also,the following conditions were considered to be valid:

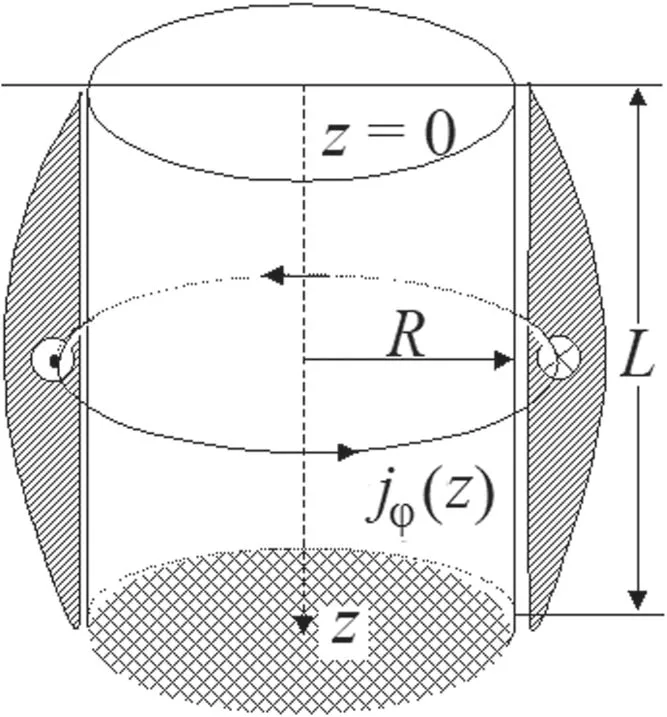
Figure 18.The scheme of the RF plasma source.

wherekzand⊥kare the longitudinal and transverse components of the wave vector.
It was mentioned that the theoretical and numerical models[22,23]considered the plasma source as a resonator where a system of standing waves can be excited under resonant values of magnetic fields.In the limited inductive RF plasma source,the axial wavenumber is quantized,kz=lπ/L,where l=1,2,3...is the axial mode number[6].In the present model,the first four terms with l=1,2,3 and 4 were taken into account.
The electrodynamics problem was solved using the dielectric constant tensor for magnetoactive plasma.In the expressions[11]for the components of the dielectric permittivity tensor,the collisionless(Cherenkov and cyclotron)absorption of RF power by electrons was taken into account along with collisional absorption.At low pressure,the collisionless mechanism of power dissipation can be dominant.To describe the RF fields in the discharge,the Maxwell equations were used.As a result of time-consuming calculations,the system of Maxwell equations without any restrictions was reduced to two coupled equations of the second order for the longitudinal Ezand azimuthal EφRF electric fields:

The solution of two coupled equations was sought in the form for each l:

where I0(x)andI1(x)are zero and first-order Bessel functions of the first kind of imaginary argument.
After substitution of(19)into the system of Maxwell equations a biquadratic equation was obtained,which allowed defining two values of k.Thus,Ezand the fieldφEcan be represented as a linear combination of fields of the first and second solutions:

Under certain conditions the first solution can be attributed to the TG wave and the second one to the helicon wave[22,23].
The formulas(1),(12)-(20)were used for the calculation of the equivalent plasma resistance and RF fields excited in the plasma source with the length 30 and diameter 20 cm at external magnetic field B values 5-200 Gs.The argon pressure was set to 90 mPa and electron density belonged to the range between 3×10¹⁰and 3×1011cm?3.
Before starting the consideration of the numerical results,it is necessary to underline that the goal of the present work was to study the processes taking place in the discharge qualitatively and determine the contribution of the first and second solutions to the Bzand Brvalues.In a real case the shape of an antenna as well as a spatial distribution of electron density will certainly change some specific features of the RF fields and plasma parameter distribution.However,the comparison of the numerical results with experimental ones fulfilled in the earlier papers[21-23]proved to be helpful in explaining the main patterns of the RF inductive discharge behavior under a change of B.
Figure 19 shows the calculated dependences of the amplitudes of the longitudinal electric Ezand azimuthal Eφfields on external magnetic field value in the case when ne=1×1011cm?3.We can see that the solutions,corresponding to l=4,have significant values for small values of B.As l decreases,the region of magnetic fields at which significant values of Ezand Eφare observed shifts to the higher values of B.At the magnetic fields less than 14,20,25 and 50 Gs for the cases l=4,3,2 and 1 correspondingly both the first and second solutions of equations(12)-(19)have commensurate longitudinal and azimuthal components.It means that they cannot be attributed to the TG or helicon waves in the specified range.The situation changes at B,exceeding the indicated threshold values.Here the first solution represents the quasi-longitudinal wave and the second one represents the quasi-transverse wave.Figure 19 shows that here the Ezfield in the discharge can be matched with the field of TG wave,while Eφcan be matched with the helicon one.
Now let us consider the RF magnetic fields.Figure 20 demonstrates the change of Bzand Bron B.The increase of the magnetic field leads to the decrease of the l at which Bzis maximal.In general,the longitudinal RF field Bzis mainly determined by the first solution,i.e.by the field of the TG wave,while the radial RF field Bris mainly determined by the second solution,i.e.by the helicon field.
Now let us consider what happens if the electron density is increased.The dependences of Bz,Brand Ezon B,calculated for ne=3×1011cm?3and l=2,are shown in figure 21.We can see that the amplitude of the second solution(helicon field)grows with respect to the amplitude of the first solution(TG field).As a result,all components of the RF magnetic field at higher electron density are determined by the helicon wave.However,the longitudinal component of the RF electric field is still close to the field of TG wave in the vast majority of B values.
The obtained numerical results allow interpretation of the experiment in the following way.At the external magnetic field equal to 36 Gs and electron densities observed in experiments(ne<3×1011cm?3),the Bzamplitude is largely determined by the field of the TG wave,while Bramplitude represents the radial field of the helicon wave.At B=60 Gs the longitudinal mode with smaller l is realized in the discharge.Helicon fields contribute not only to Brbut to Bztoo.
Taking into account that RF power absorption efficiency peaks at 36 Gs,it is possible to conclude that the TG wave plays an essential role in establishing the properties of RF inductive discharge located in a low value external magnetic field.
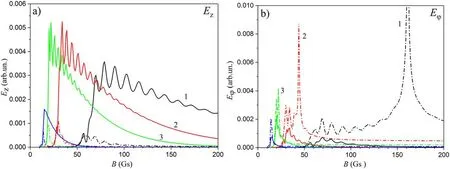
Figure 19.The amplitudes of the longitudinal Ez and azimuthal Eφ components of the RF electric field versus B.Solid and dash dot lines represent the first and second solutions of equations(14)and(15).Black(1),red(2),green(3)and blue(4)lines correspond to l equal to 1,2,3 and 4.ne=1×1011 cm?3; argon pressure is 90 mPa.
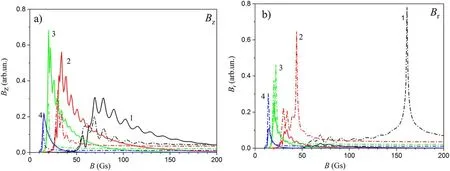
Figure 20.The amplitudes of the longitudinal Bz and radial Br components of the RF magnetic field versus B.Solid and dash dot lines represent the first and second solutions of equations(14)and(15).Black(1),red(2),green(3)and blue(4)lines correspond to l equal to 1,2,3 and 4.ne=1×1011 cm?3,argon pressure is 90 mPa.
5.Conclusion
Experiments showed that the presence of the external magnetic field changed the properties of the inductive RF discharge significantly.First,the increase of B leads to the formation of the radially limited plasma column closed on the bottom grounded flange.Second,the waves are excited in the discharge.The RF fields’ structure and RF power absorption efficiency are determined by plasma parameters that in turn depend on the RF fields and Ppl.Thus,the variation of the external magnetic field inductance results in the self-consistent change of the RF fields,RF power absorption efficiency and plasma parameters[22].
At maximal values of the RF power absorption efficiency the axial distribution of longitudinal Bzand azimuthal Bφcomponents of the RF magnetic field manifest the formation of the partially standing wave with half wavelength close to 8 cm.The axial dependence of the radial RF magnetic field component Brdiffers drastically from Bzand Bφ.It was concluded that the Bzamplitude was largely determined by the field of the TG wave,while the Bramplitude represented the radial field of the helicon wave.
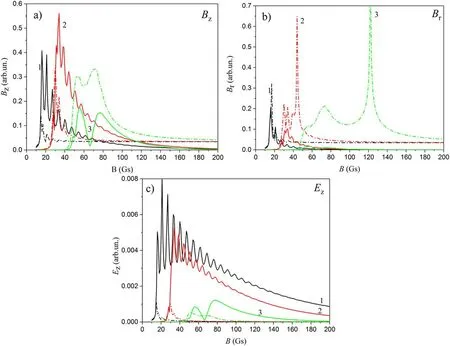
Figure 21.The amplitudes of Bz(a),Br(b),Ez(c)versus B calculated for l=2.Solid and dash dot lines represent the first and secondsolutions of equations(14)and(15).Black(1),red(2),green(3)lines correspond to ne=3×1010 cm?3,1×1011 cm?3,3×1011 cm?3.Argon pressure is 90 mPa.
 Plasma Science and Technology2020年11期
- Plasma Science and Technology的其它文章
- The effect of resonant magnetic perturbation with different poloidal mode numbers on peeling-ballooning modes
- Soft landing of runaway currents by ohmic field in J-TEXT tokamak
- Numerical simulations of the wavefront distortion of inter-spacecraft laser beams caused by solar wind and magnetospheric plasmas
- Effect of insulating oil covering electrodes on the characteristics of a dielectric barrier discharge
- Numerical study on the modulation of THz wave propagation by collisional microplasma photonic crystal
- Study of partial discharge characteristics in HFO-1234ze(E)/N2 mixtures
