Clinicopathological characteristics of 8697 patients with COVID-19 in China: a meta- analysis
Jieyun Zhu, Zhimei Zhong, Pan Ji, Hongyuan Li, Bocheng Li, Jielong Pang, Jianfeng Zhang, Chunling Zhao
ABSTRACT
INTRODUCTION
In the spring of 2020, the coronavirus disease 2019 (COVID-19) pandemic has spread to more than 200 countries around the world.12 As of 27 March 2020, the total number of confirmed cases has exceeded 500 000.3This pandemic has become a serious threat to global health and continues to challenge healthcare systems worldwide. It was determined to be caused by a novel coronavirus, the severe acute respiratory syndrome coronavirus 2.4Therefore, it is critical to understand and identify the key clinical and laboratory characteristics of patients with COVID-19 in order to help in early detection and isolation of infected individuals, as well as minimise the spread of the disease.5
Although a number of studies have attempted to explore this subject, most of them were single- centre studies that were conducted in a specific hospital or region. Due to differences in study design and small samples, the clinical symptoms, laboratory findings and other key outcomes of these studies are complicated and unclear.6-8For example, two recent systematic reviews910 of studies of patients with COVID-19 indicated a high incidence of fever (>88%) and cough (>68%), but only one10reported symptoms of myalgia or fatigue (35.8%). Both reviews meta- analysed small samples pooled from 10 studies.
Therefore, the present meta- analysis was performed to provide the most extensive, up- to- date description so far of clinicopathological characteristics of patients with COVID-19 and to provide a reference for clinical decisions and future research.
MATERIALS AND METHODS
Search strategy and study eligibility
This meta- analysis was carried out based on the guidelines of the Preferred Reporting Items for Meta- Analyses of Observational Studies in Epidemiology Statement.11We systematically examined the studies on clinicopathological characteristics of patients with COVID-19 indexed in the PubMed, Embase, Chinese Biomedical Literature, Wanfang, China Science and Technology Journal Database and China National Knowledge Infrastructure databases between 1 January 2020 and 16 March 2020. All references cited in these studies were also analysed manually to ensure that eligible papers were not overlooked. If multiple studies analysed the same patient population, we included only the one with more detailed information or the one published more recently. No language restrictions were incorporated during the literature search, and only literature published online was included. The following keywords were used, both separately and in combination, as part of the search strategy in each database: ‘Corona virus’, ‘Coronavirus’, ‘2019- nCoV’, ‘COVID-19’ or ‘SARS- CoV-2’ (box 1).

# 1 Corona virus [Title/Abstract]# 2 Coronavirus [Title/Abstract]# 3 2019- nCoV [Title/Abstract]# 4 COVID-19 [Title/Abstract]# 5 SARS- CoV-2 [Title/Abstract]# 6 # 1 OR # 2 OR # 3 OR # 4 OR # 5
Studies were included in the meta- analysis if they had cohort, case-control or case series designs and provided sufficient details on clinical symptoms, laboratory outcomes and asymptomatic patients. Only studies of more than 40 patients were included.
Data extraction and quality assessment
The literature selected was independently assessed by three reviewers based on the eligibility criteria, and relevant data were extracted. Disagreements were resolved by consensus. The titles and abstracts were first screened to identify the eligible articles, followed by a full- text review to obtain detailed information. When required, the authors were contacted directly to obtain further information and clarifications regarding their study. The following data were extracted from each included study: surname of first author; date of publication; study design; number, age and sex of patients; clinical and laboratory outcomes; and data relevant for assessing publication bias. The quality of observational case series was independently evaluated by the three reviewers based on the British National Institute for Clinical Excellence12guidelines. This evaluation was conducted based on a set of eight criteria, and studies with a score greater than 4 were considered to be of high quality (total score=8).
Statistical analyses
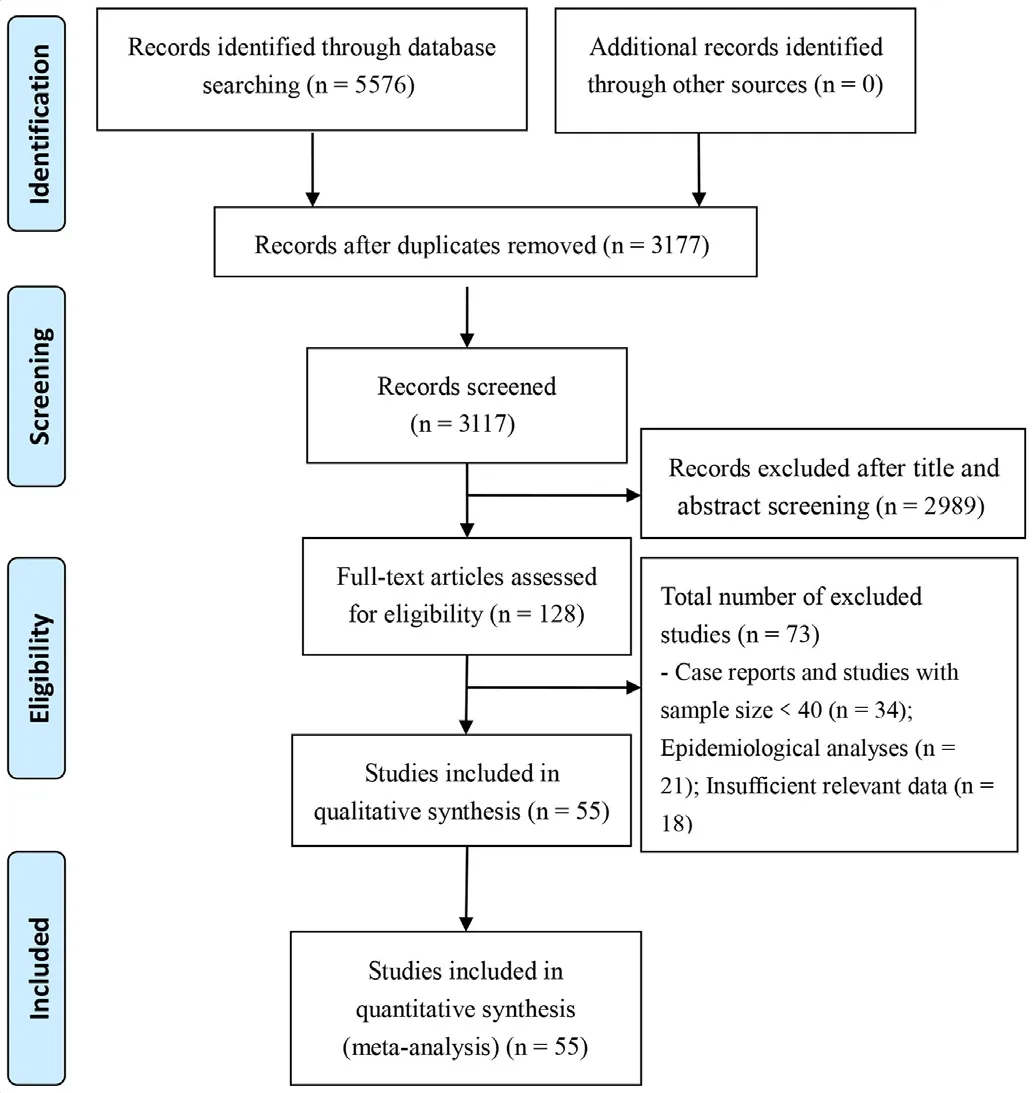
Figure 1 Flow chart depicting literature screening process.
All statistical analyses were performed using STATA V.12. Original incidence ratesrwere transformed by the double arcsine method to ensure a normal distribution, and the resulting transformed ratetrwas used in single- arm meta- analysis. The heterogeneity between studies was analysed using a χ2test (p<0.10) and quantified using the I2statistic. When no statistical heterogeneity was observed, a fixed- effects model was used. Otherwise, potential sources of clinical heterogeneity were identified using subgroup and sensitivity analyses; these sources were eliminated, and the meta- analysis was repeated using a random- effects model. Pooled incidence ratesRwere back- calculated from transformed ratestrusing theR=[sin (tr/ 2)].2A two- tailed p<0.05 was considered statistically significant. Publication bias was evaluated using a funnel plot along with Egger’s regression test and Begg’s test.
RESULTS
Literature screening and assessment
A total of 5576 records were identified from the various databases examined. After a detailed assessment based on the inclusion criteria, 55 unique studies6-813-64 involving 8697 patients with COVID-19 were included in the meta- analysis (figure 1).
Characteristics of included studies
All studies included in the meta- analysis were conducted in China and published between 6 February 2020 and 16 March 2020. These retrospective studies examined Chinese patients distributed across 31 provinces. A large proportion of these studies (n=40) were based on data collected from a single centre, with no clear explanation regarding eligibility criteria. Follow- up data were reported for most patients. All studies received quality scores of 5-8, indicating high quality (table 1).
Continued
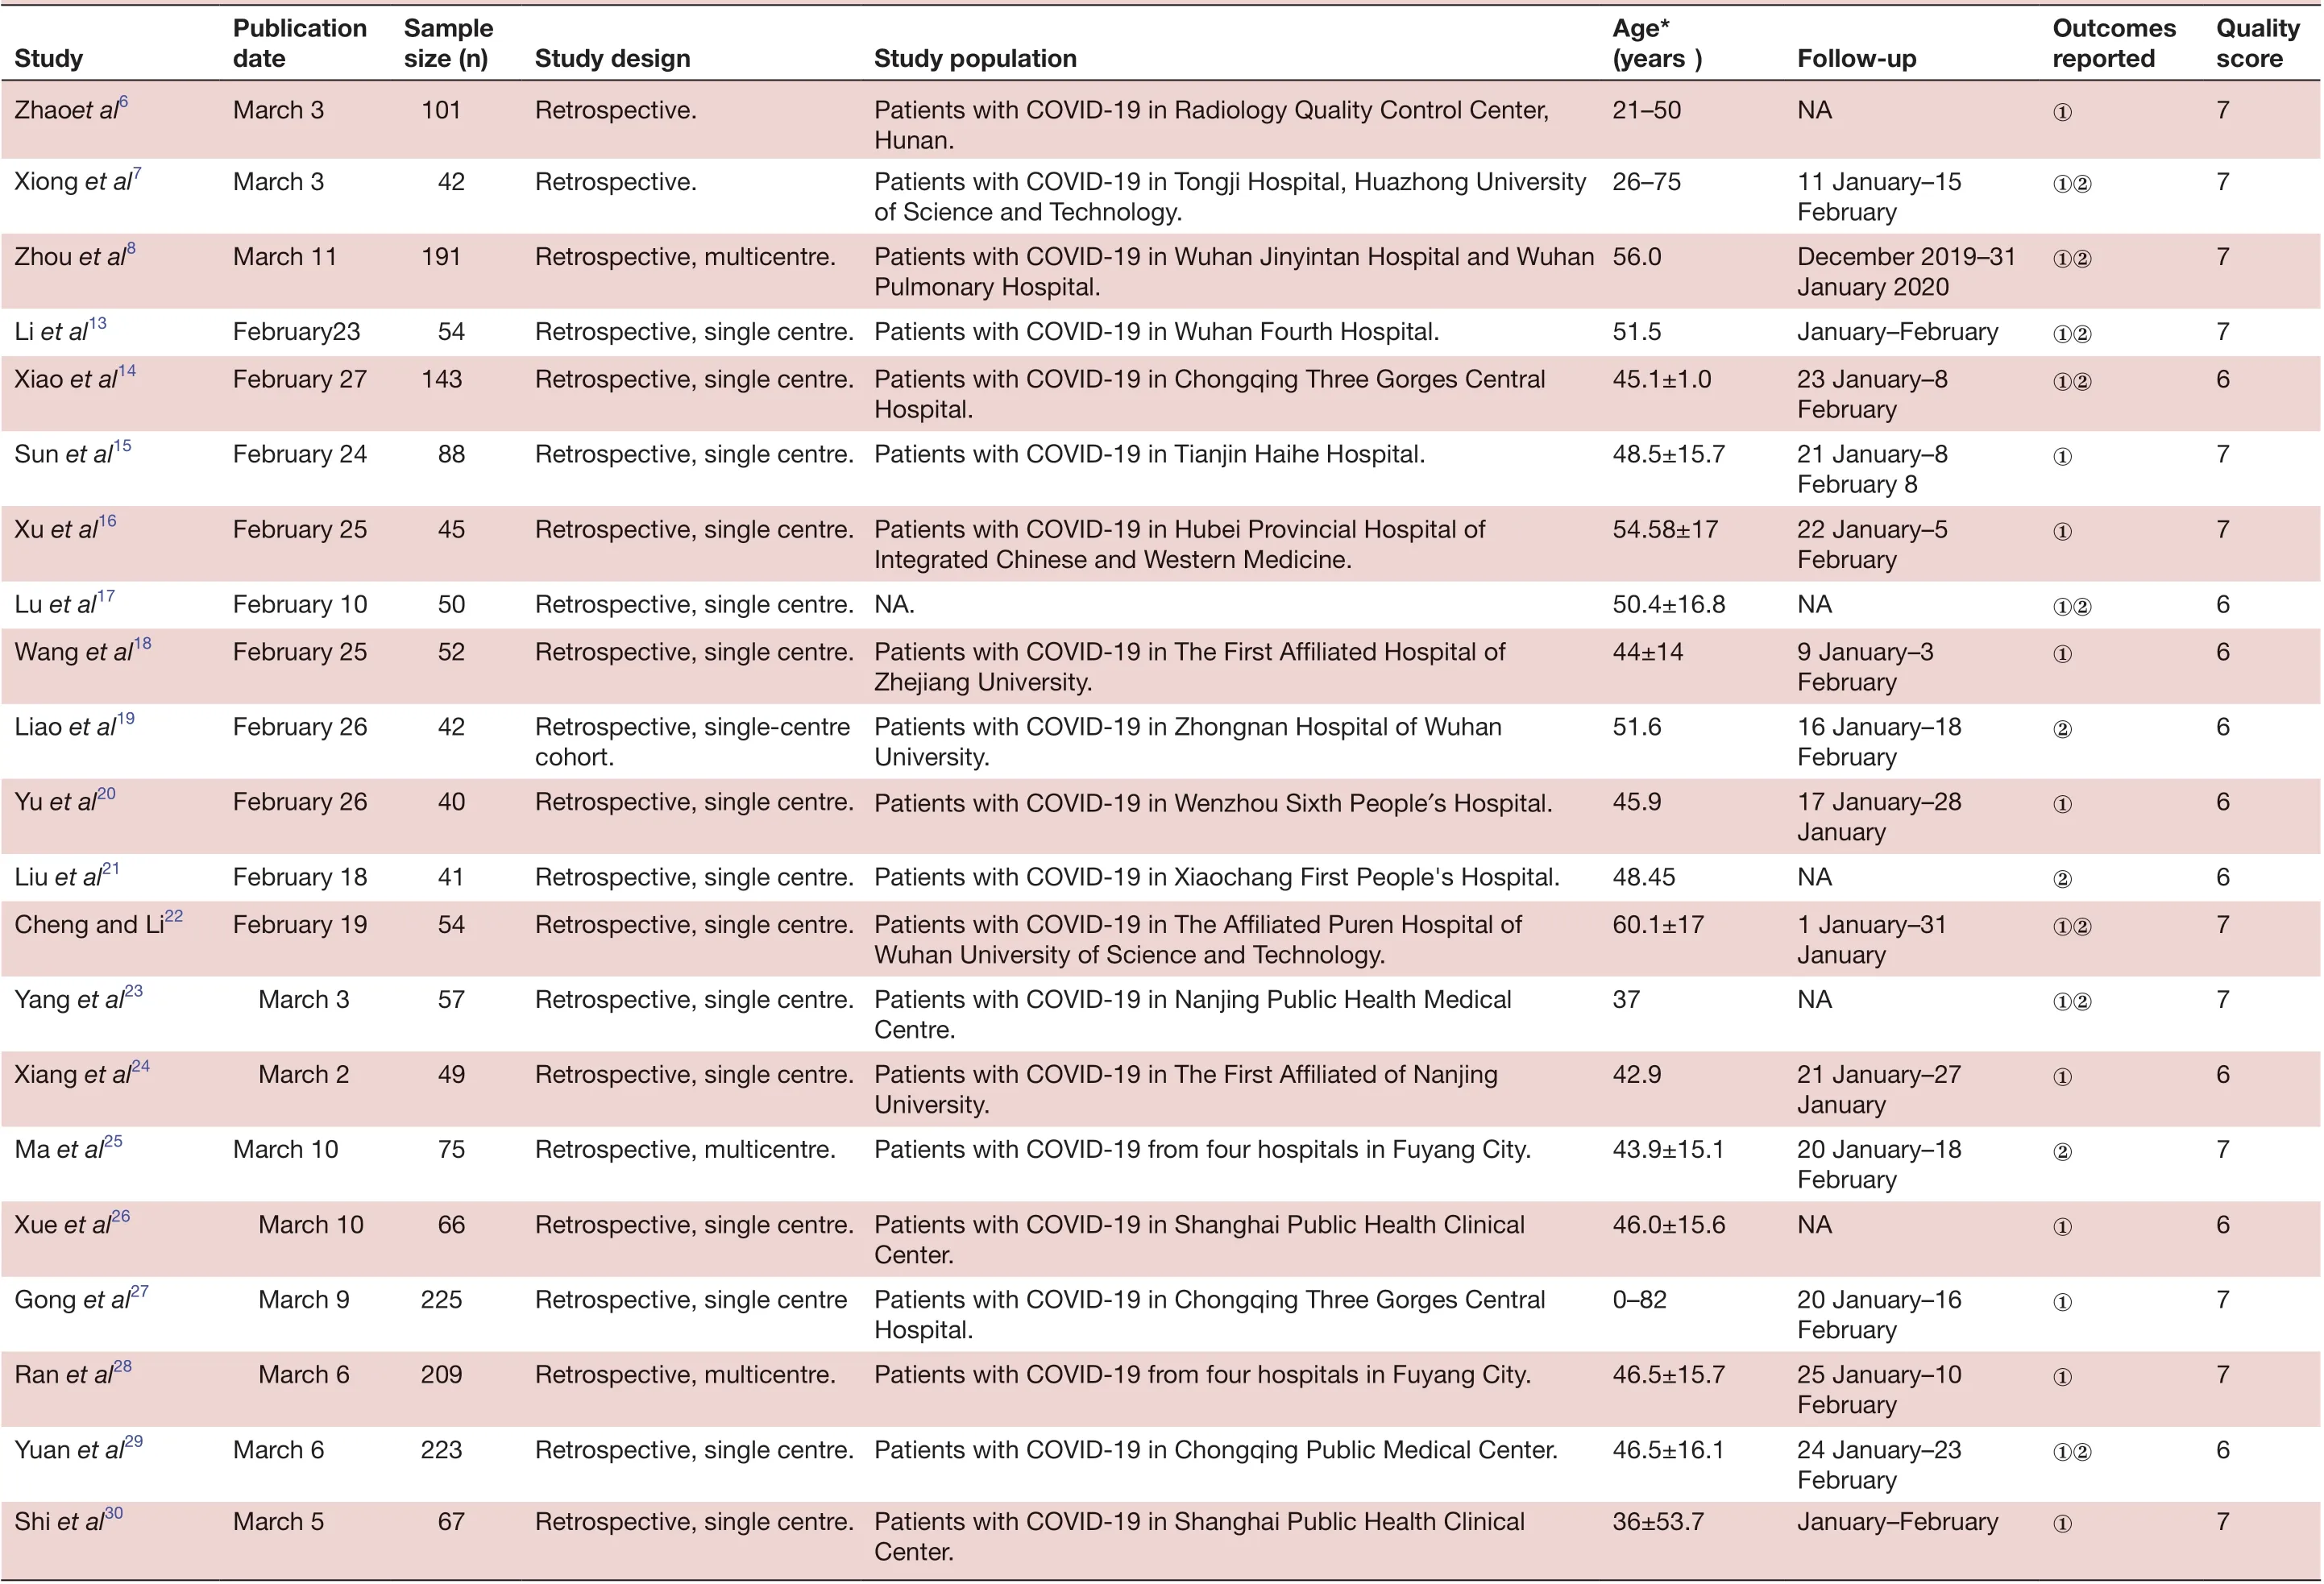
QuaIity score 7 7 7 7 6 7 7 6 6 6 6 Outcomes reported①②①②①②①①①②①FoIIow- up NA①11 January-15 February December 2019-31 January 2020 January-February①②23 January-8 February 21 January-8 February 8 22 January-5 February NA①②9 January-3 February 16 January-18 February 17 January-28 January Age*(years)21-50 26-75 56.0 51.5 45.1±1.0 48.5±15.7 54.58±17 50.4±16.8 44±14 51.6 45.9 Study popuIation Patients with COVID-19 in Radiology Quality Control Center, Hunan.Patients with COVID-19 in Tongji Hospital, Huazhong University of Science and Technology.Patients with COVID-19 in Wuhan Jinyintan Hospital and Wuhan Pulmonary Hospital.Hospital.Integrated Chinese and Western Medicine.Zhejiang University.Patients with COVID-19 in Zhongnan Hospital of Wuhan University.Study design Retrospective.Retrospective.Retrospective, multicentre.Retrospective, single centre. Patients with COVID-19 in Wuhan Fourth Hospital.Retrospective, single centre. Patients with COVID-19 in Chongqing Three Gorges Central Retrospective, single centre. Patients with COVID-19 in Tianjin Haihe Hospital.Retrospective, single centre. Patients with COVID-19 in Hubei Provincial Hospital of Retrospective, single centre. NA.Retrospective, single centre. Patients with COVID-19 in The First Affiliated Hospital of Retrospective, single- centre cohort.Retrospective, single centre. Patients with COVID-19 in Wenzhou Sixth People′s Hospital.SampIe size (n)101 42 191 54 143 88 45 50 52 42 40 PubIication date March 3 March 3 March 11 Study Zhaoet al6 Xiong et al7 Zhou et al8 Li et al13February23 Xiao et al14February 27 Sun et al15February 24 Xu et al16February 25 Lu et al17February 10 Wang et al18February 25 Liao et al19February 26 Yu et al20February 26 6 7 7 6 7 6 7 7 6 7 NA②①②①②①①①②1 January-31 January NA①②21 January-27 January 20 January-18 February NA①20 January-16 February 25 January-10 February 24 January-23 February January-February①48.45 60.1±17 37 42.9 43.9±15.1 46.0±15.6 0-82 46.5±15.7 46.5±16.1 36±53.7 Retrospective, single centre. Patients with COVID-19 in Xiaochang First People's Hospital.Retrospective, single centre. Patients with COVID-19 in The Affiliated Puren Hospital of Wuhan University of Science and Technology.Retrospective, single centre. Patients with COVID-19 in Nanjing Public Health Medical Centre.Retrospective, single centre. Patients with COVID-19 in The First Affiliated of Nanjing University.Patients with COVID-19 from four hospitals in Fuyang City.Center.Hospital.Patients with COVID-19 from four hospitals in Fuyang City.Center.Retrospective, multicentre.Retrospective, single centre. Patients with COVID-19 in Shanghai Public Health Clinical Retrospective, single centre Patients with COVID-19 in Chongqing Three Gorges Central Retrospective, multicentre.Retrospective, single centre. Patients with COVID-19 in Chongqing Public Medical Center.Retrospective, single centre. Patients with COVID-19 in Shanghai Public Health Clinical 41 54 57 49 75 66 225 209 223 67 Liu et al21February 18 Cheng and Li22February 19 Yang et al23 March 3 Xiang et al24 March 2 Ma et al25March 10 Xue et al26 March 10 Gong et al27 March 9 Ran et al28 March 6 Yuan et al29March 6 Shi et al30March 5
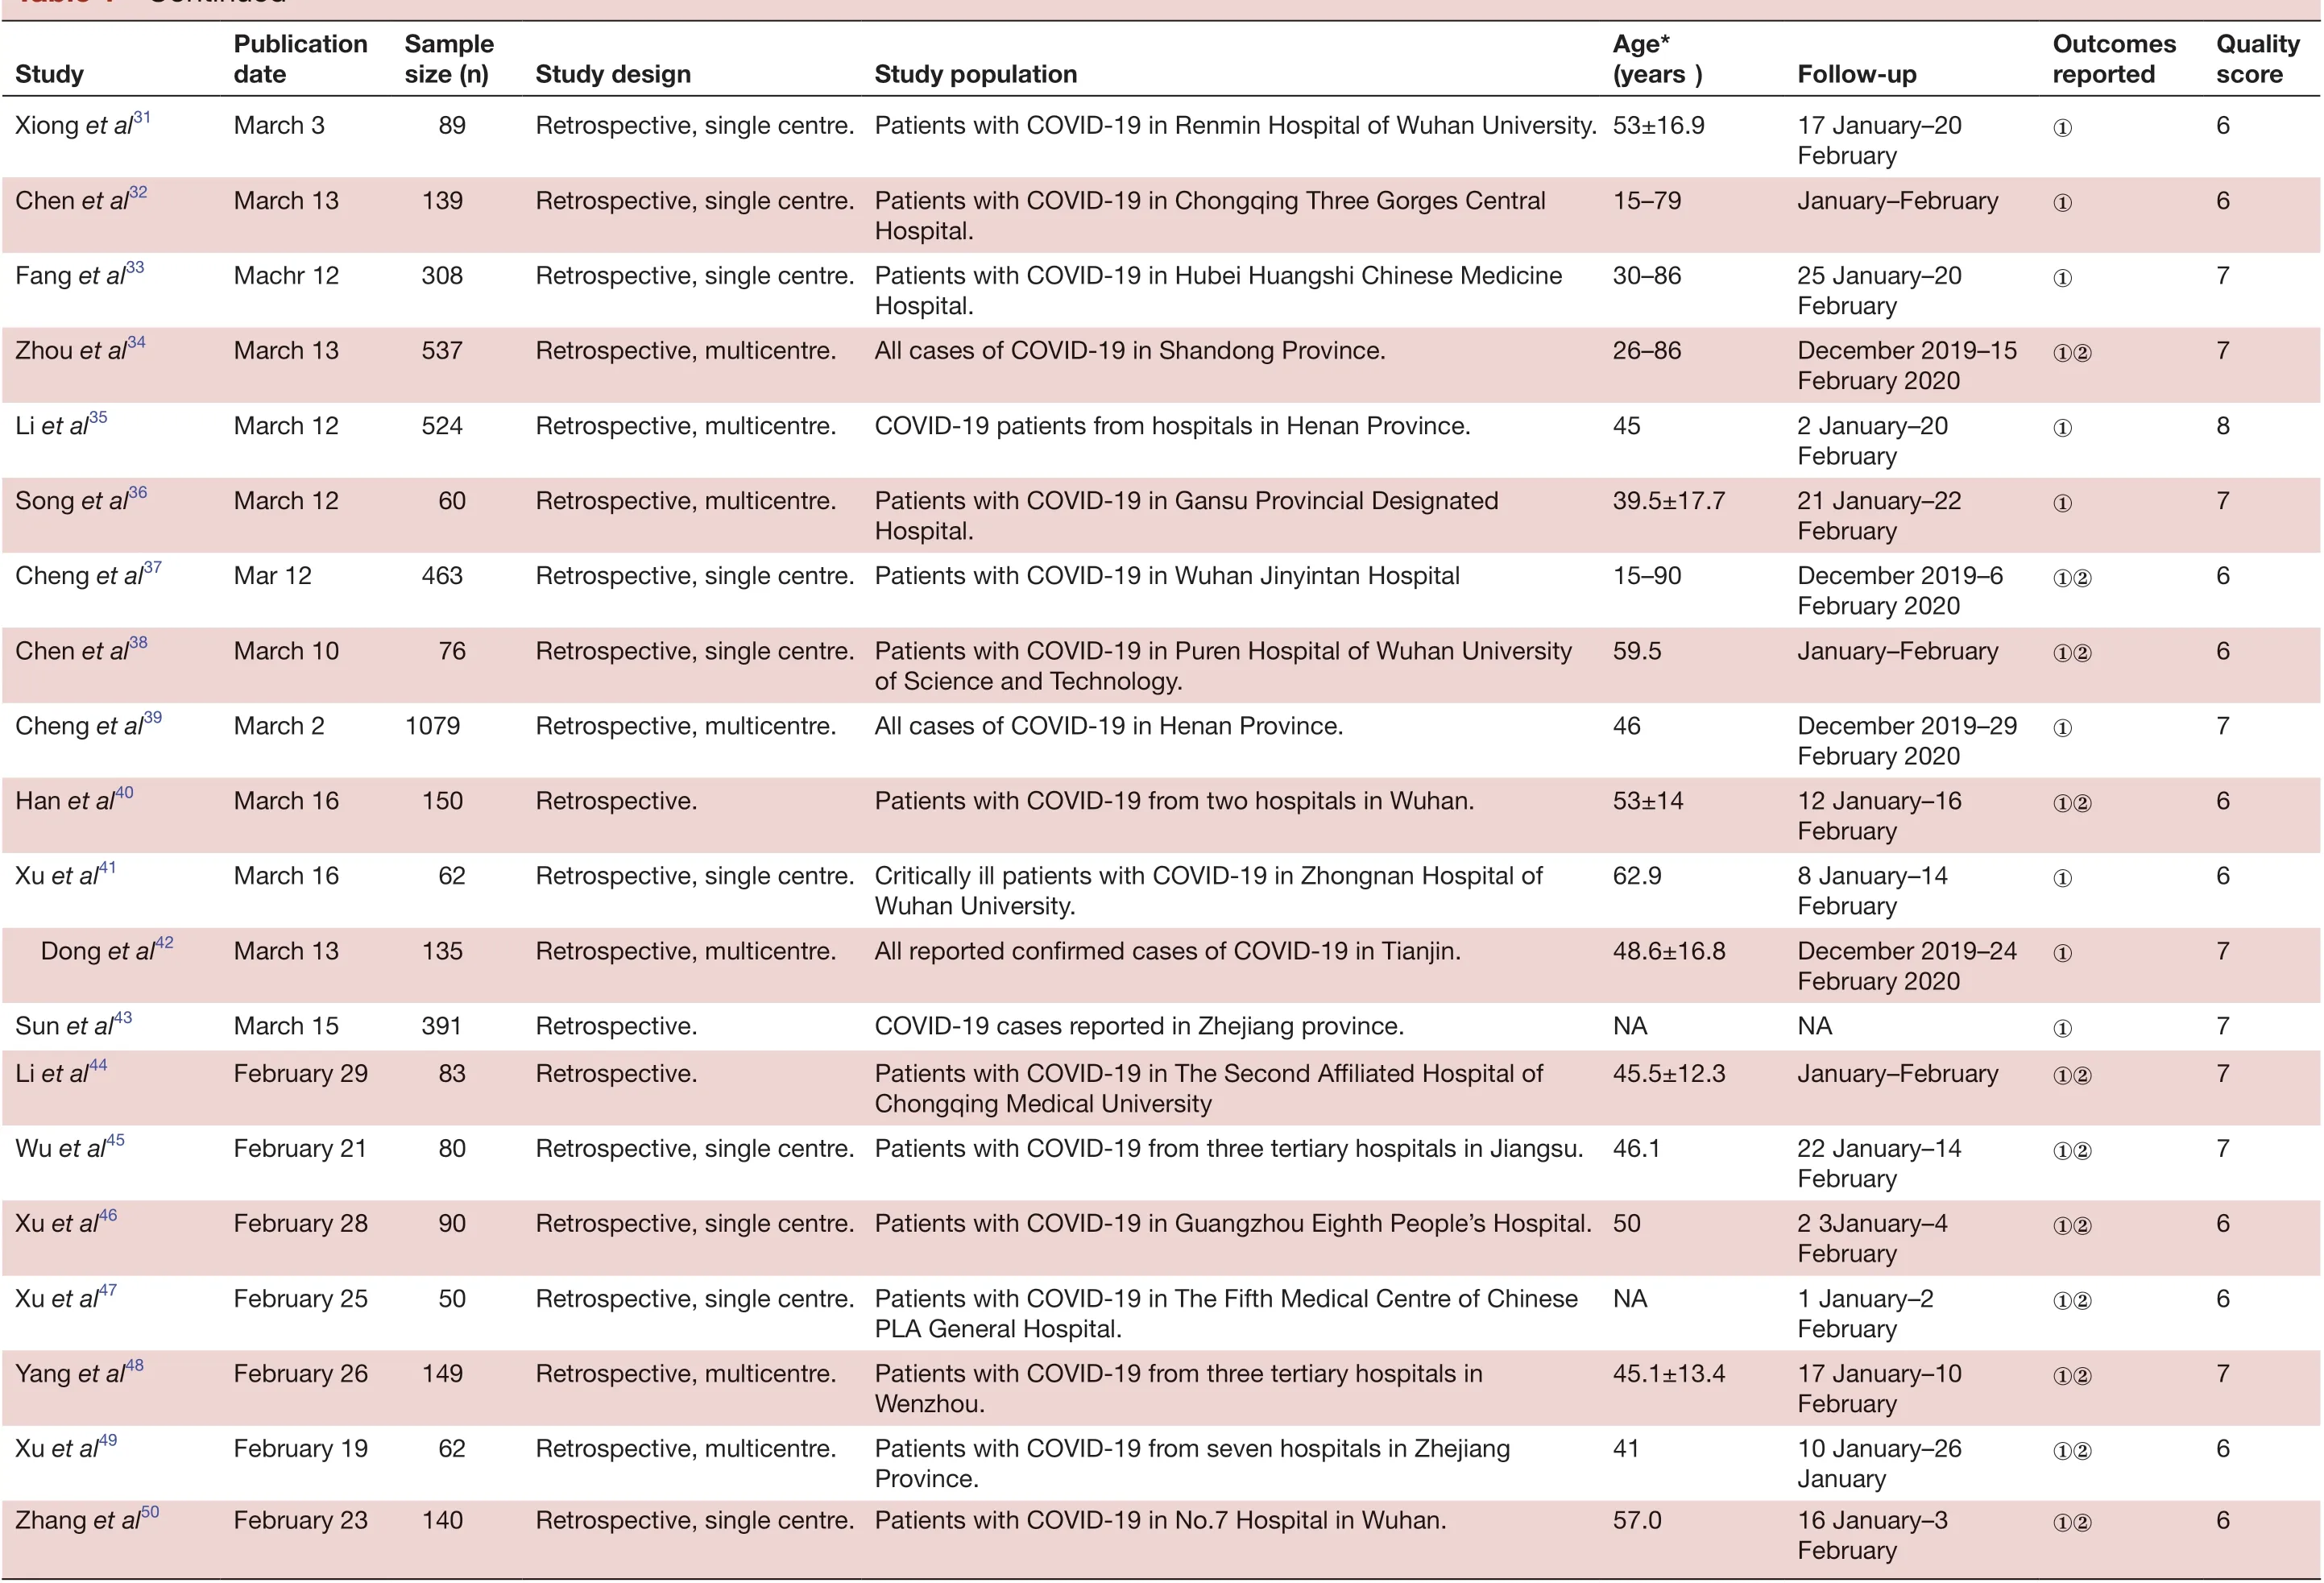
TabIe 1 Continued
Continued
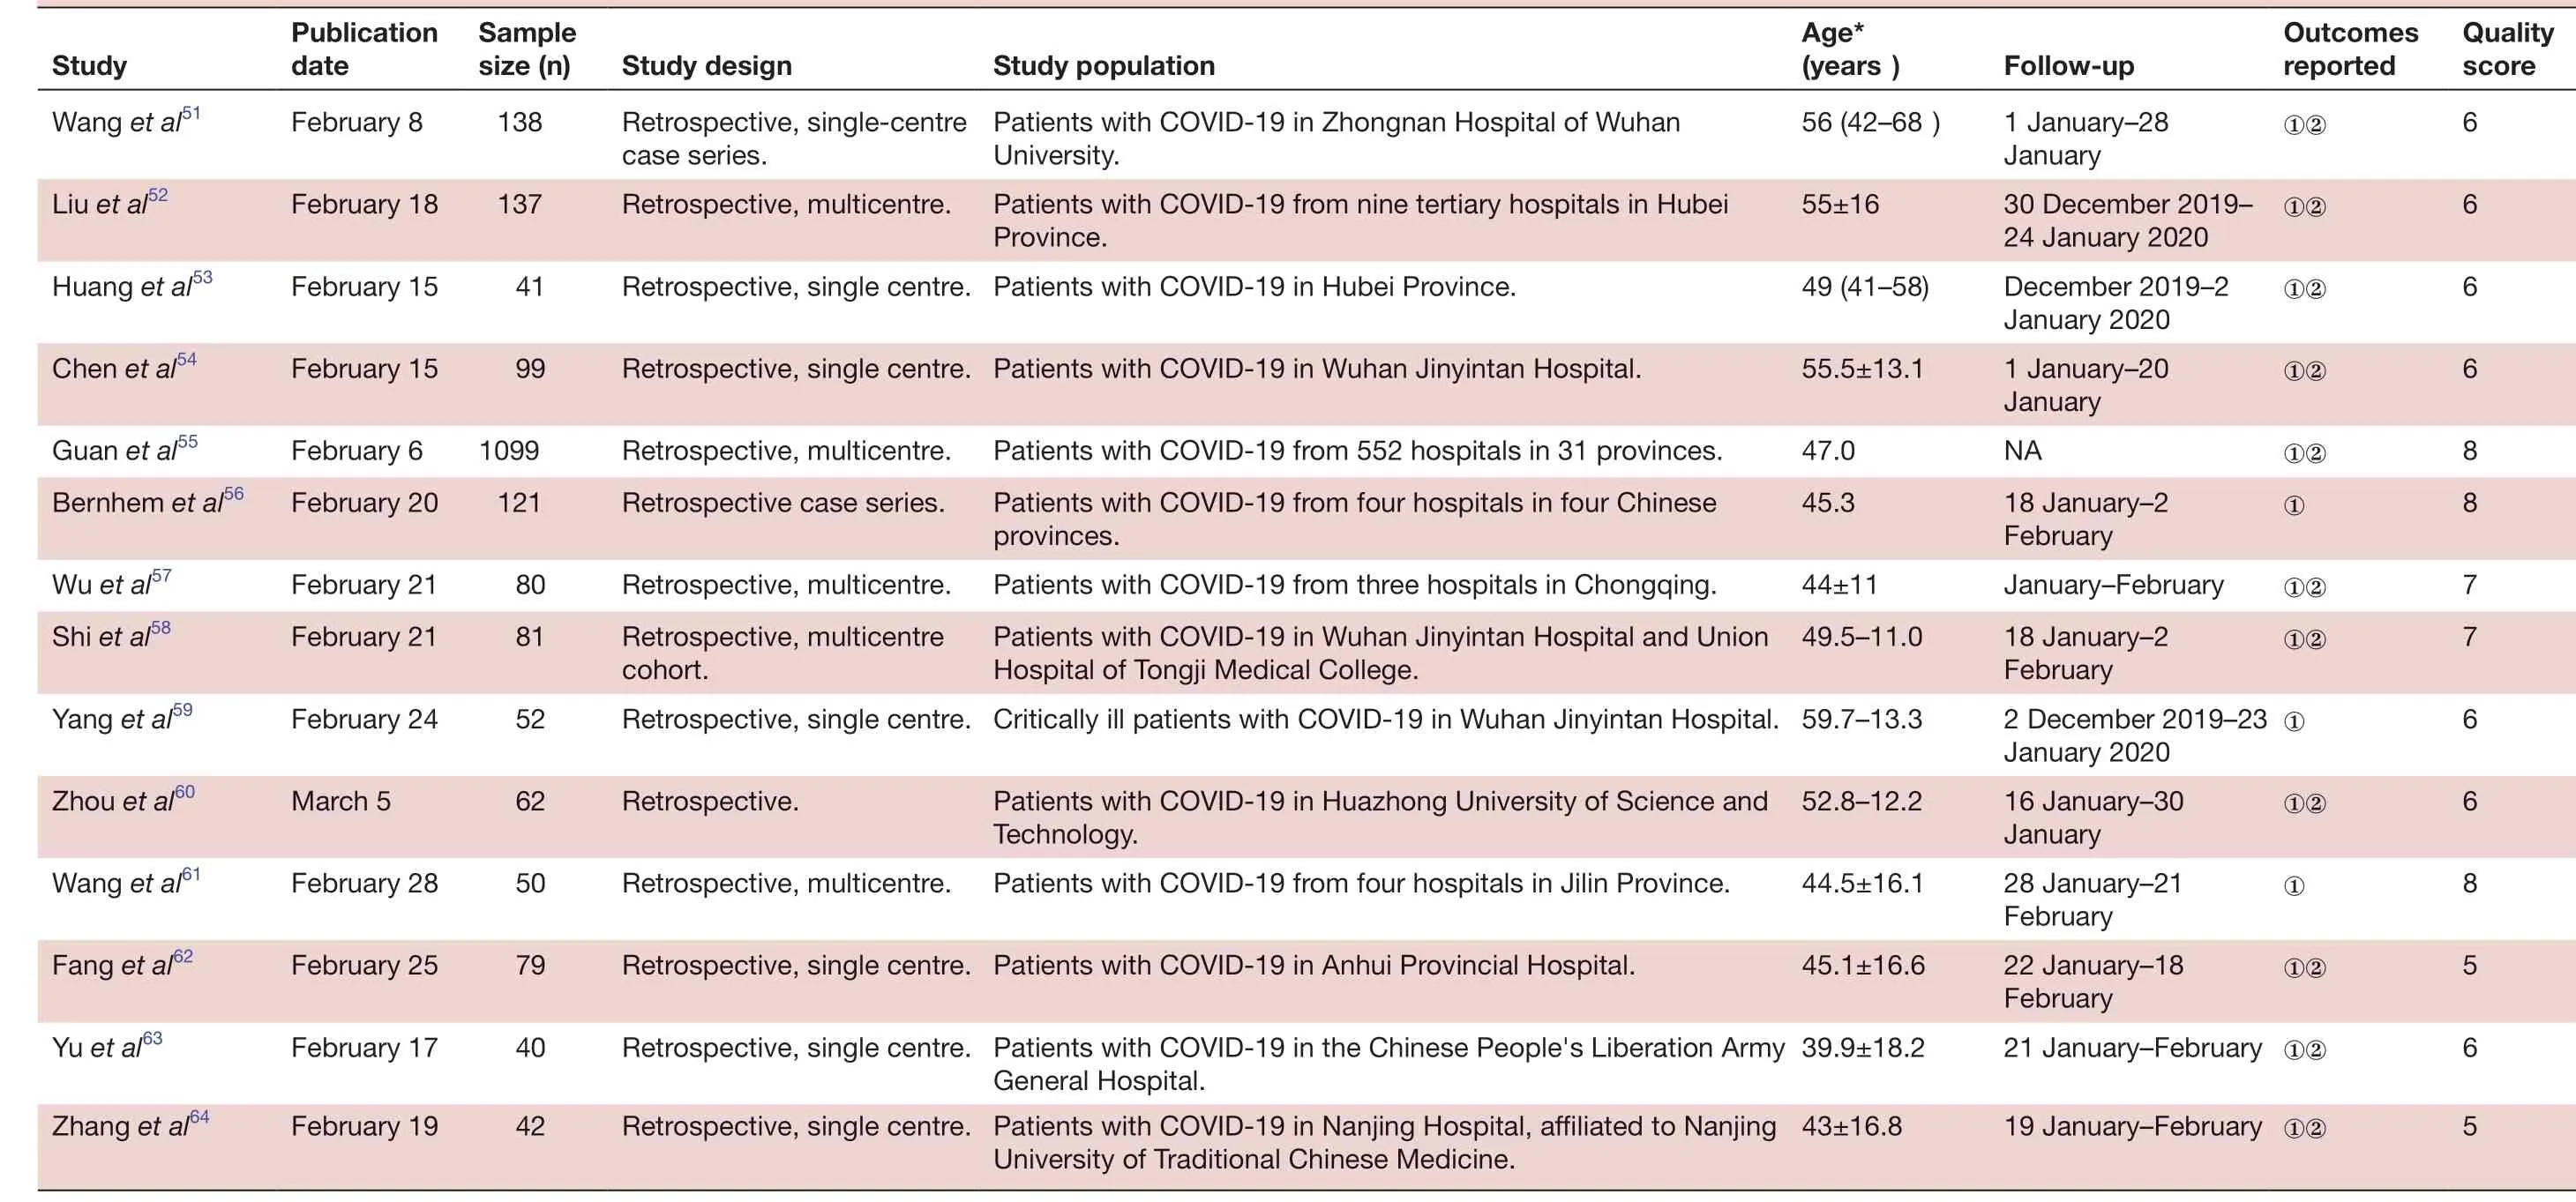
6 QuaIity score 6 6 6 6 8 8 7 7 6 Outcomes reported①②①②①②①②NA①②①January-February①②①②①8 5 6 5①②FoIIow- up 1 January-28 January 30 December 2019-24 January 2020 December 2019-2 January 2020 1 January-20 January 18 January-2 February 18 January-2 February 2 December 2019-23 January 2020①①②16 January-30 Age*(years)56 (42-68)55±16 49 (41-58)55.5±13.1 47.0 45.3 44±11 49.5-11.0 Retrospective, single centre. Critically ill patients with COVID-19 in Wuhan Jinyintan Hospital. 59.7-13.3 January 28 January-21 February 22 January-18 February 21 January-February ①②19 January-February ①②52.8-12.2 Study popuIation Patients with COVID-19 in Zhongnan Hospital of Wuhan University.Patients with COVID-19 from nine tertiary hospitals in Hubei Province.Retrospective, single centre. Patients with COVID-19 in Hubei Province.Retrospective, single centre. Patients with COVID-19 in Wuhan Jinyintan Hospital.Patients with COVID-19 from 552 hospitals in 31 provinces.Patients with COVID-19 from four hospitals in four Chinese provinces.Patients with COVID-19 from three hospitals in Chongqing.Patients with COVID-19 in Wuhan Jinyintan Hospital and Union Hospital of Tongji Medical College.44.5±16.1 45.1±16.6 39.9±18.2 43±16.8 Technology.Retrospective, single centre. Patients with COVID-19 in Anhui Provincial Hospital.Retrospective, single centre. Patients with COVID-19 in the Chinese People's Liberation Army Patients with COVID-19 in Huazhong University of Science and Study design Retrospective, single- centre case series.Retrospective, multicentre.Retrospective, multicentre.Retrospective case series.Retrospective, multicentre.Retrospective, multicentre Patients with COVID-19 from four hospitals in Jilin Province.General Hospital.Retrospective, single centre. Patients with COVID-19 in Nanjing Hospital, affiliated to Nanjing University of Traditional Chinese Medicine.Retrospective.cohort.SampIe size (n)138 137 41 99 1099 121 80 81 52 Retrospective, multicentre.62 PubIication date Study Wang et al51February 8 Liu et al52February 18 Huang et al53February 15 Chen et al54February 15 Guan et al55February 6 Bernhem et al56February 20 Wu et al57February 21 Shi et al58February 21 Yang et al59February 24 50 79 40 42 Zhou et al60March 5 Wang et al61February 28 Fang et al62February 25 Yu et al63February 17 Zhang et al64February 19
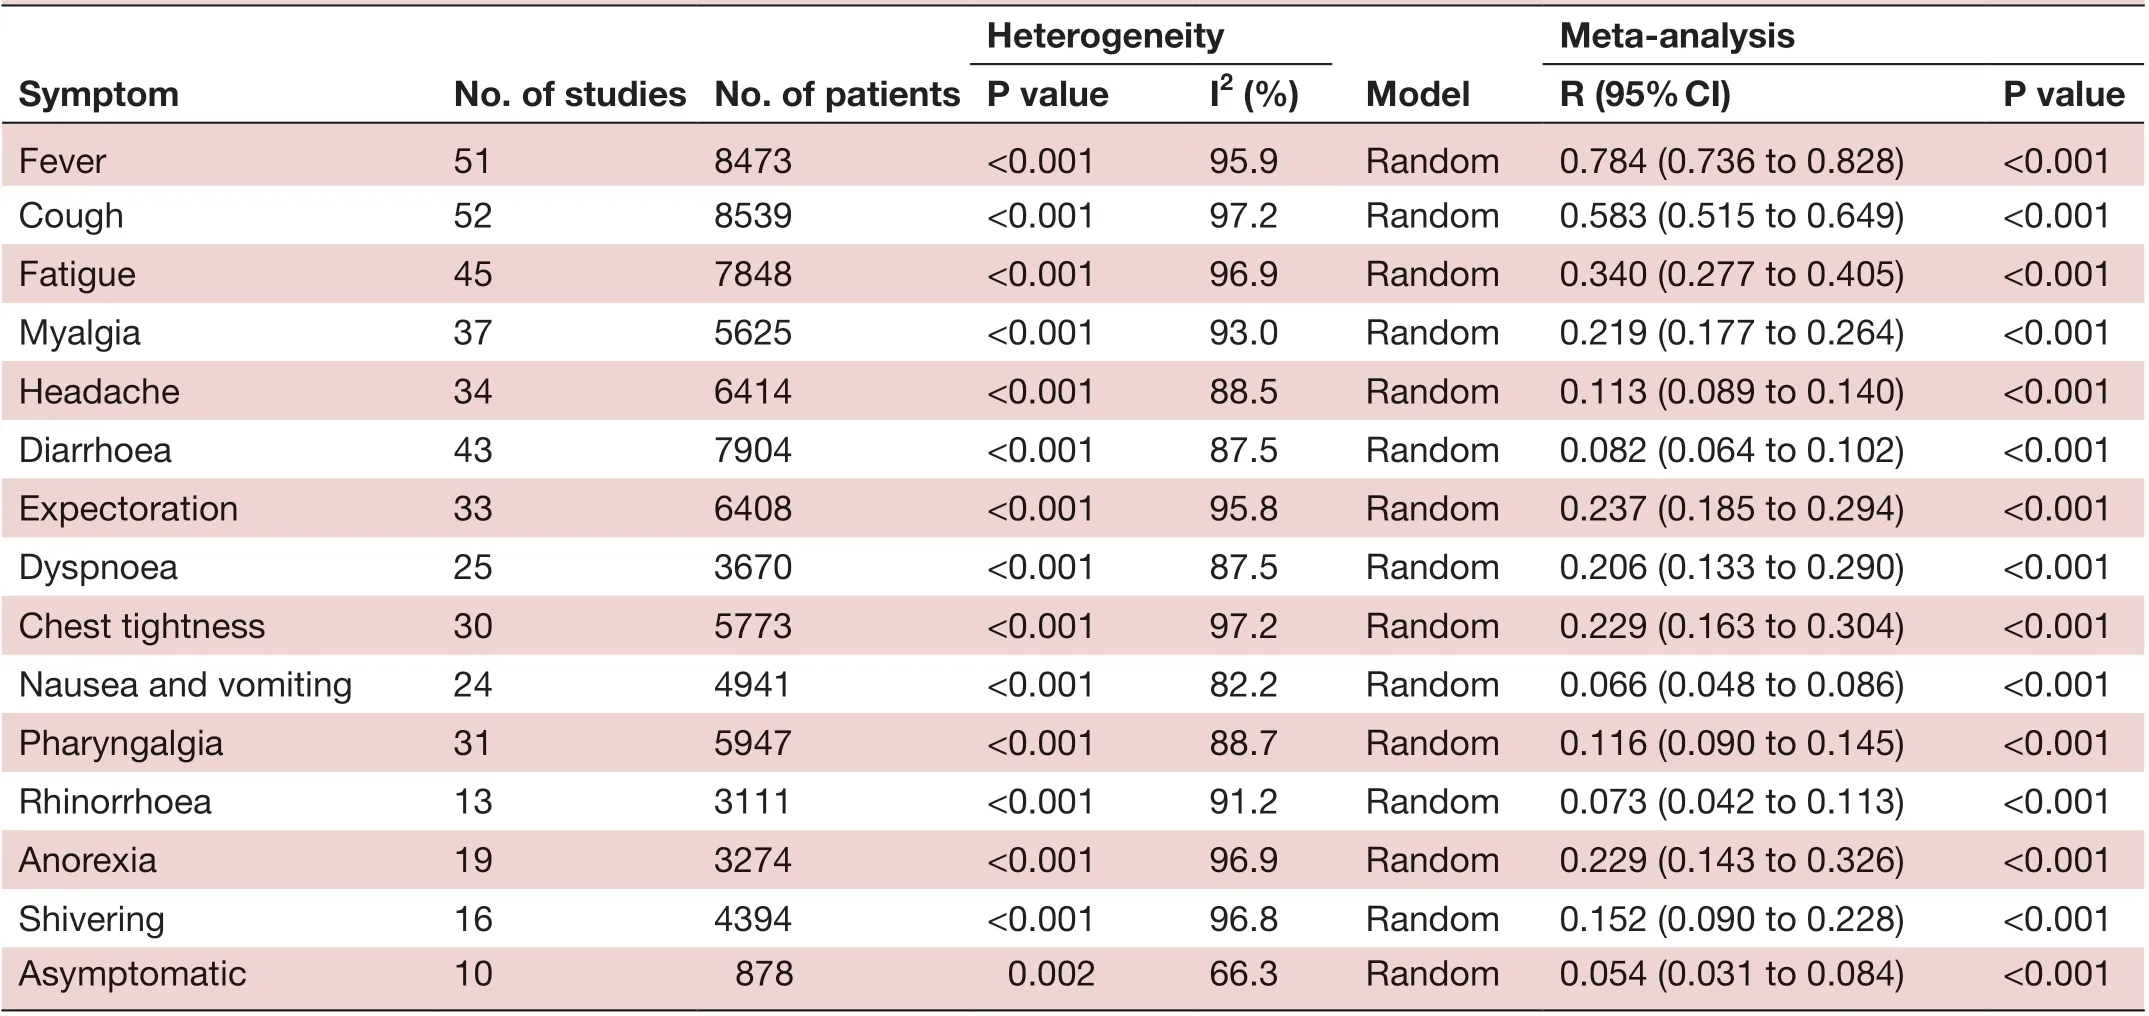
Meta- anaIysis P vaIue I2 (%) R (95% CI) P vaIue Fever 51 8473 <0.001 95.9 Random 0.784 (0.736 to 0.828) <0.001 Cough 52 8539 <0.001 97.2 Random 0.583 (0.515 to 0.649) <0.001 Fatigue 45 7848 <0.001 96.9 Random 0.340 (0.277 to 0.405) <0.001 Myalgia 37 5625 <0.001 93.0 Random 0.219 (0.177 to 0.264) <0.001 Headache 34 6414 <0.001 88.5 Random 0.113 (0.089 to 0.140) <0.001 Diarrhoea 43 7904 <0.001 87.5 Random 0.082 (0.064 to 0.102) <0.001 Expectoration 33 6408 <0.001 95.8 Random 0.237 (0.185 to 0.294) <0.001 Dyspnoea 25 3670 <0.001 87.5 Random 0.206 (0.133 to 0.290) <0.001 Chest tightness 30 5773 <0.001 97.2 Random 0.229 (0.163 to 0.304) <0.001 Nausea and vomiting 24 4941 <0.001 82.2 Random 0.066 (0.048 to 0.086) <0.001 Pharyngalgia 31 5947 <0.001 88.7 Random 0.116 (0.090 to 0.145) <0.001 Rhinorrhoea 13 3111 <0.001 91.2 Random 0.073 (0.042 to 0.113) <0.001 Anorexia 19 3274 <0.001 96.9 Random 0.229 (0.143 to 0.326) <0.001 Shivering 16 4394 <0.001 96.8 Random 0.152 (0.090 to 0.228) <0.001 Asymptomatic 10 878 0.002 66.3 Random 0.054 (0.031 to 0.084) <0.001 Heterogeneity Symptom No. of studies No. of patients ModeI
Meta-analysis results
Gender distribution
Relevant data regarding the clinicopathological characteristics of 8697 patients with COVID-19 was collected.6-813-64 Significant heterogeneity was observed across all included studies (I2=93.7%), therefore, a random- effects model was used in the meta- analysis. We found that 53.3% (95%CI 50.3 to 56.4) of the patients were male.
Clinical symptoms
Two major symptoms, including fever (78.4%) and cough (58.3%), were highly prevalent among patients. Fatigue (34%), myalgia (21.9%), expectoration (23.7%), anorexia (22.9%), chest tightness (22.9%) and dyspnoea (20.6%) also occurred frequently. Less frequent symptoms were nausea and vomiting (6.6%), diarrhoea (8.2%), headache (11.3%), pharyngalgia (11.6%), shivering (15.2%) and rhinorrhea (7.3%). Only 5.4% of patients with COVID-19 were found to be asymptomatic (table 2).
Pathological characteristics
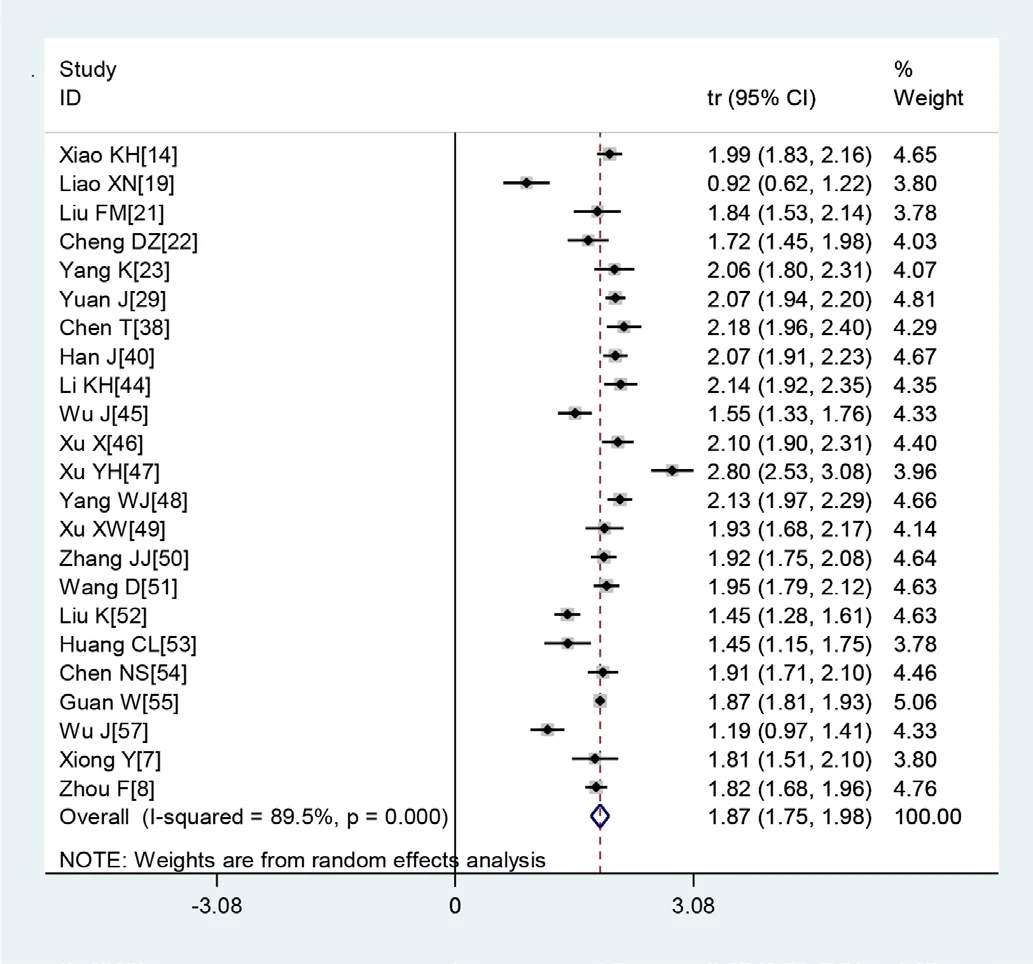
Figure 2 Transformed incidence rate of normal leucocyte count in patients with COVID-19.
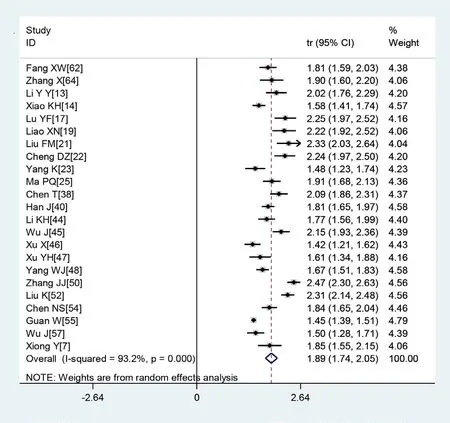
Figure 3 Transformed incidence rate of high C reactive protein levels in patients with COVID-19.
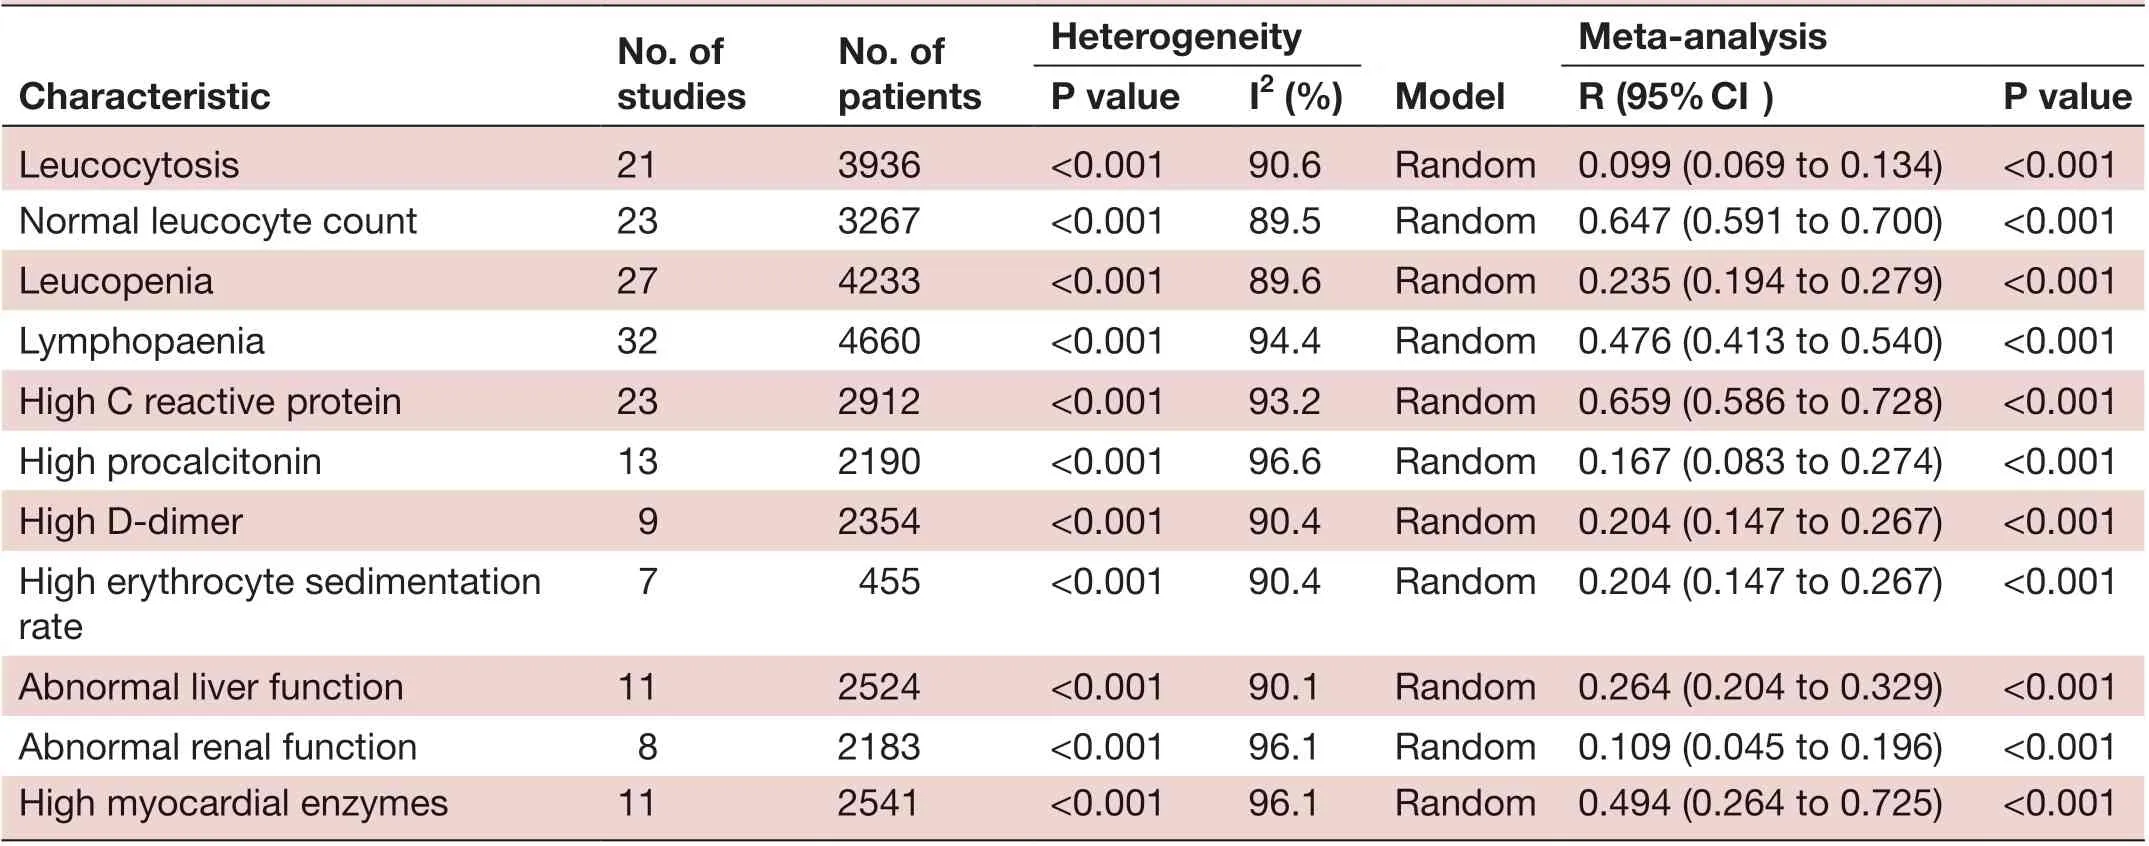
No. of studies No. of patients Heterogeneity Characteristic ModeI Meta- anaIysis P vaIue I2 (%) R (95% CI) P vaIue Leucocytosis 21 3936 <0.001 90.6 Random 0.099 (0.069 to 0.134) <0.001 Normal leucocyte count 23 3267 <0.001 89.5 Random 0.647 (0.591 to 0.700) <0.001 Leucopenia 27 4233 <0.001 89.6 Random 0.235 (0.194 to 0.279) <0.001 Lymphopaenia 32 4660 <0.001 94.4 Random 0.476 (0.413 to 0.540) <0.001 High C reactive protein 23 2912 <0.001 93.2 Random 0.659 (0.586 to 0.728) <0.001 High procalcitonin 13 2190 <0.001 96.6 Random 0.167 (0.083 to 0.274) <0.001 High D- dimer 9 2354 <0.001 90.4 Random 0.204 (0.147 to 0.267) <0.001 High erythrocyte sedimentation rate 7 455 <0.001 90.4 Random 0.204 (0.147 to 0.267) <0.001 Abnormal liver function 11 2524 <0.001 90.1 Random 0.264 (0.204 to 0.329) <0.001 Abnormal renal function 8 2183 <0.001 96.1 Random 0.109 (0.045 to 0.196) <0.001 High myocardial enzymes 11 2541 <0.001 96.1 Random 0.494 (0.264 to 0.725) <0.001
A large proportion of patients had normal leucocyte counts (64.7%) and high levels of C reactive protein (65.9%) (figures 2 and 3). Lymphopaenia was observed in many patients (47.6%), along with elevated levels of myocardial enzymes (49.4%) and abnormal liver function (26.4%). Also observed were leucopenia (23.5%), leucocytosis (9.9%), abnormal renal function (10.9%), elevated levels of D- dimer (20.4%), elevated erythrocyte sedimentation rate (20.4%) and elevated procalcitonin (16.7%) (table 3).
Subgroup analysis
Patients were stratified into two groups based on the date of initial diagnosis: group 1 included all patients and group 2 included those diagnosed between December 2019 and 31 January 2020 (table 4). We found that all patients diagnosed before 31 January had higher incidence rates of fever and cough. No significant difference was observed in the heterogeneity between the subgroups and the overall heterogeneity, indicating that the date of initial diagnosis was not the main source of heterogeneity.
Sensitivity analysis
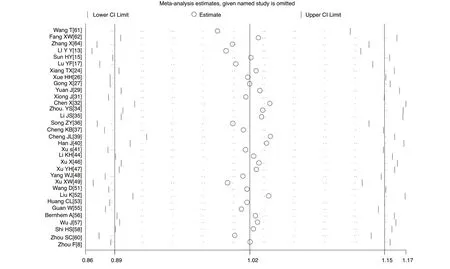
A sensitivity analysis was carried out by excluding one study at a time and reanalysing the entire dataset. We found that the pooled incidence rates did not change substantially, indicating the reliability and stability of our meta- analysis (eg, figure 4).
Evaluation of publication bias
The p values derived using the Egger’s and the Begg’s test for all the clinicopathological characteristics showed no obvious publication bias (table 5). A funnel plot based on the incidence rate of fever showed p values of 0.091 in Egger’s test and 0.703 in Begg’s test (figure 5). These results confirm that there is no publication bias.
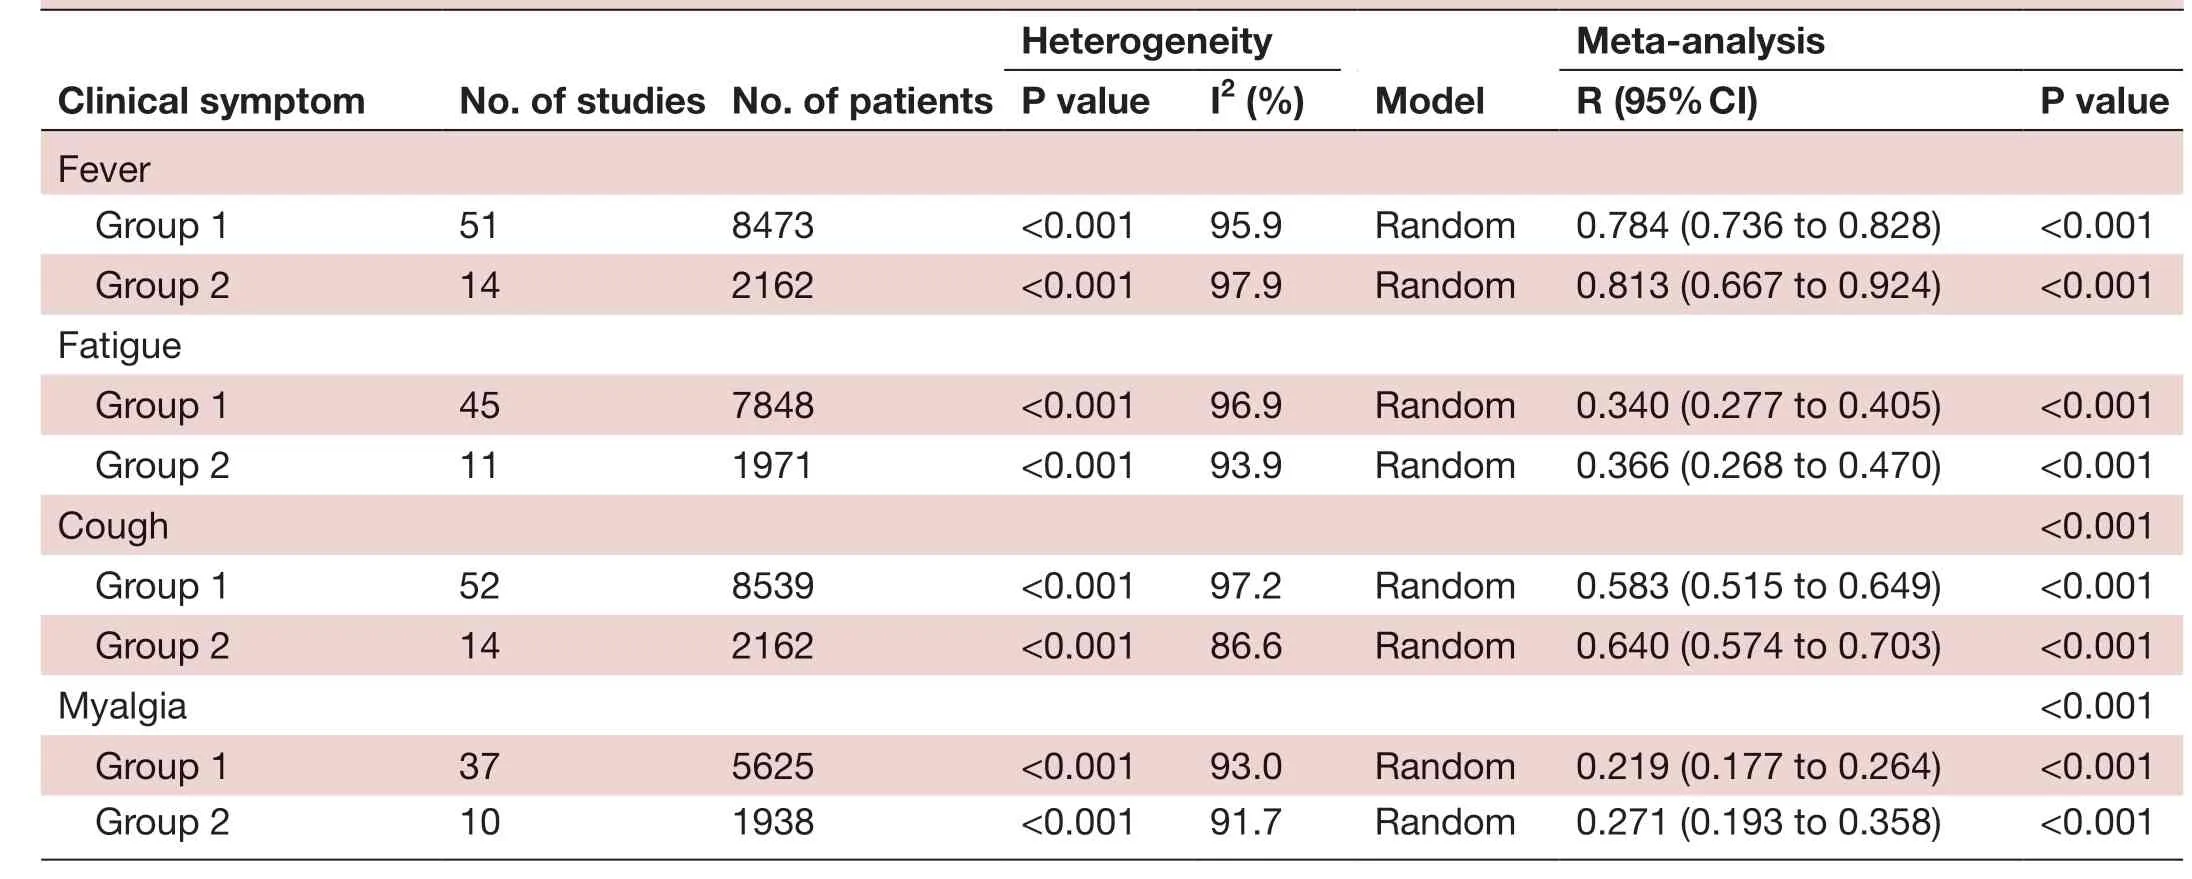
Heterogeneity CIinicaI symptom No. of studies No. of patients ModeI Meta- anaIysis P vaIue I2 (%) R (95% CI) P vaIue Fever Group 1 51 8473 <0.001 95.9 Random 0.784 (0.736 to 0.828) <0.001 Group 2 14 2162 <0.001 97.9 Random 0.813 (0.667 to 0.924) <0.001 Fatigue Group 1 45 7848 <0.001 96.9 Random 0.340 (0.277 to 0.405) <0.001 Group 2 11 1971 <0.001 93.9 Random 0.366 (0.268 to 0.470) <0.001 Cough <0.001 Group 1 52 8539 <0.001 97.2 Random 0.583 (0.515 to 0.649) <0.001 Group 2 14 2162 <0.001 86.6 Random 0.640 (0.574 to 0.703) <0.001 Myalgia <0.001 Group 1 37 5625 <0.001 93.0 Random 0.219 (0.177 to 0.264) <0.001 Group 2 10 1938 <0.001 91.7 Random 0.271 (0.193 to 0.358) <0.001
DISCUSSION
In this meta- analysis, we examined 55 independent studies6-813-64 reporting clinicopathological data on 8697 patients with COVID-19 distributed across 31 provinces in China. The studies included in this analysis comprise the latest research available on COVID-19 through 16 March 2020. Our results indicate that there is a slightly higher proportion of male patients (53.3%) and that the main symptoms of this disease are fever (78.4%), cough (58.3%) and fatigue (34%). Compared with previous results,910 our findings reveal lower incidence rates of the two major symptoms of this disease, which we found to depend to some extent on whether diagnosis was made before or after 31 January 2020, reflecting with the progress of the epidemic, the number of atypical manifestations has growed gradually. For example, some patients developed gastrointestinal symptoms, such as diarrhoea, nausea and vomiting. These results highlight the importance of also taking into account non- respiratory symptoms of the disease.
Most patients with COVID-19 showed normal leucocyte counts and lymphopqenia. Few patients had leucocytosis and elevated procalcitonin levels, confirming that this disease is transmitted by a virus. Therefore, it is essential for clinicians to use such pathological findings to rule out the presence of bacterial infections. In this study, 49.4% of the patients presented with myocardial enzyme spectrum abnormalities, which manifested as an increase in lactate dehydrogenase levels. Studies have shown that elevated levels of lactate dehydrogenase can be a risk factor for rapid progression from mild to critical COVID-19.65Therefore, monitoring the function of important organs during treatment is critical, and treatment should be adjusted as needed to preserve and maintain organ function.
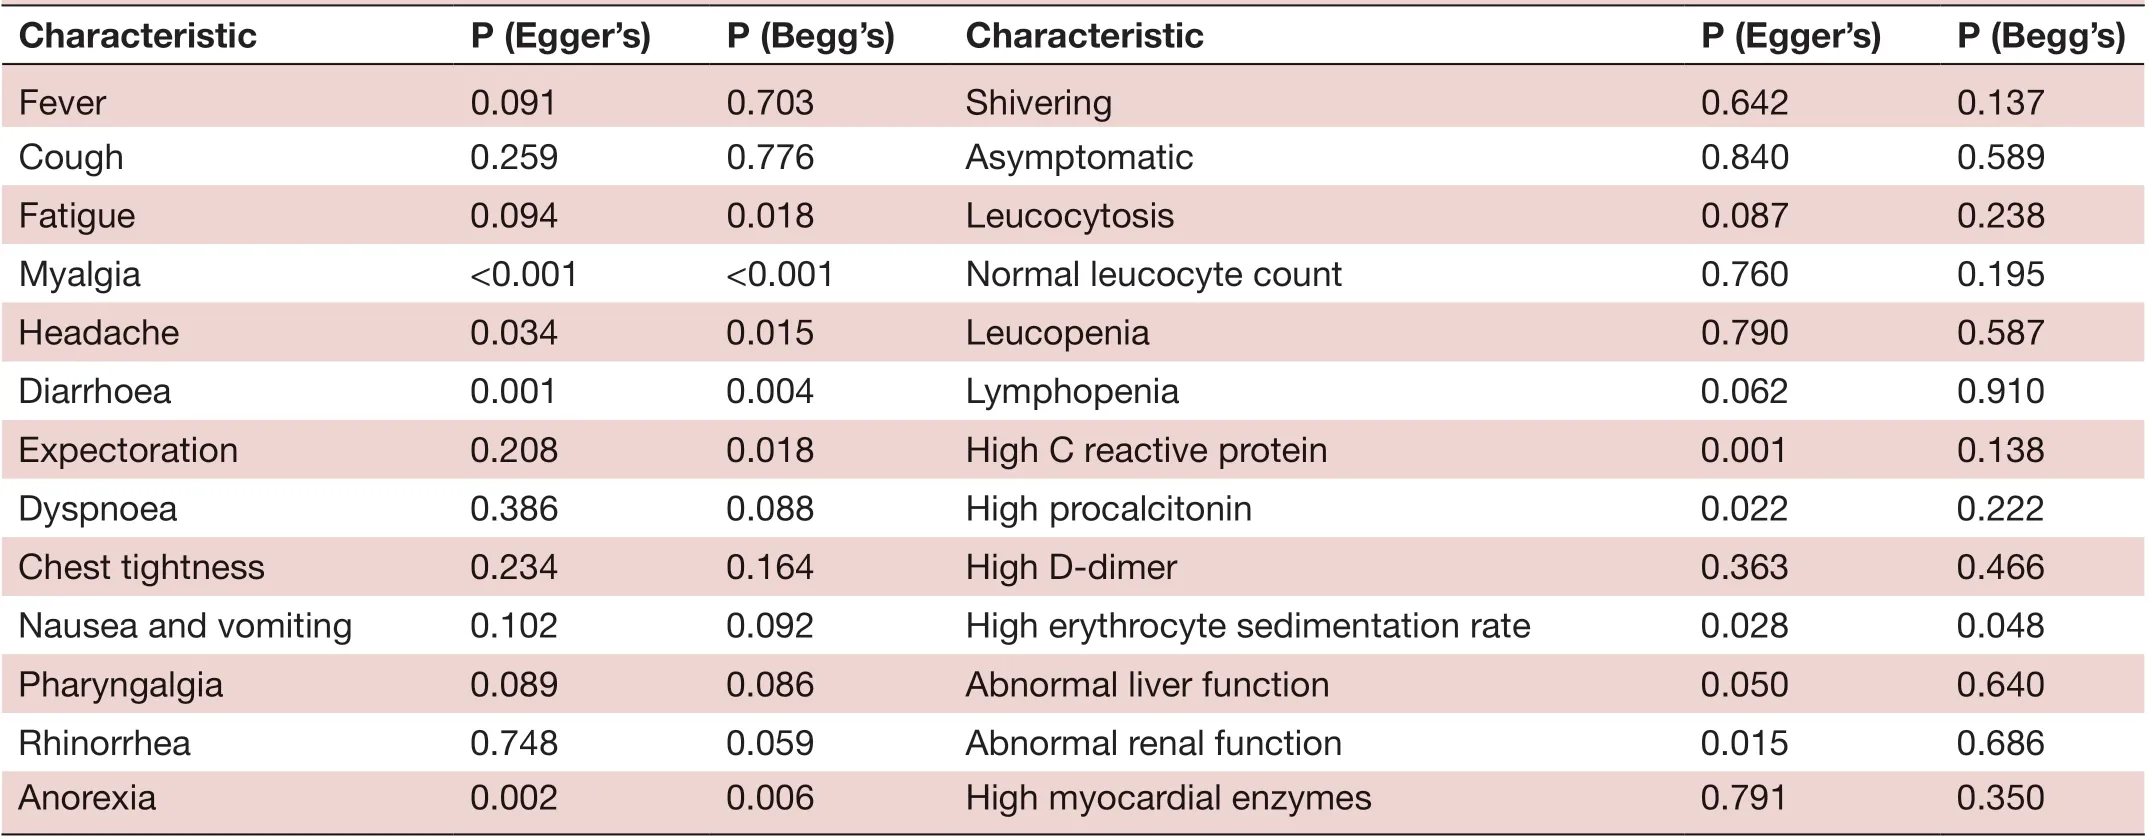
Characteristic P (Egger’s) P (Begg’s) Characteristic P (Egger’s) P (Begg’s)Fever 0.091 0.703 Shivering 0.642 0.137 Cough 0.259 0.776 Asymptomatic 0.840 0.589 Fatigue 0.094 0.018 Leucocytosis 0.087 0.238 Myalgia <0.001 <0.001 Normal leucocyte count 0.760 0.195 Headache 0.034 0.015 Leucopenia 0.790 0.587 Diarrhoea 0.001 0.004 Lymphopenia 0.062 0.910 Expectoration 0.208 0.018 High C reactive protein 0.001 0.138 Dyspnoea 0.386 0.088 High procalcitonin 0.022 0.222 Chest tightness 0.234 0.164 High D- dimer 0.363 0.466 Nausea and vomiting 0.102 0.092 High erythrocyte sedimentation rate 0.028 0.048 Pharyngalgia 0.089 0.086 Abnormal liver function 0.050 0.640 Rhinorrhea 0.748 0.059 Abnormal renal function 0.015 0.686 Anorexia 0.002 0.006 High myocardial enzymes 0.791 0.350
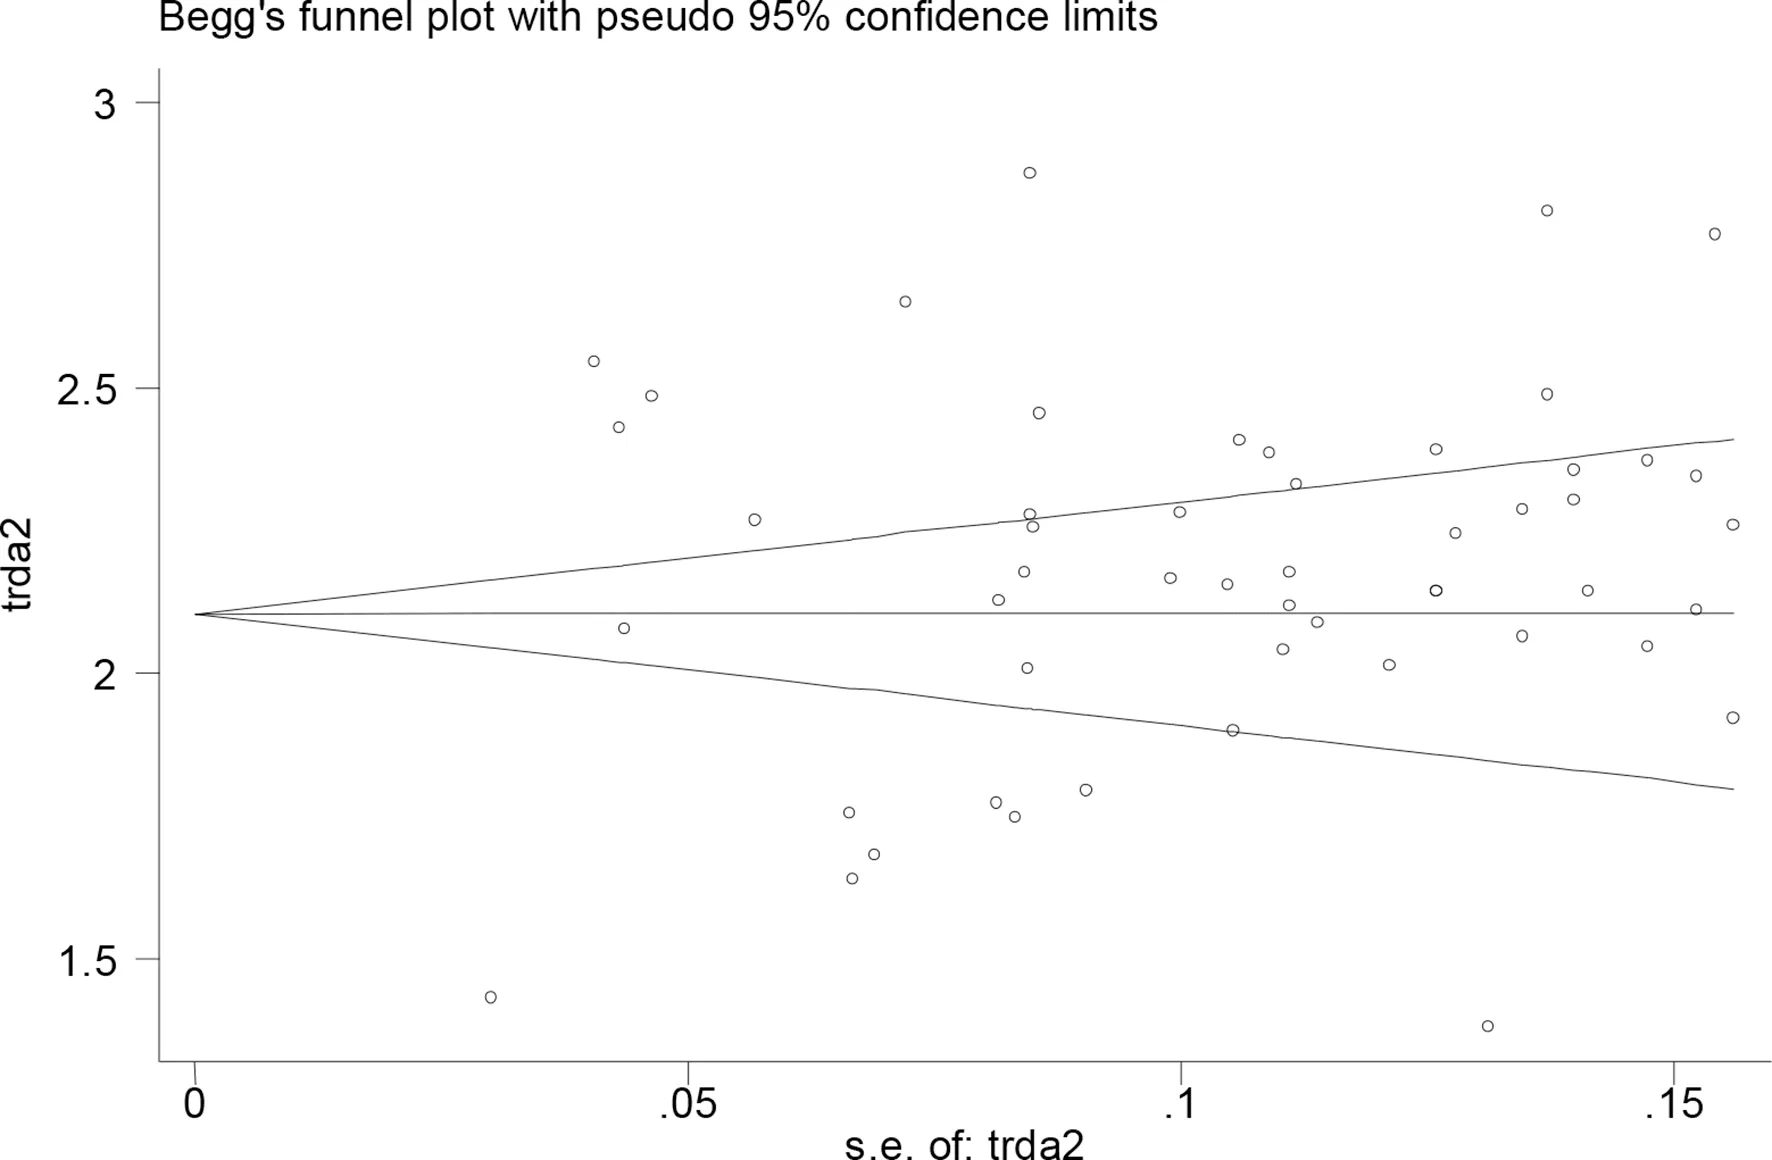
Figure 5 Evaluation of publication bias using a funnel plot based on the incidence rate of fever.
Infected people who are asymptomatic can act as a source of infection,66especially since the estimated median incubation period is 5-6 days (range 0-14 days). An analysis by the Chinese Center for Disease Control and Prevention conducted through 17 February 2020 suggested that the proportion of asymptomatic patients was only around 1%,67but our results suggest that the proportion is closer to 5%. This increase may reflect the growing experience of hospitals with this novel disease and increasing screening of suspected COVID-19 cases for viral infection, allowing the correct diagnosis of greater proportions of patients showing no or less typical manifestations. Therefore, to control the spread of this disease, general practitioners should carefully monitor individuals with histories of contact in areas where outbreaks have occurred or who had contact with suspected or confirmed cases of COVID-19 within 14 days before onset of symptoms.68Epidemiological history of patients should be investigated in detail, and asymptomatic infected people in the community should be identified as quickly as possible to control spread of the disease.
A recent study suggests that, considering different scenarios, highly eあective contact tracing and case isolation are sufficient to control a new outbreak of COVID-19 within 3 months.69Therefore, isolation, quarantine, social distancing, and community containment measures should be rapidly implemented in high- risk countries or regions.70In China, community engagement has been the first line of defence in the battle against the COVID-19 pandemic. General practitioners act as both gatekeepers and health promoters by educating the public and guiding the community in the fight against this disease.71Monitoring people at designated checkpoints, intercepting transmission routes in a timely manner and preventing local outbreaks are critical to prevent repeat epidemics.72
Although this study rigorously analysed clinical and laboratory data collected from a large sample of patients with COVID-19, we were unable to eliminate the significant heterogeneity observed between studies. For example, the course and the severity of the disease varied across studies. Given that most of the studies included in our meta- analysis were single- centre, retrospective studies, it was difficult for us to control for the effects of several confounding factors, including bias in patient admission and selection, as well as differences in disease severity and course. Further research is required to verify and extend our results for China. Continued surveillance across multiple countries, along with transparent and accurate reporting of patient characteristics and testing policies, will help us gain a better understanding of this global pandemic.73
CONCLUSION
In summary, Current evidence showed that the most commonly experienced symptoms of patients with COVID-19 were fever and cough. Myalgia, anorexia, chest tightness and dyspnoea were found in some patients. A relatively small percentage of patients were asymptomatic and could act as carriers of the disease. Most patients showed normal leucocyte counts, elevated levels of C reactive protein and lymphopenia, confirming the viral origin of the disease. Due to limited quality and quantity of the included studies, more high- quality prospective studies are required to verify above conclusions.
Correction noticeThis article has been corrected since it was published Online First. The article type has been modified from 'Original research' to 'Review'.
ContributorsPJ, JP and BL collected and analysed the data. HL helped collect the data. JZ acquired the funding. JZ designed the study, and wrote the first draft of the manuscript. CZ and JZ designed and supervised the study, and finalised the manuscript, which all authors read and approved.
FundingThis study was supported by grants from the National Natural Science Foundation of China (81960343); the Emergency Science and Technology Brainstorm Project for the Prevention and Control of COVID-19, which is part of the Guangxi Key Research and Development Plan (2020AB39028).
Competing interestsNone declared.
Patient consent for publicationNot required.
Provenance and peer reviewNot commissioned; externally peer reviewed.
Data availability statementData are available on reasonable request.
Open accessThis is an open access article distributed in accordance with the Creative Commons Attribution Non Commercial (CC BY- NC 4.0) license, which permits others to distribute, remix, adapt, build upon this work non- commercially, and license their derivative works on different terms, provided the original work is properly cited, appropriate credit is given, any changes made indicated, and the use is non- commercial. See: http:// creativecommons. org/ licenses/ by- nc/ 4. 0/.
 Family Medicine and Community Health2020年2期
- Family Medicine and Community Health的其它文章
- Suspected cases of COVID-19: study protocol for reporting characteristics and the outcomes
- Chronic pain care: time for excellence
- What is the meaning of health literacy? A systematic review and qualitative synthesis
- Non- communicable disease care and physical activity promotion in India: analysis of recent policies, guidelines and workplans
- Correction: Clinicopathological characteristics of 8697 patients with COVID-19 in China: a meta- analysis
- Tailoring lifestyle programmes for diabetes prevention for US South Asians
