
An Effective Method of Prompting Juvenile Rainbow Trout (Oncorhynchus mykiss) to Cope with Heat Stress
2020-03-09 05:15:44JIANGXuyangDONGShuanglinZHOUYangenGAOQinfengandPANZhe
JIANG Xuyang, DONG Shuanglin, 2), *, ZHOU Yangen, 2), GAO Qinfeng, 2),and PAN Zhe
An Effective Method of Prompting Juvenile Rainbow Trout () to Cope with Heat Stress
JIANG Xuyang1), DONG Shuanglin1), 2), *, ZHOU Yangen1), 2), GAO Qinfeng1), 2),and PAN Zhe1)
1),,266100,2),,266235,
In the present study, juvenile rainbow trout () were acclimated at 5 temperatures. Fish in the con- trol group (C0) were reared at a constant temperature (16℃); trout in four other treatments (A0, A3, A6, and A9) were acclimated to a high temperature (22℃) for 0, 3, 6, and 9d, respectively, and then returned to normal temperature (16℃) for 7d. The temperature was then raised to 20℃ and the fish were cultured for 40d. The results showed that the growth rates of A3, A6,and A9were higher than that of A0but lower than that of C0. The growth rate of A9was the highest among the 4 acclimation groups. The activities of serum transaminase and liver antioxidant enzyme significantly increased during acclimation. At the beginning of growth, the activities of enzymes were lower in A3, A6,and A9with the lowest in A9. In addition, the transcript abundance of heat shock protein (HSP) 60 gene in A9was not significantly different from that of C0during growth.in A9significantly increased at the beginning and returned to that of C0at the end. Our findings indicated that pre-acclimation improved the high temperature tolerance with the best effectiveness observed at 22℃ for 9d. A possible mechanism underlining such phenomenon is the improvement of antioxidant de- fense system.
temperature acclimation; enzyme activity; growth performance; heat shock protein; rainbow trout
1 Introduction
Salmonid cannot be farmed as in some countries like Norway and Chile due to higher surface water temperature of open sea. In recent years, such limitation has been lifted to some extent due to the use of mariculture vessels and submersible cages in some areas of Yellow Sea Cold Wa- ter Mass (Dong, 2019). Rainbow trout () is a commercially important cold-adapted fish species, and its yield is the second highest among Salmo- nidae(Pauly and Zeller, 2017).
Water temperature is the most important external factor affecting fish growth (Dowd., 2006; Pirozzi and Booth, 2009; Sun and Chen, 2014; Besson., 2016). The meta- bolism and the feeding rate, health, stress response, growth, and survival of fish can be affected by water temperature to some extent(Dominguez., 2004; Afonso., 2008; Tromp., 2016). Such influence has been documented in many fish species, for example, eelpout () (Ronisz., 1999), cobia () (Sun and Chen, 2014), lumpfish (L)(Nytro., 2014) among others. Similarly, rain- bow trout has experienced the challenge of both long-term and short-term high temperatures such as global warming, seasonal alternations and extreme weathers. Accordingly, reducing the negative effect of high temperature is of great importance to farming this species.
Early studies have shown that temperature tolerance can be improved through acclimation, a phenomenon that shifts the thermal optima allowing organisms to survive at temperature regimes deviant from their preferred thermal win- dow (Young and Cech, 1996; Meyer and Santarius,1998; Li., 2018). For example, acclimation was proven to reduce thermal sensitivity of oxygen consumption rate and improve heat tolerance in freshwater amphipod (Koch) (Semsar-kazerouni and Verberk,2018). Acclimation to a relatively warmer temperature strengthened the thermal tolerance in European diving beetles(Calosi., 2010) and the red flour beetle () (Scharf., 2015). Additionally, the heat tolerance of two tropical Atlantic rocky reef fish species was enhanced by increasing critical ther- mal maxima values in warm acclimation (Madeira., 2017). Notably, Linton. (1998) proved that warm ac- climation also positively affects the heat tolerance of rain- bow trout. A slight but significant elevation in lethal tem- perature was exhibited in juvenile rainbow trout without feed limitation and exposed to a warming scenario of +2℃(Linton., 1998). Consequently, the temperature at which stress begins to occur is largely dependent on the previous exposure history of fish, and acclimation may be one way of coping with stress conditions (Beitinger and Bennett, 2000).
Heat shock proteins (HSPs), a molecular chaperone fam- ily, play important ecological and evolutionary roles in thermal adaptation and are commonly used as heat stress biomarkers (Parsell and Lindquist, 1993; Feder and Hof- mann, 1999; Madeira., 2014). In addition, HSPs are considered to work as sensors of cellular redox changes (Kalmar and Greensmith, 2009) and have been proved to activate scavengers of reactive oxygen species (ROS), such as peroxidases, superoxide dismutase, and catalase, to re- duce the flux of ROS produced in oxidative metabolism (Madeira., 2013). HSP60 is a stress-inducible, well- characterized chaperone (Martin., 1992; Soltys and Gupta, 1996). HSP60 can elicit a potent proinflammatory response in cells of the innate immune system and has therefore been hypothesized to be a ‘danger signal’ of stressed or damaged cells (Ohashi., 2000).HSP70 is the most intensively studied HSP.It is usually synthe- sized at high levels in various tissues of animals, and is considered to have a major role in protein metabolism of cells (Nakano and Iwama, 2002). Available observations provide strong supports to the role of HSP60 and HSP70 in thermo-tolerance (Solomon., 1991; Sharma.,2006; Bahrndorff., 2009; Shatilina., 2011; Wang., 2016).
The aim of the present study was to determine whether different high temperature acclimations can be used as a method for enabling rainbow trout tocope with heat stress,and to discover the mechanism of improving high temper- ature tolerance.
2 Materials and Methods
2.1 Fish and Holding Conditions
The juvenile rainbow trout were obtained from Wanze-feng Fishery Co., Ltd. (Rizhao, Shandong Province, China)with an initial weight of 41.1±0.9g. The fish were stocked in an aerated fiberglass tank (6m diameter, 1.2m depth, 28.26?m3 water). Prior to the experiment, the fish were randomly divided into fifteen tanks (175L), 30 fish per tank, and adapted to laboratory conditions for 2 weeks (feeding with a commercial feed). Average dissolved oxygen, temperature, photoperiod, and salinity were 9.0±0.2mgL?1, 16.2±0.5℃, 12h:12h (light/dark), and 0.3, respectively. In order to eliminate the effects of dissolved oxygen levels at different temperatures, dissolved oxygen levels were regulated by adjusting the amount of aeration. Water temperature was regulated by the automatic temperature control system. Approximately 50% of the water in each tank was replaced daily. The tanks were continuously supplied with water at a constant flow rate (71cm3min?1). The nitrite, nitrate, ammonia, and acidity of the tank water were monitored once a week during the experiment and the parameters were maintained within reasonable limits for rainbow trout.
2.2 Temperature Acclimation and Recovery Period
After adaptation to the laboratory conditions, fish were randomly distributed into 5 specific treatment groups (threereplicates each treatment) as follows: control (C0, no accli- mation), 0-d acclimation (A0), 3-d acclimation (A3), 6-d acclimation (A6), and 9-d acclimation (A9) (Table 1). The method used for acclimation involved raising the water temperature from 16℃ to 22℃ at a rate of 1℃(4h)?1and maintaining the temperature of 22℃ for the duration of a specific treatment. The acclimation temperature was selected according to the critical thermal maximum of juvenile rainbow trout, which was obtained in a pre-test. The automatic temperature control system was used to control water temperature. The fish in all groups were not fed during the acclimation.
When the acclimation was completed, fish were al- lowed to recover at 16℃ for a week. During this process, fish were fed three times a day to apparent satiation using the diet mentioned above. Twenty individuals were kept each tank and used for the following growth experiment.
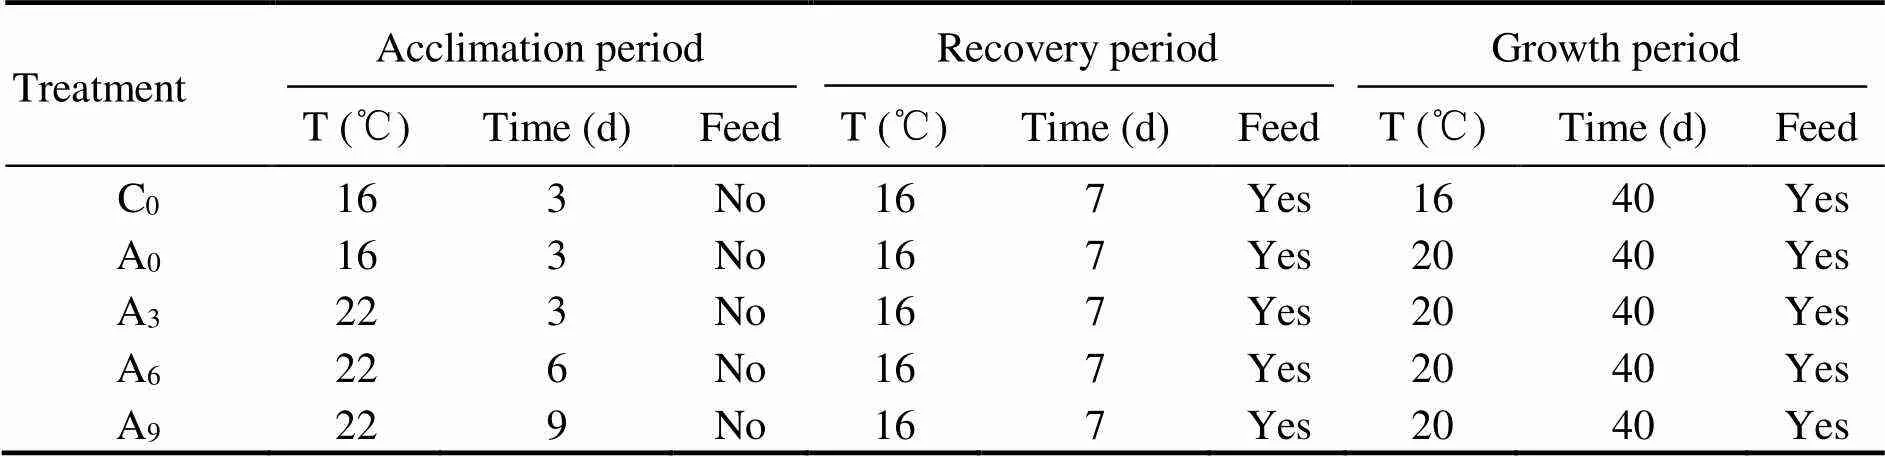
Table 1 Schematic representation of the whole experiment (acclimation, recovering and growth)
2.3 Growth Experiment at High Temperature
After recovery, the water temperature in A0, A3, A6,and A9was raised to 20℃ at a rate of 1℃(6h)?1and main- tained until the end of the experiment. The temperature of C0remained at 16℃. Fish were reared for 40d and hand- fed three times daily to apparent satiation using the same feed mentioned above. Uneaten feed residue and feces were removed by siphoning after 2h of feeding. The feed residue was separated and dried, and the weight was recorded.
2.4 Growth Performance and Related Factors
During 40-d growth experiment at high temperature, the fish were weighed as a group at 10d intervals and their feed intake data was recorded. For each 10-d period and for the whole experiment, growth performance and feed intake parameters were calculated. At the end of the experiment, the survival rate was calculated.
The following formula were used to calculate mean body weight, percent weight gain, specific growth rate (SGR), mean feed consumption, and feed coefficient (FC):

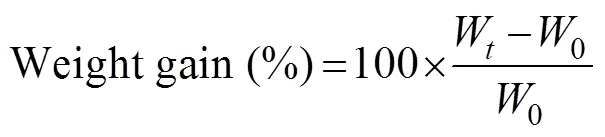


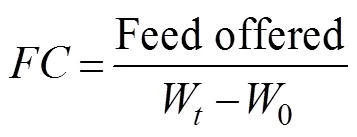
where0is initial body weight (gfish?1),Wis final mean weight (gfish?1), andis the number of days.
2.5 Blood and Tissue Sampling
Samples were collected at the beginning of the experi- ment (P1), the beginning of the acclimation (P2), the end of the acclimation (P3), the end of the recovery (P4), the beginning of the growth period (P5), and the end of the growth period (P6), respectively. At each sampling point, three individuals per tank were euthanized by excess tri- caine methane sulfonate (MS-222). Blood was collected from the caudal vein of experimental fish using a dispos- able syringe. The blood sample was collected in a centri- fuge tube without EDTA, allowed to clot for 1h at room temperature and then stored at 4℃ overnight. After cen- trifugation at 1500×for 10min, the serum was kept at ?20℃ for further analysis. The livers of the experimental fish were aseptically removed and flash frozen in liquid nitrogen.Then they were stored at ?80℃ for enzyme ac- tivity analysis, extraction of total RNA and real-time quan- titative polymerase chain reaction (qPCR) analysis in the future.
2.6 Determination of Antioxidant Enzyme Activities
The activities of superoxide dismutase (SOD), catalase (CAT), glutathione peroxidase (GPx), glutamic pyruvic transaminase (GPT), and glutamic oxaloacetic transami- nase (GOT) were measured using assay kits (Item number: A001-3, A007-2, A005, C009-1, C010-1, respectively), which were obtained from Nanjing Jiancheng Bioengineering Institute (Nanjing, China).
2.7 Gene Expression Analysis
Total RNA was isolated using TRIzol reagent accord- ing to the manufacturer’s instructions (Invitrogen, Carls- bad, CA, USA). The RNA samples were reverse-tran- scribed using Prime Script RT-PCR Kit (Takara, Tokyo, Japan). Equal amount of cDNA from various tissues were used for real-time quantitative RT-PCR. Specific primers for,, andbased on known rainbow trout sequences (Table 2) were designed by Oligo 7.0 Soft- ware and synthesized by Invitrogen Biotechnology Co., Ltd. in Shanghai, China. Reaction mixtures were incubated in the ABI PRISM 7500 real-time PCR system (Applied Biosystems, Foster City, CA, USA). The program includ- ed one cycle at 95℃ for 30s, 40 cycles at 95℃ for 5s, and 40 cycles at 60℃ for 34s. Dissociation curves were ana- lyzed by Dissociation Curve 1.0 Software (Applied Bio- systems) for each PCR reaction to detect and eliminate po-ssible primer-dimers and nonspecific amplification. The mRNA relative abundance was calculated according to the method of Pfaffl(2001).
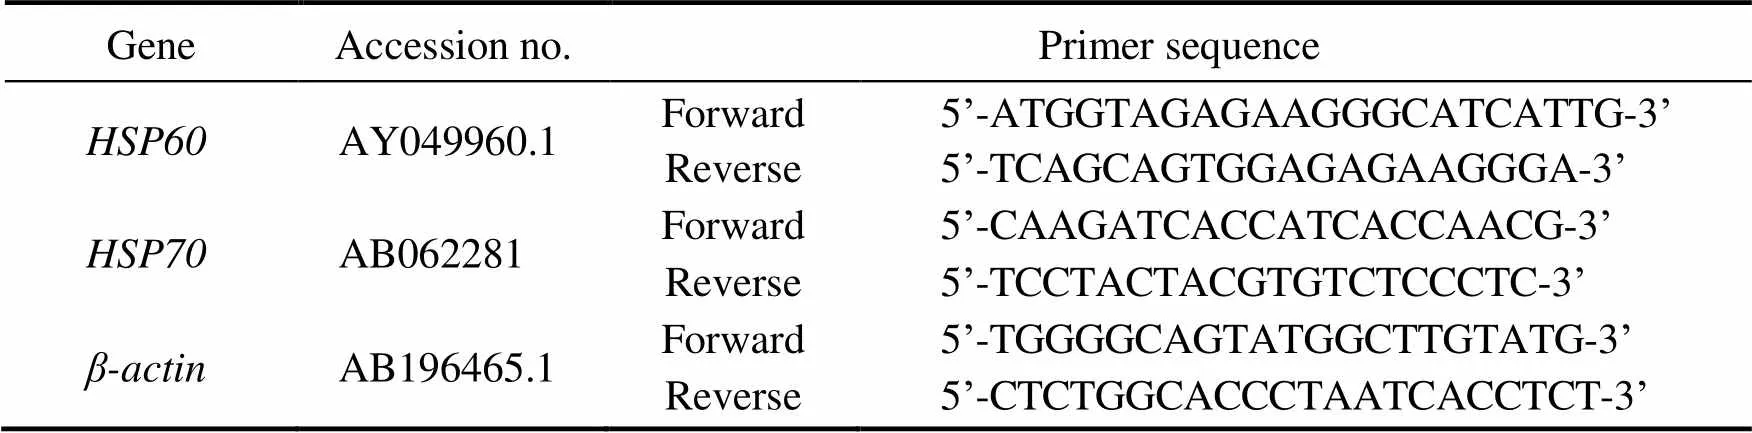
Table 2 Oligonucleotide primers used in the present study
2.8 Statistical Analysis
Statistical analyses were conducted using SPSS (Chi- cago, Illinois, USA). The K-S test was used to verify the normal distribution of the data. Graphs were performed using the GraphPad Prism 5.0 computer software. Dif- ferences between the means were assessed using Tukey’s honestly significant difference test for post hoc multiple comparisons. All data were expressed as the mean±SD, where<0.05 was considered significantly different.
3 Results
3.1 Growth Performance, Survival Rate, Feed Consumption and Feed Coefficient
The growth performance and survival rate of the fish during the 40-d growth experiment are presented in Table 3. The maximum mean body weight (164.13g) wasin C0and was significantly higher than that in other groups (<0.05). The mean body weight of A9was significantly high- er than those of A0, A3and A6(<0.05). During the 40-d growth period, the percent weight gain of A9was signifi- cantly lower than that of C0but significantly higher than those of A0, A3, A6and A9(<0.05).
In days 0–10, the SGR of A9was significantly higher than those of the other groups including C0(<0.05). In days 10–20, the SGR of A9declined while those of A0, A3, and A6increased, but no significant difference was ob- served among all groups (>0.05). In the second half of the growth period, the SGR of A0, A3, A6and A9declined further, and that of A9was always the highest of the four groups. During the whole growth period, the SGR of A9was significantly higher thanthose of A0, A3and A6(<0.05). Although the SGR of A9was still lower than that of C0, the difference was not as great as with the other groups.No death was observed in C0, A6and A9during the growth period, whereas the survival rates of A3and A0were rela- tively lower, and that of A0was significantly lower than those of C0, A6and A9(<0.05).
The feeding condition of the fish during the 40-d growth experiment is presented in Table 3. The feed consumption of A9was significantly greater than that of C0, A0, A3and A6in the early growth period (day 0–10), while there were no significant differences among these four groups. During the whole growth experiment, the feed consumption of each group increased gradually. Compared with C0, higher feed consumption was observed in all other groups, and signifi- cant differences were observed in A0, A3and A9(<0.05).
In the early growth period (day 0–10), no significant differences were found in the FC between A9and C0, which were significantly lower than those of A0, A3and A6(<0.05). The FC of A0, A3, A6and A9increased in the later 30d and was significantly higher than that of C0(<0.05). Overall, the FC of C0was the minimum and was signifi- cantly lower than that of A9, which was the second lowest (<0.05).
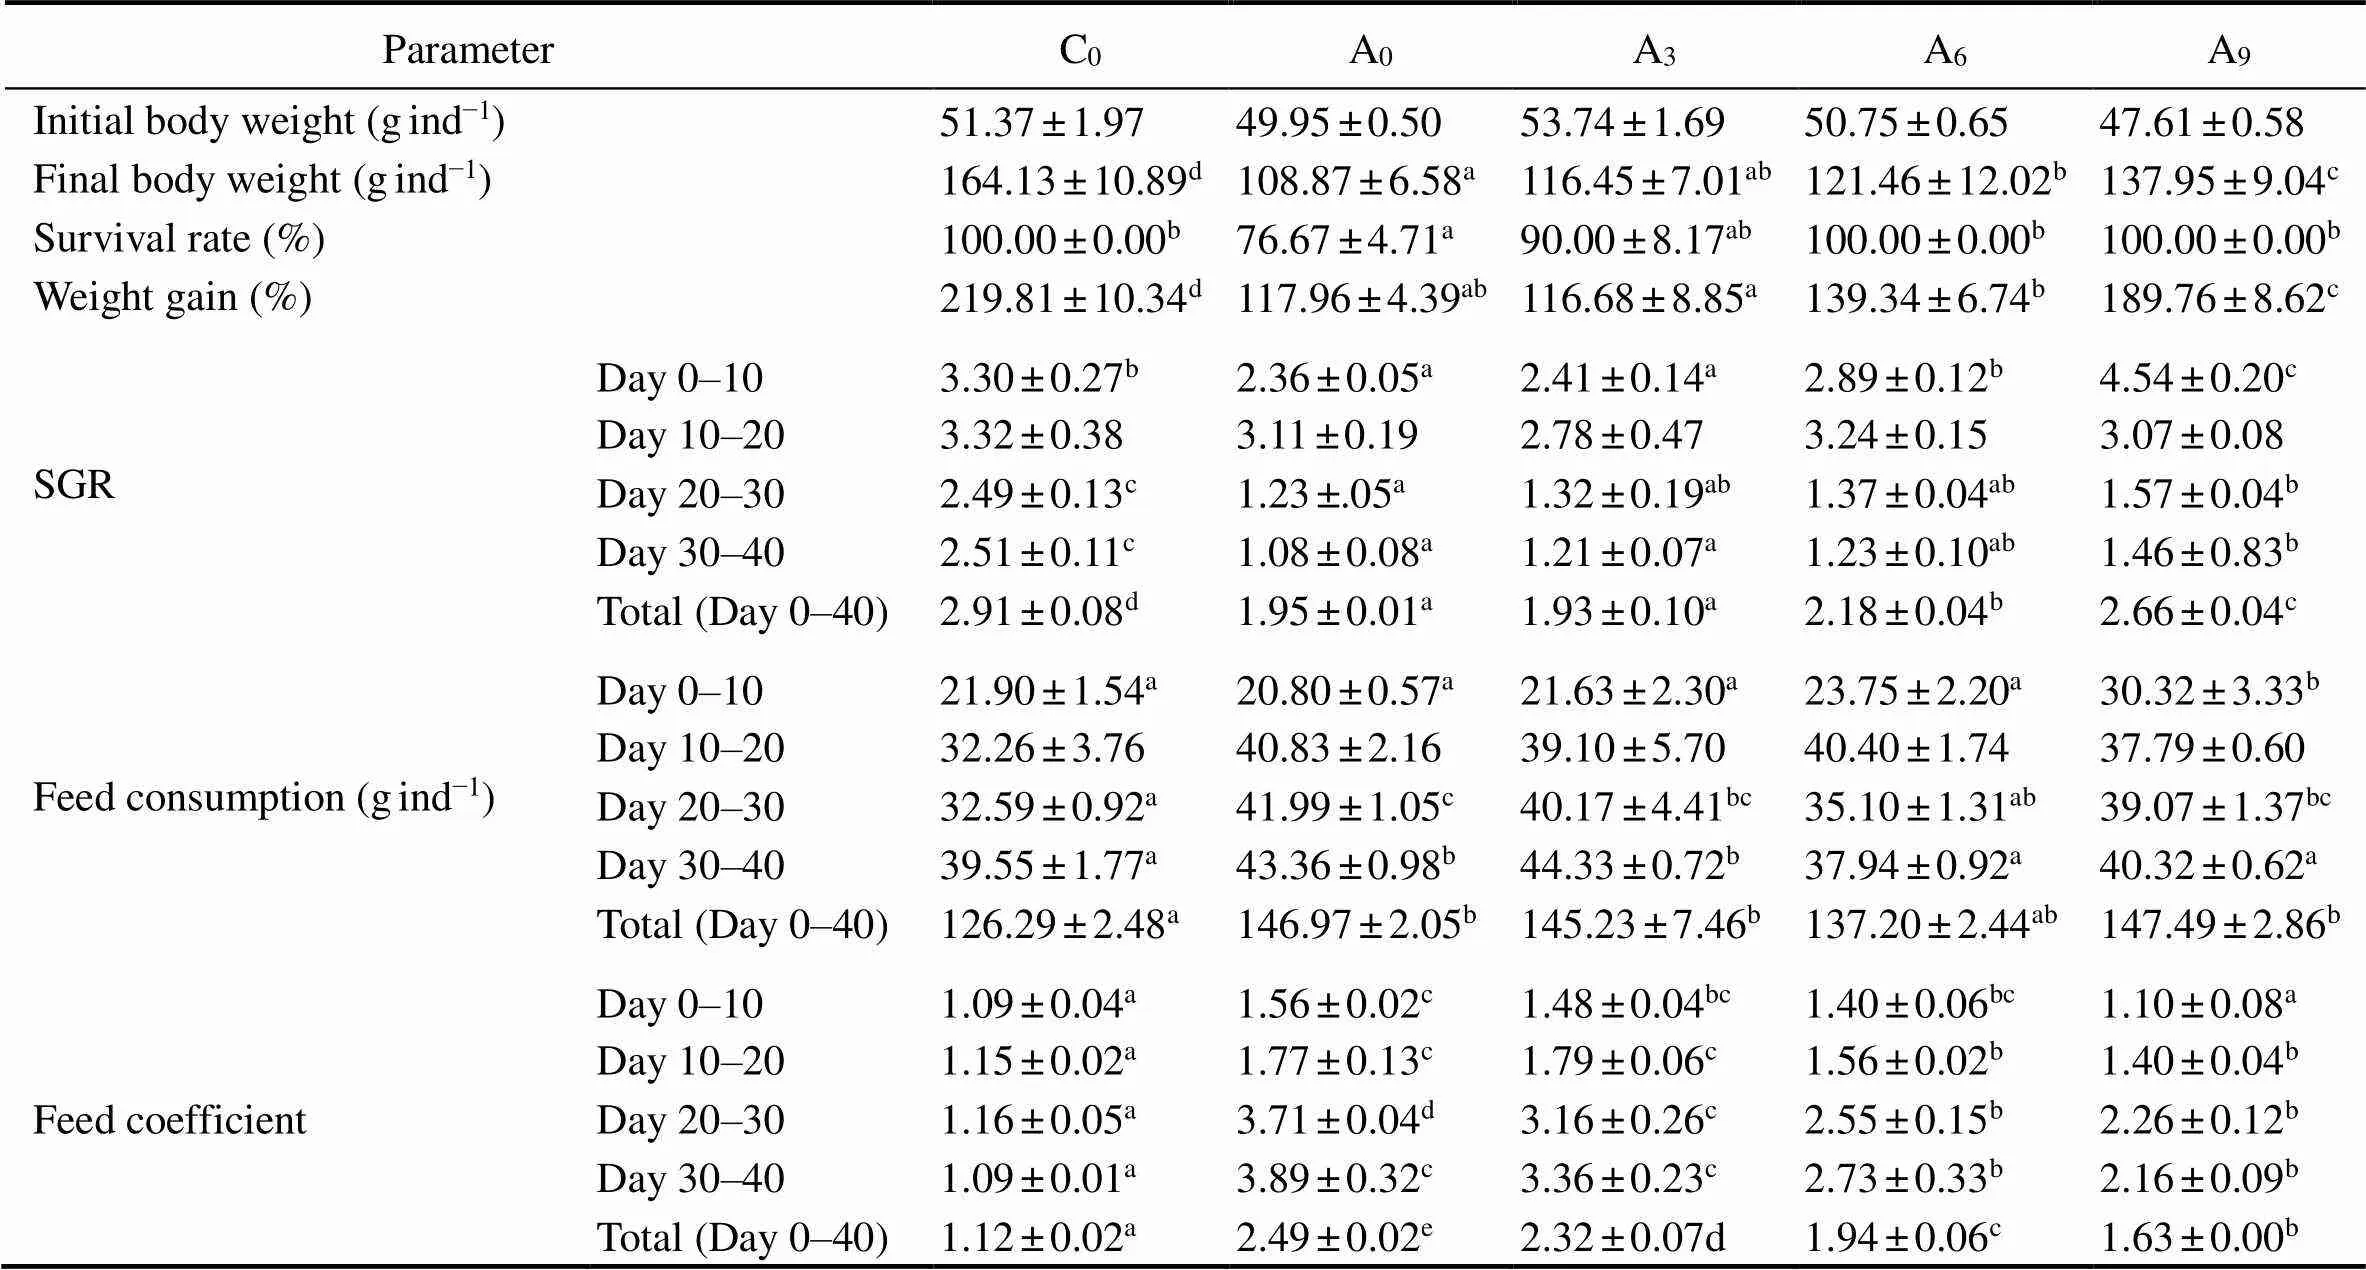
Table 3 Effects of temperature acclimation on growth, survival, and feeding conditions in rainbow trout
Note: Different letters indicate significant differences (<0.05) among treatments in the same period(=10; Mean±SE).
3.2 Hepatic Antioxidant Enzyme Activities
The activities of SOD, CAT, and GPx are presented in Fig.1. When the temperature was raised to 22℃ (P2), the activities of the enzymes increased significantly in A3, A6, and A9(<0.05), and the average SOD activities(Fig.1A), CAT activities(Fig.1b), and GPx activities(Fig.1C) in the three groups were 7.2, 4.0 and 3.3 times of that in groupC0, respectively. After acclimation, the activities of the three enzymes in each acclimated group were still significantly higher than those in C0(<0.05). At the beginning of the growth period (P5), antioxidant enzyme activities in each treatment group significantly increased again (<0.05), but the increment was lower than those at P2. The activi- ties of the three enzymes in A9were the lowest. At the end of the growth period (P6), the activities in A0, A3, and A6were still significantly higher than those of C0(<0.05), while no differences were observed between A9and C0.
3.3 Transaminase Activity in Serum
The transaminase activity in serum is presented in Fig.2.TheGPT activities of A3, A6and A9increased signifi- cantly at P2 (<0.05)., and decreased (A3>A6>A9) after acclimation (P3). When the growth experiment began (P5), activities of GPT and GOT peaked in A0and were sig- nificantly higher than those in other groups, while in A9they were significantly lower than those in other groups (<0.05). No significant differences were observed be- tween A3and A6. At P6, GPT activities in A3and A9re- turned to a level that was not significantly different from C0, which was the same as the GOT activity in A9.
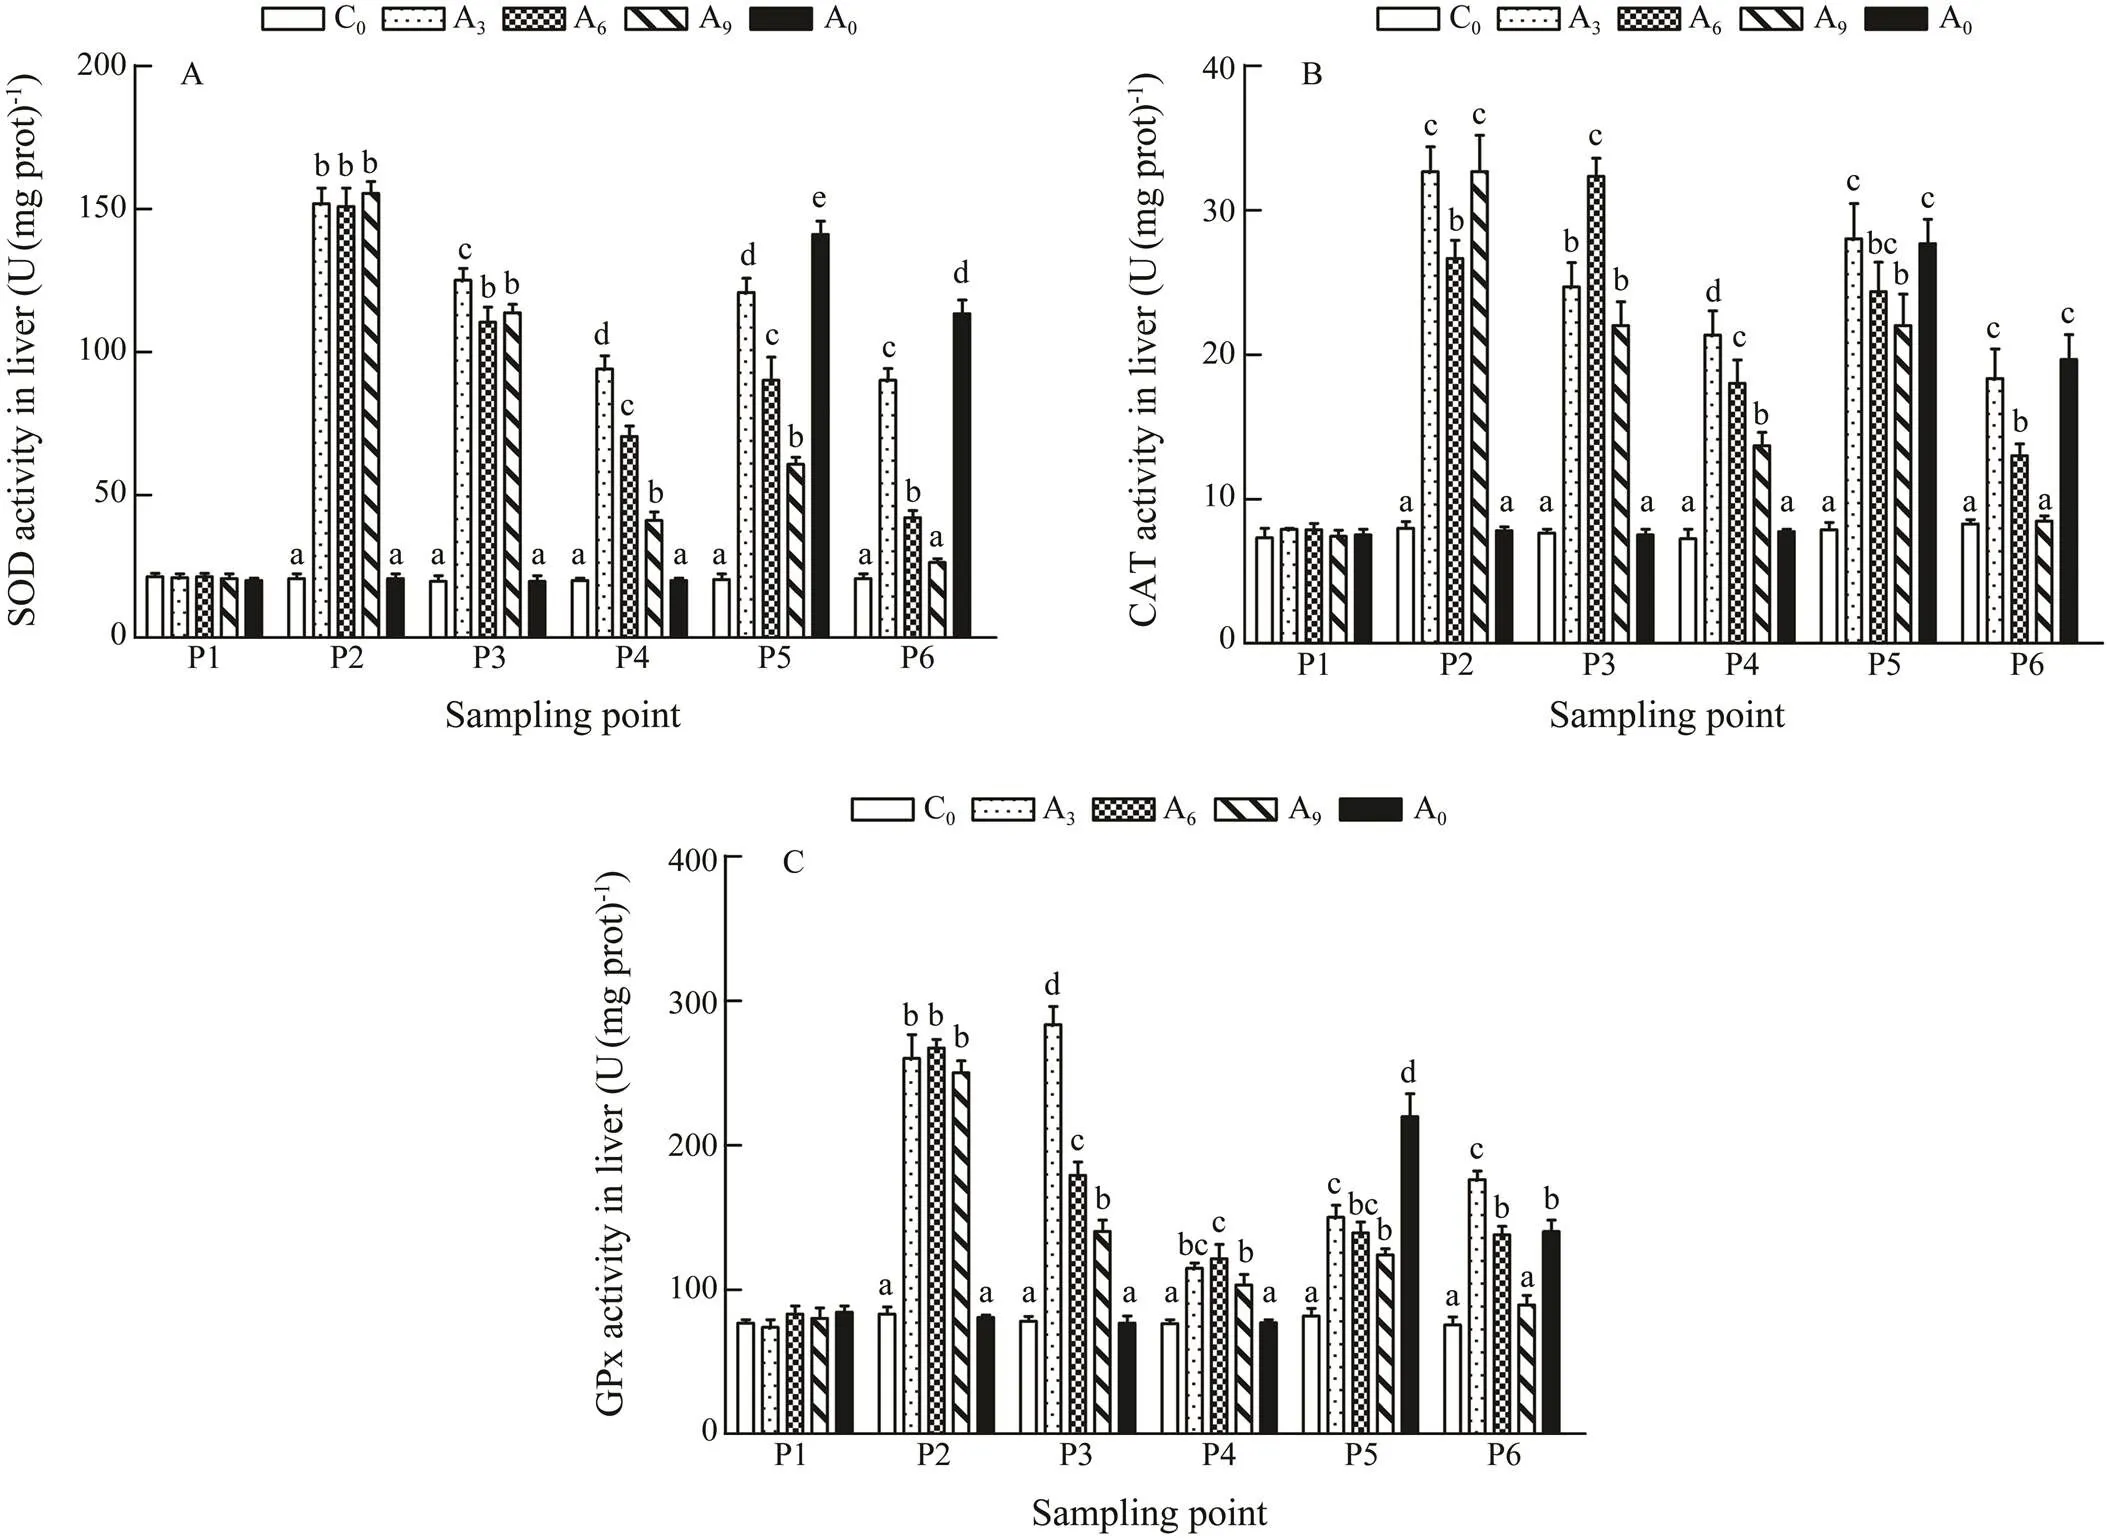
Fig.1 Effects of warm acclimation on the activities of antioxidant enzymes in the liver of juvenile rainbow trout. Bars with different letters in the same period (P1–P6) are significantly different (P<0.05, n=3). P1, the beginning of the whole experiment; P2, the beginning of the acclimation; P3, the end of the acclimation; P4, the end of the recovery; P5, the beginning of the growth period; P6, the end of the growth period.
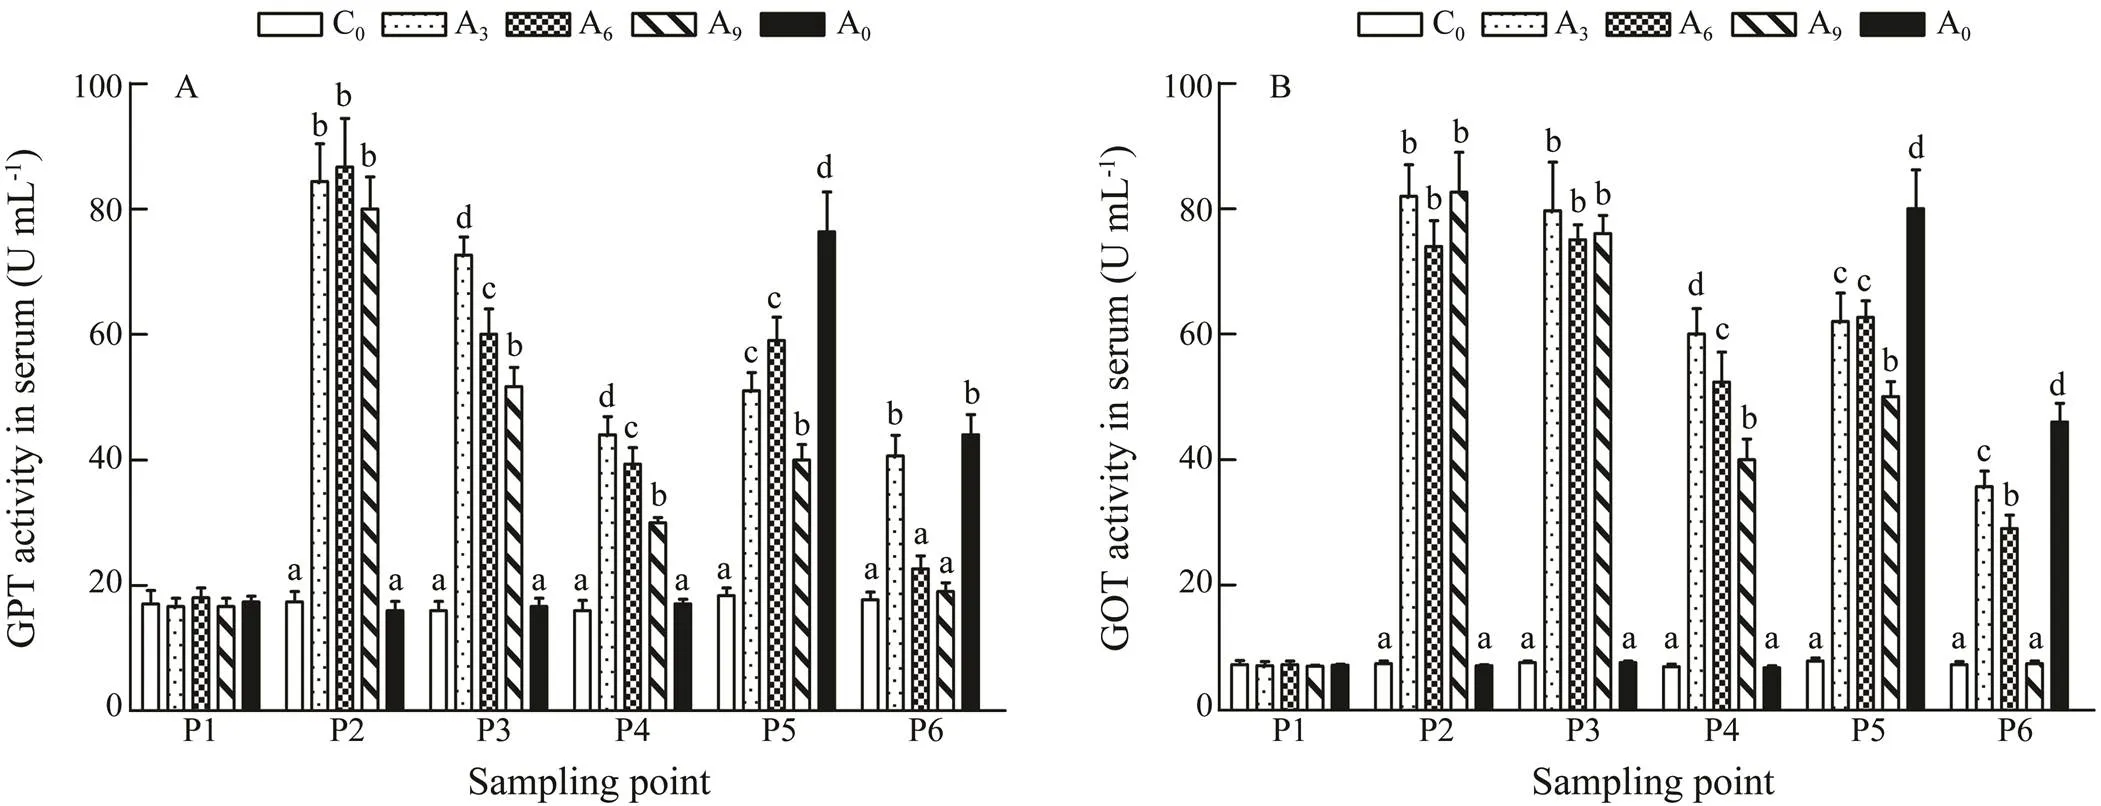
Fig.2 Effects of warm acclimation on transaminase activity in the serum of juvenile rainbow trout. Bars with different letters in the same period (P1–P6) are significantly different (P<0.05, n=3). P1, the beginning of the whole experiment; P2, the beginning of the acclimation; P3, the end of the acclimation; P4, the end of the recovery; P5, the beginning of the growth period; P6, the end of the growth period.
3.4 Expression of HSP60 and HSP70 Genes
The result of RT-PCR showed that transcriptional lev- els of(Fig.3A) were significantly upregulated at P2 in A3, A6,and A9(<0.05). After 6d and 9d of accli- mation (P3), the expression ofwas significantly lower than that acclimated for 3d (<0.05) and was low- er than the levels at P2. In contrast, the expression ofin A3at P2 was higher than that of P1, and after 7d of recovery (P4), it was still at a high level. During the growth experiment (P5 and P6), the expression ofin A0, A3, and A6was significantly higher than in C0(<0.05), while no significant difference was found between A9and C0.
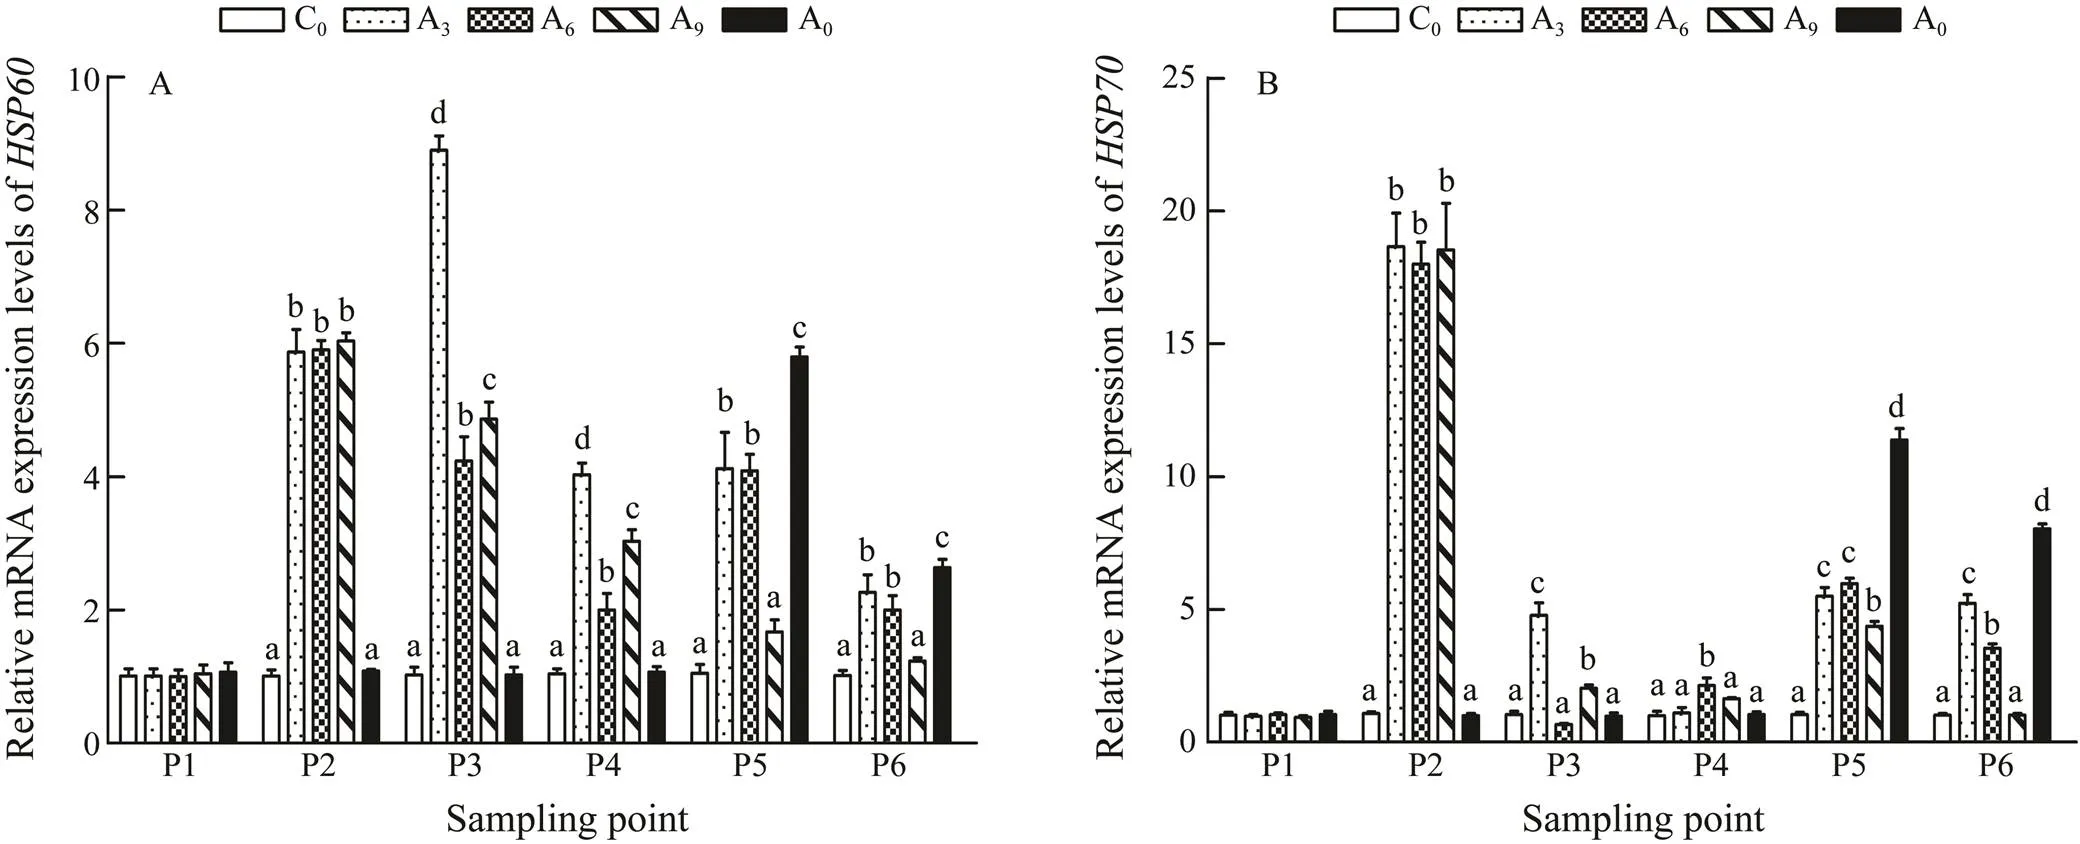
Fig.3 Effects of warm acclimation on gene expression of HSP60 and HSP70 in the liver of juvenile rainbow trout. Bars with different letters in the same period (P1–P6) are significantly different (P<0.05, n=3). P1, the beginning of the whole experiment; P2, the beginning of the acclimation; P3, the end of the acclimation; P4, the end of the recovery; P5, the beginning of the growth period; P6, the end of the growth period.
The rapid increase in temperature caused a significant upregulation ofexpression, and the mean expression level in A3, A6and A9was 16.7 times of that in C0(Fig.3B). When high temperature was experienced once again, the expression levels ofin A3, A6and A9were also upregulated but lower than those at P2, while A9was the lowest in these three groups. However, the expression ofin A0was significantly higher than those in other groups (<0.05).
4 Discussion
Rainbow trout is a cold-adapted fish with an optimum water temperature range between 12 and 18℃. When the water temperature is higher than 20℃, its appetite re- duced and growth slowed down. When the temperature exceeds 24℃, feeding stops, and then the fish gradually weakens and dies. When rainbow trout are cultivated in ponds and open seas, water temperatures often exceed 20℃. How to improve the high-temperature tolerance of rainbow trout is an important issue to be solved in aqua- culture.
Studies have shown that the upper lethal temperature limit of rainbow trout can be increased by thermal accli- mation (Linton., 1998; Sappal., 2015). The re- sults of this study indicated that after high temperature acclimation at 22℃ for 0d (A0), 3d (A3), 6d (A6), and 9d (A9), rainbow trout responded differently when they ex- perienced high temperature again at 20℃. When the en- vironment temperature was 20℃, the SGR (2.18 and 2.66) of A6and A9increased by 11.8% and 36% respectively compared with A0(1.95) after 40d, while the difference of SGR between A3and A0was not significant (Table 3). It was observed that the tolerance of rainbow trout to a high temperature of 20℃ was enhanced by acclimation at 22℃ for 9d, especially in the first 20 days. Therefore, the thermal acclimation is helpful for increasing the upper lethal temperature limit of rainbow trout.
Schram. (2013) found that the temperature preferred by juvenile dover sole () increases with acclimation temperature and exceeds the optimal growth temperature. Similarly, the plasticity of the effect of this temperature on growth rate and heat resistance was also reported in juvenile the teleost fish ()(He., 2014). In the present study, the experimental fish cultured at a high temperature of 20℃ grew slower than those cultured at 16℃ (C0) no matter whether they have experienced thermal acclimation or not, indicating that the rainbow trout did not obtain super-compensation characteristics through thermal acclimation. The shorter acclimation period may be responsible for this phenomenon.
We found that the food consumption of theexperimen- tal fish cultured at 20℃ was higher than that of C0, and the FCs of A0, A3, A6, and A9were 122%, 107%, 73.2%, and 45.5% higher than that of C0(Table 3), respectively. This indicated that the experimental fish had a higher FC under high temperature conditions. However, it should be noted that the FC of A9was significantly lower than that of A0, A3, and A6, indicating that the fish in A9obtained some physiological advantage. In contrast, the physio- logical advantage did not exist in the fish which did not experience thermal acclimation (A0) or only experienced a shorter time of thermal acclimation (A3and A6).
SOD is considered to be one of the vital first line de- fenses againstoxidative stress (Irvin, 1995).Meanwhile, activation of SOD requires concomitant activation of cy- tosolic GPx and/or CAT activity to protect cells from oxi- dative stress (Halliwell and Gutteridge, 1995). Accord- ingly, changes in the activities of SOD, CAT, and GPx can indirectly reflect the antioxidant status of the organ- ism (Chance., 1979; Wilhelm and Boveris, 1993; Wilhelm., 1993; Davies, 1995). When the tempera- ture was raised to 22℃ (P2), the activities of three anti- oxidant enzymes in the livers of A3, A6and A9fish were increased by 7.2, 4.0, and 3.3 times, respectively, compared with A0(Figs.1A, B, andC). This indicated that high tem- perature acclimation was a kind of heat stress on experimental fish, which made their antioxidant enzyme activity increase rapidly. At the same time, A6and A9, which experienced longer heat acclimation, had certain adaptability to heat acclimation; therefore, their antioxidant enzyme activities decreased overall in the later stage (P3).However, when exposed to high temperature again (P5), the activities of SOD and GPx in A3, A6and A9were significantly lower than those in the A0group, indicating that the acclimated rainbow trout had less response to heat stress than those without acclimation. For the fish in the same group, our results showed that the activities of both SOD and GPx in the fish which experienced a high temperature for the second time, were significantly lower than thoseduring the first time. On one hand, the tem- perature of second stress is 20℃, which is lower than the temperature of the first stress.On the other hand, it in- dicates that the previous acclimation enhances the heat- tolerance of the fish (Brown., 1992; Arai., 1994; Chung., 2017). During the P5 period, the three en- zyme activities in A9were lower than those in A3and A6, while the SOD activity was significantly different. More- over, at the end of the growth experiment (P6), the three enzyme activities in A9were not significantly different from the control group. These results indicated that the pre-acclimation enhanced the antioxidant capacity of rain- bow trout and the 9-d pre-acclimation was the most effective.
GPT and GOT, the two most active transaminases, are the most sensitive indicators of liver damage (Md Mi- zanur., 2014). They are usually at a lower level in serum. In contrast, activities may increase in a stressful and unfavorable environment (Md Mizanur., 2014). In this study, GPT and GOT activities in serum were sig- nificantly increased during the acclimation process. This indicated that the liver of the fish was damaged when exposed to 22℃. Additionally, during a 40-d growth pe- riod at a high temperature, GPT and GOT activities in the 9-d acclimation group were lower than those in A3and A6fish. These results also indicated that 9-d thermal accli- mation enhanced the ability of the fish to resist heat stress, especially the liver repair function.
Many studies have confirmed thatandare involved in the heat stress response of various organ- isms, and their upregulation is meaningful for animals to overcome protein damage during long-term heat stress (Gedamu., 1983; Sharp., 1994; Choresh.,2001; Seveso., 2014; Sharma., 2017; Zhou., 2018). Our findings showed that after heating to 22℃ (P2), the transcription levels ofandin the liver increased significantly, and are nearly 6–16 times of the normal level (Figs.3A and 3B). At the end of the heat acclimation (P3), the transcription levels ofandin A6and A9were significantly lower than those in A3, indicating that the rainbow trout in A6and A9had some adaptability to high temperature. When the experi- mental rainbow trout experienced a high temperature of 20℃ for the second time, the transcription levels ofandin the high temperature-acclimated fish (A3, A6and A9) were significantly lower than the transcription level in A0, and the transcription level in A9was the low- est (Figs.3A and 3B). This also reflected the genetic level that heat acclimation can improve the tolerance of rain- bow trout to high temperature, and a 9-day acclimation was the best.
The rapid and significant response of the mRNA abun- dances ofandto stress also demonstrated their potentials as biomarkers (Huang., 2011; Shi., 2015; Xie., 2015; Li., 2016; Liu., 2017). Large differences of expression levels betweenandmay be caused by their different specific functions (Martin., 1992; Mayer and Bukau, 2005).was suitable for indicating the state of stress over a short pe- riod of time after stress whereas the response period ofwas longer.
5 Conclusions
In this study, the effects of pre-acclimation to high tem- perature on the heat-tolerance of juvenile rainbow trout were evaluated by growth performance, activities of an- tioxidant enzymes and transaminases, and the transcrip- tion levels of heat shock protein genes. The results of this study showed that the heat tolerance of the rainbow trout after high temperature pre-acclimation was significantly improved when the fish were challenged with a high tem- perature again. Compared with the fish that experienced 0d, 3d, and 6d acclimation, the juvenile rainbow trout acclimated for 9d had the highest survival rate and the best growth performance when exposed to high temperature again. One of the reasons for the improvement in heat re- sistance of juvenile rainbow trout was the strengthening of the antioxidant defense system.
Acknowledgements
We would like to thank those who have critically re- viewed this manuscript as well as those who helped in supporting this study at the Key Laboratory of Maricul- ture of Ministry of Education, Ocean University of China, Qingdao, China. This research was supported by the Na- tional Natural Science Foundation of China (Nos. 31572 634, 31702364 and 31872575), and the Shandong Prov- ince Key Research and Development Plan (Nos. 2016 CYJS04A01, 2017CXGC0106, 2017CXGC0102 and 2018 CXGC0101).
Afonso, L.O.B., Hosoya, S., Osborne, J., Gamperl, A.K., and Johnson, S., 2008. Lack of glucose and hsp70 responses in haddock(L.) subjected to hand- ling and heat shock., 72 (1): 157-167.
Arai, A., Mitani, H., Naruse, K., and Shima, A., 1994. Rela- tionship between the induction of proteins in the Hsp70 fa- mily and thermosensitivity in 2 species of(Pisces).–,109 (4): 647-654.
Bahrndorff, S., Maien, J., Loeschcke, V., and Ellers, J., 2009. Dynamics of heat-induced thermal stress resistance and Hsp70expression in the springtail,.,23 (2): 233-239.
Beitinger, T.L., and Bennett, W. A., 2000. Quantification of the role of acclimation temperature in temperature tolerance of fishes., 58 (3): 277-288.
Besson, M., Vandeputte, M., van Arendonk, J. A. M., Aubin, J., de Boer, I. J. M., Quillet, E., and Komen, H., 2016. Influence of water temperature on the economic value of growth rate in fish farming: The case of sea bass () cage farming in the Mediterranean., 462: 47-55.
Brown, M. A., Upender, R. P., Hightower, L. E., and Renfro, J. L., 1992. Thermoprotection of a functional epithelium: Heat stress effects on transepithelial transport by flounder renal tubule in primary monolayer-culture., 89 (8): 3246-3250.
Calosi, P., Bilton, D. T., Spicer, J. I., Votier, S. C., and Atfield, A., 2010. What determines a species’ geographical range? Thermal biology and latitudinal range size relationships in European diving beetles (Coleoptera: Dytiscidae)., 79 (1): 194-204.
Chance, B., Sies, H., and Boveris, A., 1979. Hydroperoxide me- tabolism in mammalian organs., 59 (3): 527-605.
Choresh, O., Ron, E., and Loya, Y., 2001. The 60-kDa heat shock protein (HSP60) of the sea anemone: A po- tential early warning system for environmental changes.(), 3 (5): 501-508.
Chung, D. J., Bryant, H. J., and Schulte, P. M., 2017. Thermal acclimation and subspecies-specific effects on heart and brain mitochondrial performance in a eurythermal teleost ()., 220 (8): 1459-1471.
Davies, K. J., 1995. Oxidative stress: The paradox of aerobic life., 61: 1-31.
Dominguez, M., Takemura, A., Tsuchiya, M., and Nakamura, S., 2004. Impact of different environmental factors on the circu- lating immunoglobulin levels in the Nile tilapia,., 241 (1-4): 491-500.
Dong, S. L., 2019. Research progress and prospect on large Salmonidae farming at the areas of Cold Water Mass in Yellow Sea., 49 (3): 1-6 (in Chinese with English abstract).
Dowd, W. W., Brill, R. W., Bushnell, P. G., and Musick, J. A., 2006. Standard and routine metabolic rates of juvenile sand- bar sharks (), including the effects of body mass and acute temperature change., 104 (3): 323-331.
Feder, M. E., and Hofmann, G. E., 1999. Heat-shock proteins, molecular chaperones, and the stress response: Evolutionary and ecological physiology., 61: 243-282.
Gedamu, L., Culham, B., and Heikkila, J. J., 1983. Analysis of the temperature-dependent temporal pattern of heat-shock-pro- tein synthesis in fish cells., 3 (7): 647-658.
Halliwell, B., and Gutteridge, J. M. C., 1995. The definition and treatment of antioxidants in biological systems., 18 (1): 125-126.
He, Y. F., Wu, X. B., Zhu, Y. J., Li, H. C., Li, X. M., and Yang, D. G., 2014. Effect of rearing temperature on growth and thermal tolerance oflarvae and juveniles., 46: 24-30.
Huang, W. J., Leu, J. H., Tsau, M. T., Chen, J. C., and Chen, L. L., 2011. Differential expression of LvHSP60 in shrimp in response to environmental stress., 30 (2): 576-582.
Irwin, F., 1995. Superoxide radical and superoxide dismutases., 64(1): 97-112.
Kalmar, B., and Greensmith, L., 2009. Induction of heat shock proteins for protection against oxidative stress., 61 (4): 310-318.
Li, J., Zhang, Y., Liu, Y., Zhang, Y., Xiao, S., and Yu, Z., 2016. Co-expression of heat shock protein (HSP) 40 and HSP70 inresponse to thermal, low salinity and bac- terial challenges., 48: 239-243.
Li, M., Li, X. J., Lu, J. H., and Huo, M. F., 2018. The effect of acclimation on heat tolerance of(Fa- bricius) (Coleoptera: Anobiidae)., 71: 153-157.
Linton, T. K., Morgan, I. J., Reid, S. D., and Wood, C. M., 1998. Long-term exposure to small temperature increase and sub- lethal ammonia in hard water acclimated rainbow trout: Does acclimation occur?, 40 (2-3): 171-191.
Liu, Y., Ma, D., Zhao, C., Xiao, Z., Xu, S., Xiao, Y., Wang, Y., Liu, Q., and Li, J., 2017. The expression pattern of hsp70 plays a critical role in thermal tolerance of marine demersal fish: Multilevel responses ofand its hybrids (♀×♂) to chronic and acute heat stress., 129: 386-395.
Madeira, C., Mendonca, V., Leal, M. C., Flores, A. A. V., Cabral, H. N., Diniz, M. S., and Vinagre, C., 2017. Thermal stress, thermal safety margins and acclimation capacity in tropical shallow waters–An experimental approach testing multiple end-points in two common fish., 81: 146-158.
Madeira, D., Narciso, L., Cabral, H. N., Diniz, M. S., and Vinagre, C., 2014. Role of thermal niche in the cellular response to ther- mal stress: Lipid peroxidation and HSP70 expression in coas- tal crabs., 36: 601-606.
Madeira, D., Narciso, L., Cabral, H. N., Vinagre, C., and Diniz, M. S., 2013. Influence of temperature in thermal and oxida- tive stress responses in estuarine fish.–, 166 (2): 237-243.
Martin, J., Horwich, A. L., and Hartl, F. U., 1992. Prevention of protein denaturation under heat stress by the chaperonin Hsp60., 258 (5084): 995-998.
Mayer, M. P., and Bukau, B., 2005. Hsp70 chaperones: Cellular functions and molecular mechanism., 62 (6): 670-684.
Md Mizanur, R., Yun, H., Moniruzzaman, M., Ferreira, F., Kim, K. W., and Bai, S. C., 2014. Effects of feeding rate and water temperature on growth and body composition of juvenile Korean rockfish,(Hilgendorf 1880)., 27 (5): 690-699.
Meyer, H., and Santarius, K. A., 1998. Short-term thermal accli- mation and heat tolerance of gametophytes of mosses., 115 (1-2): 1-8.
Nakano, K., and Iwama, G., 2002. The 70-kDa heat shock pro- tein response in two intertidal sculpins,and: Relationship of hsp70 and thermal tole- rance.–, 133 (1): 79-94.
Nytro, A. V., Vikingstad, E., Foss, A., Hangstad, T. A., Reynolds, P., Eliassen, G., Elvegard, T. A., Falk-Petersen, I. B., and Ims- land, A. K., 2014. The effect of temperature and fish size on growth of juvenile lumpfish (L)., 434: 296-302.
Ohashi, K., Burkart, V., Flohe, S., and Kolb, H., 2000. Cutting edge: Heat shock protein 60 is a putative endogenous ligand of the toll-like receptor-4 complex., 164 (2): 558-561.
Parsell, D. A., and Lindquist, S., 1993. The function of heat-shock proteins in stress tolerance–Degradation and reactiva- tion of damaged proteins., 27: 437-496.
Pauly, D., and Zeller, D., 2017. Comments on FAOs State of World Fisheries and Aquaculture (SOFIA 2016)., 77: 176-181.
Pfaffl, M. W., 2001. A new mathematical model for relative quan-tification in real-time RT-PCR., 29 (9): e45-e45.
Pirozzi, I., and Booth, M. A., 2009. The routine metabolic rate of mulloway (: Sciaenidae) and yellow- tail kingfish (: Carangidae) acclimated to six different temperatures.–, 152 (4): 586-592.
Ronisz, D., Larsson, D. G. J., and Forlin, L., 1999. Seasonal va- riations in the activities of selected hepatic biotransformation and antioxidant enzymes in eelpout ().–, 124 (3): 271-279.
Sappal, R., Fast, M., Stevens, D., Kibenge, F., Siah, A., and Ka- munde, C., 2015. Effects of copper, hypoxia and acute tem- perature shifts on mitochondrial oxidation in rainbow trout () acclimated to warm temperature., 169: 46-57.
Scharf, I., Galkin, N., and Halle, S., 2015. Disentangling the consequences of growth temperature and adult acclimation temperature on starvation and thermal tolerance in the red flour beetle., 42 (1): 54-62.
Schram, E., Bierman, S., Teal, L. R., Haenen, O., van de Vis, H., and Rijnsdorp, A. D., 2013. Thermal preference of juvenile Dover sole () in relation to thermal acclimation and optimal growth temperature., 8 (4): e61357.
Semsar-kazerouni, M., and Verberk, W. C. E. P., 2018. It’s about time: Linkages between heat tolerance, thermal acclimation and metabolic rate at different temporal scales in the fresh- water amphipodKoch, 1836., 75: 31-37.
Seveso, D., Montano, S., Strona, G., Orlandi, I., Galli, P., and Vai, M., 2014. The susceptibility of corals to thermal stress by analyzing Hsp60 expression., 99: 69-75.
Sharma, J., Singh, S. P., and Chakrabarti, R., 2017. Effect of temperature on digestive physiology, immune-modulatory para-meters, and expression level of Hsp and LDH genes in(Hamilton, 1822)., 479: 134-141.
Sharma, S., Reddy, P. V. J., Rohilla, M. S., and Tiwari, P. K., 2006. Expression of HSP60 homologue in sheep blowflyduring development and heat stress., 31 (7): 546-555.
Sharp, V. A., Miller, D., Bythell, J. C., and Brown, B. E., 1994. Expression of low-molecular-weight Hsp-70 related polypep- tides from the symbiotic sea-anemoneFors- kall in response to heat-shock., 179 (2): 179-193.
Shatilina, Z. M., Riss, H. W., Protopopova, M. V., Trippe, M., Meyer, E. I., Pavlichenko, V. V., Bedulina, D. S., Axenov-Gribanov, D. V., and Timofeyev, M. A., 2011. The role of the heat shock proteins (HSP70 and sHSP) in the thermotolerance of freshwater amphipods from contrasting habitats., 36 (2): 142-149.
Shi, H. N., Liu, Z., Zhang, J. P., Kang, Y. J., Wang, J. F., Huang, J. Q., and Wang, W. M., 2015. Short communication: Effect of heat stress on heat-shock protein (Hsp60) mRNA expre- ssion in rainbow trout., 14 (2): 5280-5286.
Solomon, J. M., Rossi, J. M., Golic, K., McGarry, T., and Lind- quist, S., 1991. Changes in hsp70 alter thermotolerance and heat-shock regulation in., 3 (11): 1106-1120.
Soltys, B. J., and Gupta, R. S., 1996. Immunoelectron microsco- pic localization of the 60-kDa heat shock chaperonin protein (Hsp60) in mammalian cells., 222 (1): 16-27.
Sun, L. H., and Chen, H. R., 2014. Effects of water temperature and fish size on growth and bioenergetics of cobia ()., 426: 172-180.
Tromp, J. J., Jones, P. L., Symonds, J. E., Walker, S. P., Pope, A., Pether, S. M. J., and Afonso, L. O. B., 2016. Effects of com- mercial diets and temperature on the growth performance and stress response of hapuku ()., 452: 128-133.
Wang, X. R., Yan, B., Shi, M., Zhou, W., Zekria, D., Wang, H. Z., and Kai, G. Y., 2016. Overexpression of aHSP70 in tobacco confers enhanced tolerance to heat stress., 253 (3): 637-645.
Wilhelm, D., and Boveris, A., 1993. Antioxidant defenses in marine fish.2. Elasmobranchs.–, 106 (2): 415-418.
Wilhelm, D., Giulivi, C., and Boveris, A., 1993. Antioxidant defenses in marine fish.1. Teleosts.–, 106 (2): 409-413.
Xie, Y. J., Song, L., Weng, Z. H., Liu, S. K., and Liu, Z. J., 2015. Hsp90, Hsp60 and sHsp families of heat shock protein genes in channel catfish and their expression after bacterial in- fections., 44 (2): 642-651.
Young, P. S., and Cech, J. J., 1996. Environmental tolerances and requirements of splittail., 125 (5): 664-678.
Zhou, A., Xie, S., Wang, Z., Chen, Y., Zhang, Y., Fan, L., Zeng, F., and Zou, J., 2018. HSP60 expression profile under dif- ferent extreme temperature stress in albino northern snake- head,., 23 (4): 791-796.
January 21, 2019;
March 27, 2019;
October 9, 2019
? Ocean University of China, Science Press and Springer-Verlag GmbH Germany 2020
. Tel: 0086-532-82031691
E-mail: dongsl@ouc.edu.cn.
(Edited by Qiu Yantao)
 Journal of Ocean University of China2020年1期
- Journal of Ocean University of China的其它文章
- Screening and Characterization of Nitrite-Degrading Bacterial Isolates Using a Novel Culture Medium
- Purification and Characterization of a Novel Lipase from Antarctic Krill
- Quality Assessment of Frozen Solenocera crassicornis Treated with Sodium Metabisulphite by Soaking or Spraying
- Contribution of Mesoscale Eddies to the Subduction and Transport of North Pacific Eastern Subtropical Mode Water
- Semi-Empirical Algorithm for Wind Speed Retrieval from Gaofen-3 Quad-Polarization Strip Mode SAR Data
- Half Smooth Tongue Sole (Cynoglossus semilaevis) Under Low Salinity Stress Can Change Hepatic igf2 Expression Through DNA Methylation