Flight strategy optimization for high-altitude long-endurance solar-powered aircraft based on Gauss pseudo-spectral method
Shaoqi WANG, Dongli MA, Muqing YANG, Liang ZHANG, Guanxiong LI
School of Aeronautic Science and Engineering, Beihang University, Beijing 100083, China
KEYWORDS
Battery pack;
Flight strategy optimization;
Gauss pseudo-spectral
method;
Photovoltaic cell;
Solar-powered aircraft
Abstract Solar-powered aircraft have attracted great attention owing to their potential for longendurance flight and wide application prospects. Due to the particularity of energy system, flight strategy optimization is a significant way to enhance the flight performance for solar-powered aircraft. In this study, a flight strategy optimization model for high-altitude long-endurance solar-powered aircraft was proposed. This model consists of three-dimensional kinematic model,aerodynamic model, energy collection model, energy store model and energy loss model. To solve the nonlinear optimal control problem with process constraints and terminal constraints, Gauss pseudo-spectral method was employed to discretize the state equations and constraint equations.Then a typical mission flying from given initial point to given final point within a time interval was considered. Results indicate that proper changes of the attitude angle contribute to increasing the energy gained by photovoltaic cells.Utilization of gravitational potential energy can partly take the role of battery pack. Integrating these two measures, the optimized flight strategy can improve the final state of charge compared with current constant-altitude constant-velocity strategy. The optimized strategy brings more profits on condition of lower sunlight intensity and shorter daytime.
1. Introduction
Nowadays, energy crisis and environmental pollution are major tough challenges the world is facing.1As a result of photovoltaic technology advances, solar energy has gradually become a chief role player in the exploration for renewable clean energy.2Applying solar energy for flight has a promising prospect, which has attracted many researches over the past few decades.3-5
Since solar energy is considered to be inexhaustible, it is expected to redefine the endurance of aircraft. High-Altitude Long-Endurance (HALE) solar-powered aircraft are capable of staying airborne for weeks, months, or even years above the tropopause, functioning as geostationary satellites,6,7which can be widely employed in many fields such as reconnaissance, communications, and network services.8Due to the particularity of energy system, flight strategy optimization provides a significant way to enhance the flight performance of HALE solar-powered aircraft without much manpower or material resources.
Throughout the literatures dealing with flight strategy optimization for solar-powered aircraft, there are two main approaches, one of which is increasing the energy gained by photovoltaic cells through changes of aircraft attitude angle.This approach features the coupling of energy collection and lost with aircraft kinematics. Klesh and Kabamba9,10considered the level flight path planning for point-to-point missions.Necessary conditions for optimality were given analytically based on Pontryagin’s Maximum Principle, whose solution yields extremal path. The Power Ratio, a non-dimensional number, was introduced to predict the regime of optimum path.Spangelo et al.11,12described the flight path as a periodic spline function to identify the optimum path for small-radius circle flight. Given the periodic spline, other aircraft parameters, including the aerodynamic, propulsive, and energetic properties are able to be solved. Simulation results indicate that elliptical path generates better energy properties than circular path for short-duration missions.To maximize the heading changes in level turn, Ma et al.13derived the analytical necessary conditions as well as optimum level turn properties and obtained a closed-form optimal bank-angle control law.Researches prove that the optimum level turn can be obtained only when the power is set below the power required for steady level flight at the initial velocity. Taking weather factor into consideration, Dai14studied the path planning strategy for solar-powered aircraft at low level altitude. Bellman-Ford searching algorithm, combined with a graph-based method,was utilized to find the optimum path connecting the specified boundary points while maximizing the net gain of energy at terminal point. Besides, specific type of missions such as ground target tracking and multi-aircraft surveillance were investigated.15-19In these studies, the aircraft were assumed to fly at a constant altitude.
Another approach of flight strategy optimization is changing flight altitude to supplant the electric energy storage by gravitational potential. Gao et al.20studied the properties of the maximum endurance path of gravitational gliding with Gauss Pseudo-spectral Method(GPM),then analyzed the sensitivity of initial altitude and velocity of aircraft with its endurance performance. By introducing Endurance Flight Factor,Gao et al.21researched the equivalence of gravitational potential and rechargeable battery for HALE solar-powered aircraft. After that, they proposed an energy management strategy during one day-night cycle,22,23where the flight path was divided into three stages. During the first stage, solar energy is stored in both battery pack and gravitational potential. The gravitational potential is released in the second stage by gravitational gliding and the required power in the last stage is supplied by battery pack. Xu et al.24presented a similarly energy management strategy based on Lithium battery status. In these studies, the aircraft were assumed to fly in two-dimensional vertical plane.
Present researches on flight strategy optimization have made significant contributions to improving the performance of solar-powered aircraft.Increasing the energy gained by photovoltaic cells through changes of aircraft attitude angle and storing gravitational potential energy through changes of flight altitude are both effective for better energy properties. However, the comprehensive utilization of these two approaches in three-dimensional flight is hardly involved in published literatures. Besides, the curvature effect of wing surface must be taken into consideration to study the influence of aircraft attitude on sunlight incidence angle and the differences in aerodynamic characteristics at different flight status should also be considered for HALE solar-powered aircraft.
In this study, an integrated optimization model was proposed in Section 2 to research the problem of threedimensional energy-optimal flight strategy optimization for HALE solar-powered aircraft.This model consists of five subsystems:aircraft kinematics,aerodynamic performance,energy collection, energy store, and energy loss. To solve the nonlinear optimal control problem with process constraints and terminal constraints, GPM was employed to discretize the state equations and constraint equations, as derived in Section 3.Then a typical mission flying from given initial point to given final point within a time interval was considered. Simulations conditions and results were expressed in Section 4, where the proposed energy-optimal flight strategy was compared with Constant-Altitude Constant-Velocity (CACV) flight strategy,the influences of flight region and season on optimization results were also studied. Hopefully, the conclusions achieved in this research may contribute to the design and application of HALE solar-powered aircraft.
2. Modeling
During daytime, the aircraft utilizes photovoltaic cells to convert sunlight into electrical energy, which is divided into two parts by energy management system, as shown in Fig. 1. One part is used directly for maintaining daytime flight and the other part is stored in battery pack,which becomes the energy source for sustaining night flight.
Based on this energy system,the model used throughout the paper is elaborated in this section,which consists of five parts:aircraft kinematic model, aerodynamic model, energy collection model, energy store model, and energy loss model. Each subsystem is presented below.
2.1. Aircraft kinematic model in three dimensions
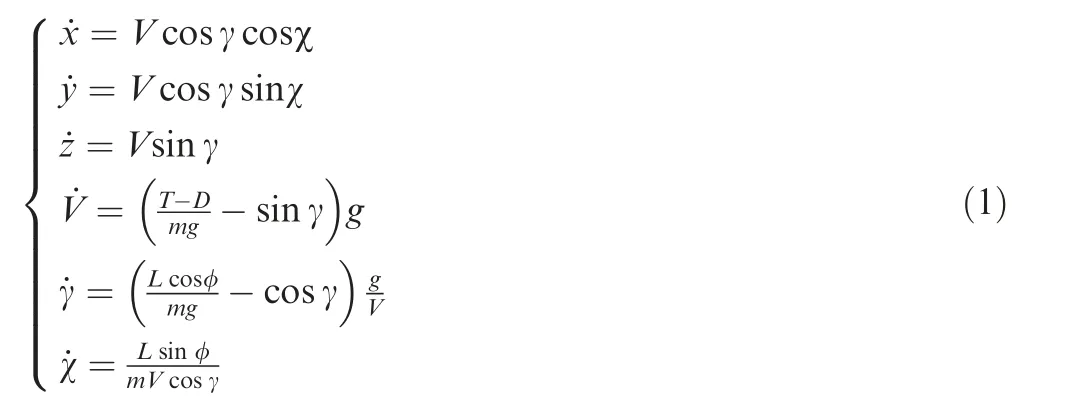
Supposing that the aircraft has the usual plane of symmetry and flies in still air with zero side-slip,the mathematical model based on point mass dynamics is governed by the following equations.where x, y and z are the aircraft position coordinates in flat earth-fixed frame, V the aircraft velocity, γ the flight path angle, χ the heading angle, φ the bank angle, m the aircraft mass, and g the acceleration of gravity. For simplicity, the dependence of variables on time, t, is not explicitly shown throughout the paper.

Fig. 1 Schematic representation of energy system.
Parameters L,D and T represent the aerodynamic lift,drag and thrust forces, respectively. The drag is parallel to velocity vector, while the lift is perpendicular to velocity vector. The thrust vector is assumed to be aligned with velocity vector,which is a reasonable approximation in cases for small angle of attack.The angle of attack,α,is measured between velocity vector and ObXbaxis of aircraft body-fixed frame. By definition,the earth-fixed frame OgXgYgZgpoints to the orientations of north, east, and up, respectively. The aircraft body-fixed frame ObXbYbZbis expressed out the nose,out the right wing,and down through the ground, as illustrated in Fig. 2.
The yawing angle ψ and pitching angle θ satisfy

In this study, α, φ, and T are chosen as three control variables to change the aircraft attitude and flight altitude.
2.2. Aerodynamic model
The lift and drag are calculated by

where ρ is the atmospheric density,S the wing area.CLand CDare the lift and drag coefficients.
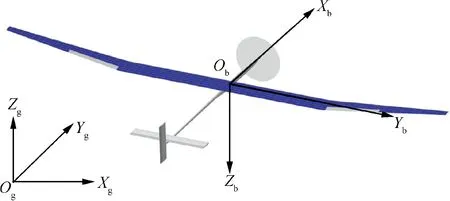
Fig. 2 Schematic diagram of earth-fixed frame and aircraft body-fixed frame.
Ref. 25 detailed a numerical method to study the aerodynamic characteristics at low Reynolds number and verified it by water tunnel tests. Here, this method is employed to calculate the aerodynamic characteristics and the results are fitted as

where Re is the characteristic Reynolds number. The value of Aijand Bijare listed in Tables 1 and 2, respectively.
2.3. Energy collection model
Most aircraft designers choose silicon photovoltaic cells due to the cost-effectiveness and the weight of substrate.26In this paper, the aircraft is equipped with silicon photovoltaic cells,mounted on the top side of the wings. The influence of clouds can be ignored in this instance since the aircraft always fly higher than cloud layer. It is necessary to take the curvature effect of wing surface into consideration to study the influence of aircraft attitude on sunlight incidence angle. In view of these, the energy collection model is established.


where, the solar elevation angle αeand azimuth angle αaare depend on latitude, season, and current solar time. Refs. 27 and 28 details the calculation method of these parameters.

Table 1 Value of Aij.

Table 2 Value of Bij.
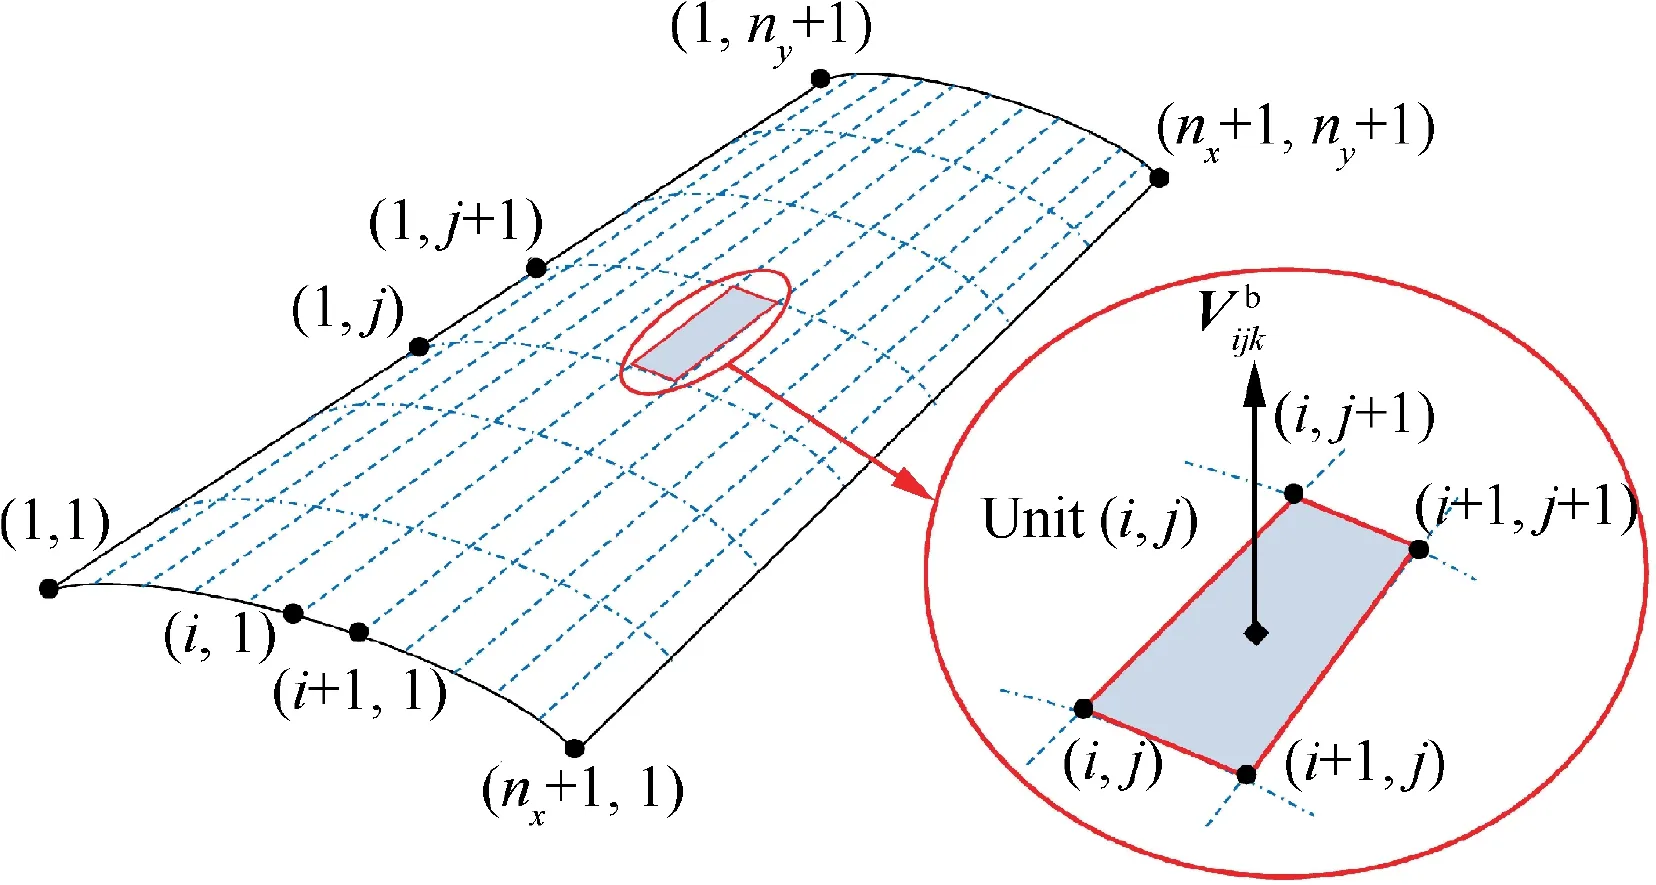
Fig. 3 Schematic diagram of solar array number on wing surface.
The incidence angle κijkmeasured between sunlight and the normal direction of unit (i, j) on kth section can be calculated as29

The power collected by unit (i, j) on kth section is

where Psdis the solar spectral density, ηpvthe conversion efficiency of photovoltaic cells, ηMPPTthe efficiency of Maximum Power Point Tracking (MPPT) device.
Consequently, the total power collected by aircraft is

2.4. Energy store model
Comparing to fuel cell and hydrogen, Lithium-Sulfur (Li-S)battery is one of the most promising secondary power sources that can be applied on HALE solar-powered aircraft.26,30The power output model of battery pack is based on Li-S battery.The rate of charge, S?C, is determined as31

where RIis battery pack internal resistance and QBis battery pack capacity.VOCis battery pack open circuit voltage,which is assumed to be constant in this paper. SOC represents the battery pack state of charge defined as the ratio of current charge capacity to maximum capacity. To optimize the cycle life of Li-S batteries, the value of SOC is limited within a proper range.31
The battery pack output power PBis chosen as another control variable, which is positive during discharge and negative during charge. Bounded by battery pack capability,the value of PBhas to stay within a limited range.
2.5. Energy loss model
The power consumption of airborne electronic equipment is relatively small compared with that of motor,which is ignored in this paper.The power of motor extracted from power source can be expressed as

where ηpand ηmrepresent the efficiency of propeller and motor, respectively.
2.6. Summary
The flight strategy optimization problem is motivated by the requirement to enhance the flight endurance of HALE solarpowered aircraft, which is equivalent to maximize the final energy of battery pack. Therefore, the objective function is set as

Choose α,φ,PB,T as control variables for the optimization problem.The state Eqs.(1)and(9)can be written into a compact form as

where x= [x y z V γ χ SOC]T, u= [α φ PBT]T.
The boundary conditions are artificially given as

Due to the aircraft maneuverability and battery pack capacity, the state variables have to subject to

The control variables have to subject to

In addition, the following process constraints are introduced to generate a smooth trajectory.

In summary,the trajectory optimization problem is to optimize α,φ,PB,T such that the objective function in(11)is maximized while the state equations in (12), boundary conditions in (13), and process constraints in (14)-(16) are satisfied.
3. Gauss pseudo-spectral method
Indirect method based on the Pontryagin Maximum Principle gives the way to solve optimal control problem. However, for the complex nonlinear problem described in Section 2, it is extremely tedious to derive the first-order necessary condition and it is inconvenient to treat the process constraints.Recently, GPM has gradually gained attention due to its advantages in computational efficiency and approximation accuracy. This method approximates the state variables and control variables at a series of discrete points using the finite basis of the global interpolation polynomials. It approximates the derivatives of the state variables in the dynamic equation by using the polynomial derivation, and satisfies the dynamic equations in a series of collocation points, thereby transforming the differential equations into algebraic constraints. Here,GPM is employed to convert the optimal control problem into a nonlinear programming problem.
3.1. Time domain transformation
A time domain transformation is introduced here to transform the time interval t∈[t0, tf] into normalized time τ∈[-1, 1]required in GPM.

Then Eq. (12) can be transformed into

3.2. Approximation of state and control variables

The collocation points is chosen to be the set of Legendre-Gauss points, τ = {τ1, τ2, ..., τN}, which are the roots of Nth-degree Legendre polynomial GN(τ).Legendre-Gauss points are distributed in the range of (-1,1). In addition, take τ={τ0, τ1, ..., τN} as the interpolation points by adding point τ0=-1 and let N+1 Lagrange interpolation polynomials Li(τ) be the base functions. The state variables can be approximated as

where

Similarly, the control variables can be expressed as

where

3.3. Transformation of dynamic differential equations
Differentiating Eq. (20) and evaluating at each point τk∈τ*yields

The N by N+1 matrix D is called the differentiation matrix32,33whose element in kth row and ith column is the derivative of Li(τ) evaluated at collocation point τk, where,k=1, 2, ..., N and i=0, 1, ..., N.
Substitution of Eqs. (20) and (24) into Eq. (18) yields
where k=1, 2, ..., N.
Accordingly, the dynamic differential equations are transformed into algebraic constraint equations.
3.4. Transcribe of boundary constraints
According to Eqs.(13)and(20),the start boundary constraints can be transcribed as

Note that the Lagrange interpolating polynomials are undefined on point τ=1. We use X(-1) and Gauss integral to evaluate X(1).

where Akis the Gauss weight computed as

Consequently, continuous optimal control problem are transformed into nonlinear programming problem. The optimization parameters are x(τi), i=0, 1, ..., N and u(τi),i=1, 2, ..., N.
4. Simulation and discussion
4.1. Simulation conditions
Flight strategy optimization for a typical mission flying from given initial point to given final point within a time interval[t0, tf] is considered. The basic parameters of the studied HALE solar-powered aircraft are listed in Table 3.Our implementation of the computational details was conducted using MATLAB Optimization Toolbox function ‘fmincon’. The number of collocation points, N, was chosen to be 10 firstly to provide feasible initial values and improve the convergence rate. Then it was increased to 50 to yield accurate results.
The set of simulation conditions and constraints of variables are list in Tables 4 and 5, respectively.
4.2. Comparison of optimized flight strategy and CACV flight strategy
In this instance, the aircraft is assumed to fly over Beijing on March 21st,where the latitude is 39.9 N and the solar spectral density Psdis 1352 W/m2.
4.2.1. CACV flight strategy
Here we consider a CACV flight strategy for comparison, in which the aircraft is set to fly at a constant velocity in a level plane.
Note that,for HALE solar-powered aircraft,the higher the flight altitude, the greater the power required for level flight.The reason comes from two aspects. On the one hand, the air density decreases with altitude,which results in the increase of velocity required for level flight according to Eq.(3).On the other hand, the Reynolds number decreases with altitude,which leads to the increase of aerodynamic drag and thrust required for level flight. Consequently, according to Eq. (10),the power required for level flight increases with altitude.
Based on this fact,as a traditional setup,the cruise altitude is set to be 15 km,the minimum altitude restricted by the mission. The velocity is set to be 23.1 m/s, which is the so-called minimum-power velocity9,10corresponding to 15 km. Fig. 4 shows the curve of minimum-power and corresponding velocity versus flight altitude.
The energy management method of CACV strategy is present below:
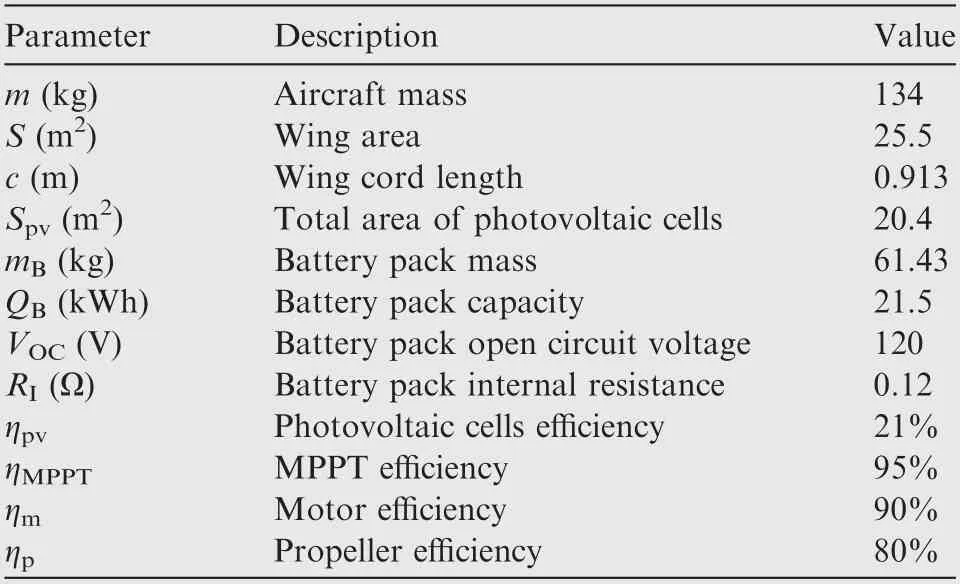
Table 3 Basic parameters of studied aircraft.
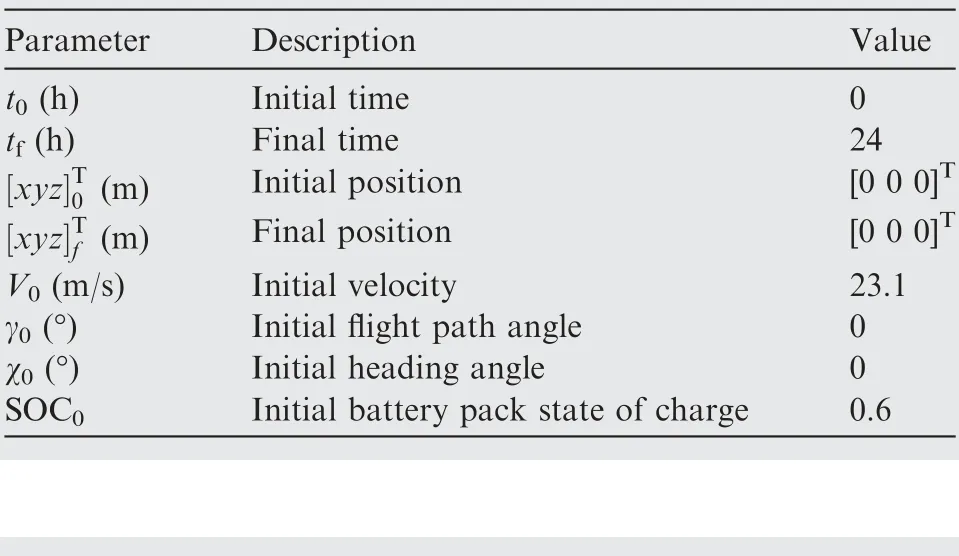
Table 4 Simulation conditions.
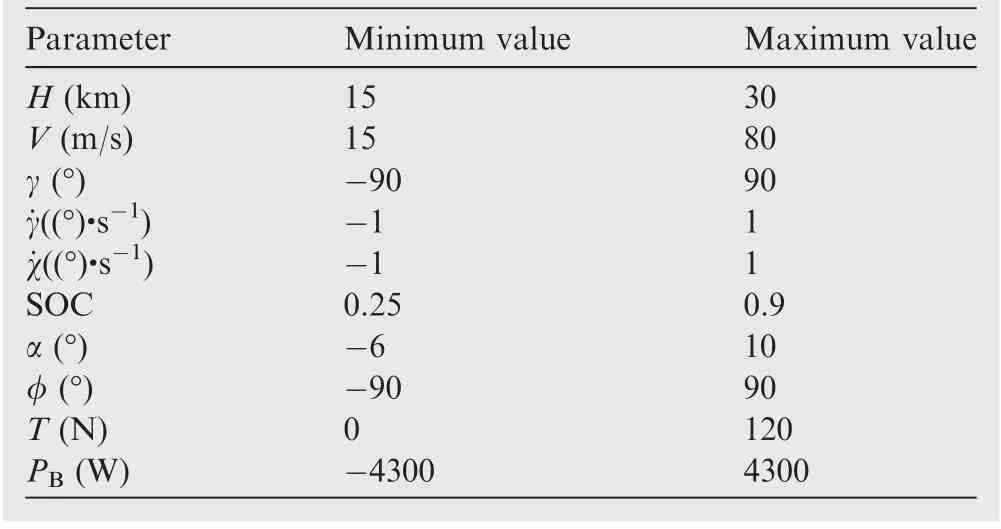
Table 5 Constraints of variables.
(1) When Ppv=0 and SOC ≥0.25, set PB=Pm.
In this state, battery pack discharges to sustain night fight.
(2) When Ppv>0 and 0.25 <SOC <0.9, set PB=Pm-Ppv.
If PB>0, photovoltaic cells and battery pack supply power to the motor together. If PB<0, in addition to maintain level flight, the excess solar power is used to charge the battery pack with a power of |PB|.
(3) When Ppv>0 and SOC=0.9, set PB=0.
In this state, the battery pack has been fully charged and the charging power is zero.
4.2.2. Optimized flight strategy
Simulation results of CACV strategy and optimized strategy obtained by proposed method are listed in Table 6.
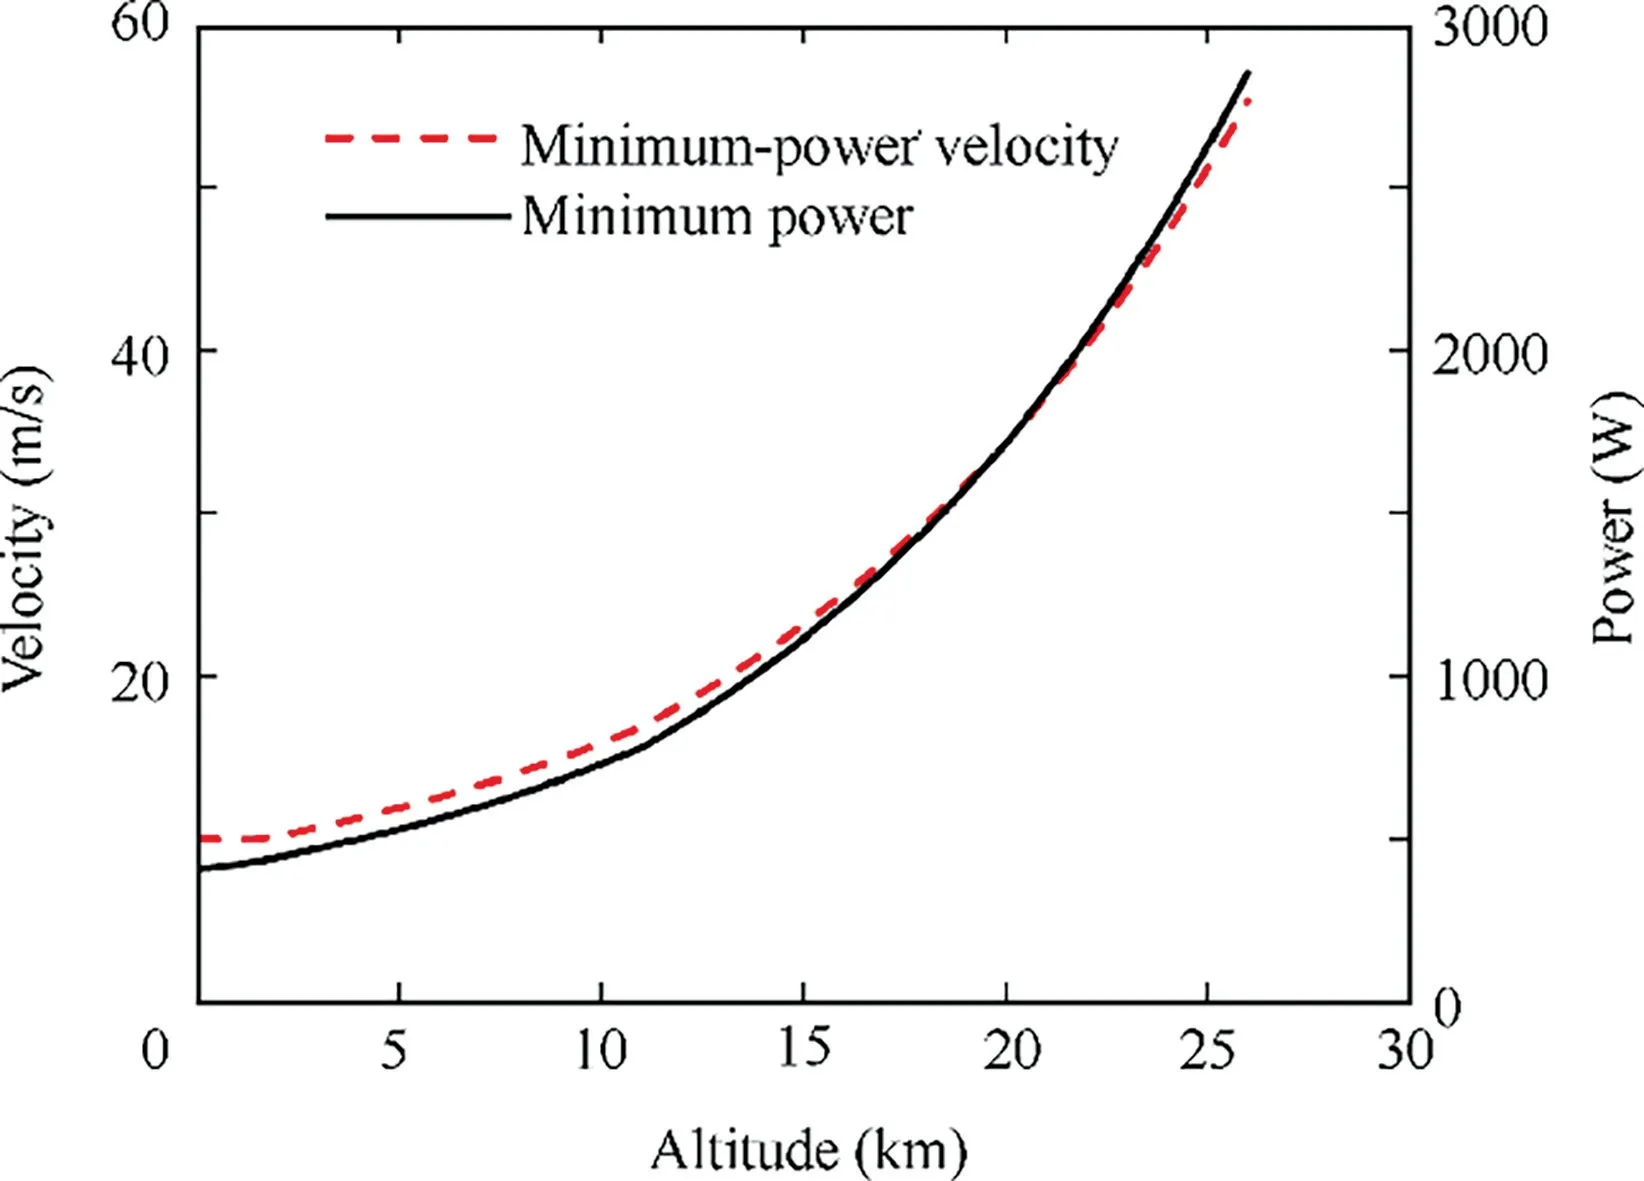
Fig.4 Minimum power and corresponding velocity versus flight altitude.
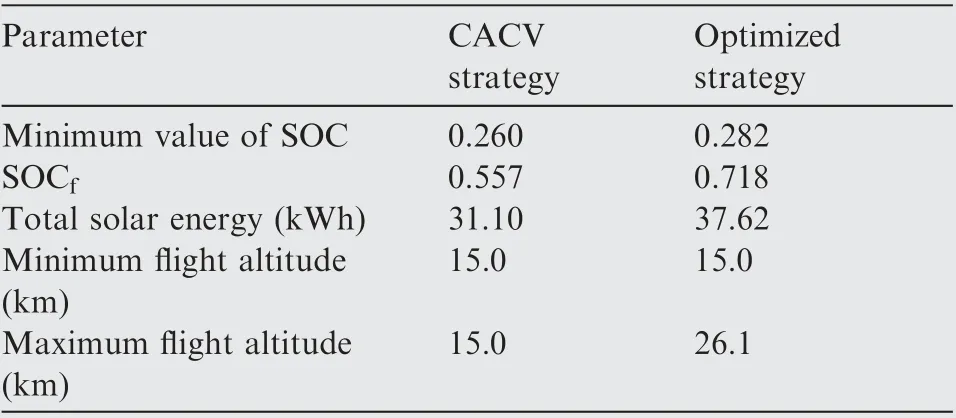
Table 6 Simulation results of CACV strategy and optimized strategy.
Compared with CACV strategy, the optimized strategy improves SOCfby 28.9%.In other words,the optimized strategy can reduce the battery weight by 9.9 kg.These weights can be removed or assigned to the mission payload, by which the aircraft performance will be further enhanced. Moreover,results indicate that SOCf>SOC0holds in optimized strategy. It means that the aircraft can accomplish the next daynight cycle without energy reduction in battery pack, which is also called closed-loop flight capability, making it possible to expand the flight endurance to weeks or even months.
Fig. 5 illustrates the solar power Ppv,motor power Pmand battery output power PBof CACV strategy and optimized strategy. In CACV strategy, Pmis 1115 W throughout the flight since the aircraft is set to fly at a constant velocity in a level plane.In proposed strategy,Pmincreases to be the consistent with Ppvsince t=12.5 h. When 12.5 h <t <17.5 h, Pmis greater than 1115 W. After that, Pm<1115 W until t=20.5 h. Particularly, Pmis zero when 18.0 h <t <20.5 h. It means that the aircraft is gliding without power during this period of time.
The solar power Ppvis increased through the adjustment of aircraft attitude in optimized strategy. For clarity, the solar power in a day-night circle is depicted in Fig. 6 as a comparison. In CACV strategy, the maximum value of Ppv, 4084 W,appears at t=12 h,while in optimized strategy,the maximum value of Ppv, 4672 W, appears at t=12.5 h. Compared with CACV strategy, the optimized strategy improves total solar energy by 21.0% in a day-night circle.
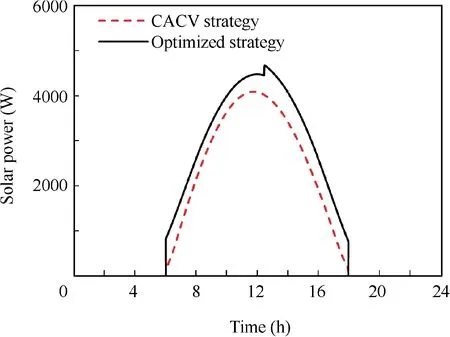
Fig. 6 Comparison of solar power.
The optimized strategy can be divided into four stages according to its characteristics, as displayed in Fig. 5(b) and Fig. 7.
4.2.3. Stage 1: level flight
During this stage,the sun is below the horizon.The state variables and control variables of optimized strategy are nearly the same with those of CACV strategy since the energy collected by photovoltaic cells is zero and both strategies aim to minimize the power consumption.
As shown in Fig.7(a)and(b),the aircraft flies at 15 km,the minimum altitude restricted by the mission, at a velocity closing to the minimum-power velocity, 23.1 m/s. The angle of attack is about 3.7° and the flight path angle is zero to minimize the required power for flight, demonstrated in Fig. 7(c).The battery pack output power is about 1115 W to maintain the level flight, as depicted in Fig. 7(e).
The bank angle should also be zero to minimize the required power for flight. However, to satisfy the terminal boundary conditions and to gain better energy properties in the next stage,the bank angle is close to but not equal to zero,as illustrated in Fig. 7(d). With this small bank angle, the aircraft changes heading direction gradually. At the end of this stage, the heading angle is about 180°, shown in Fig. 7(a)and (d).
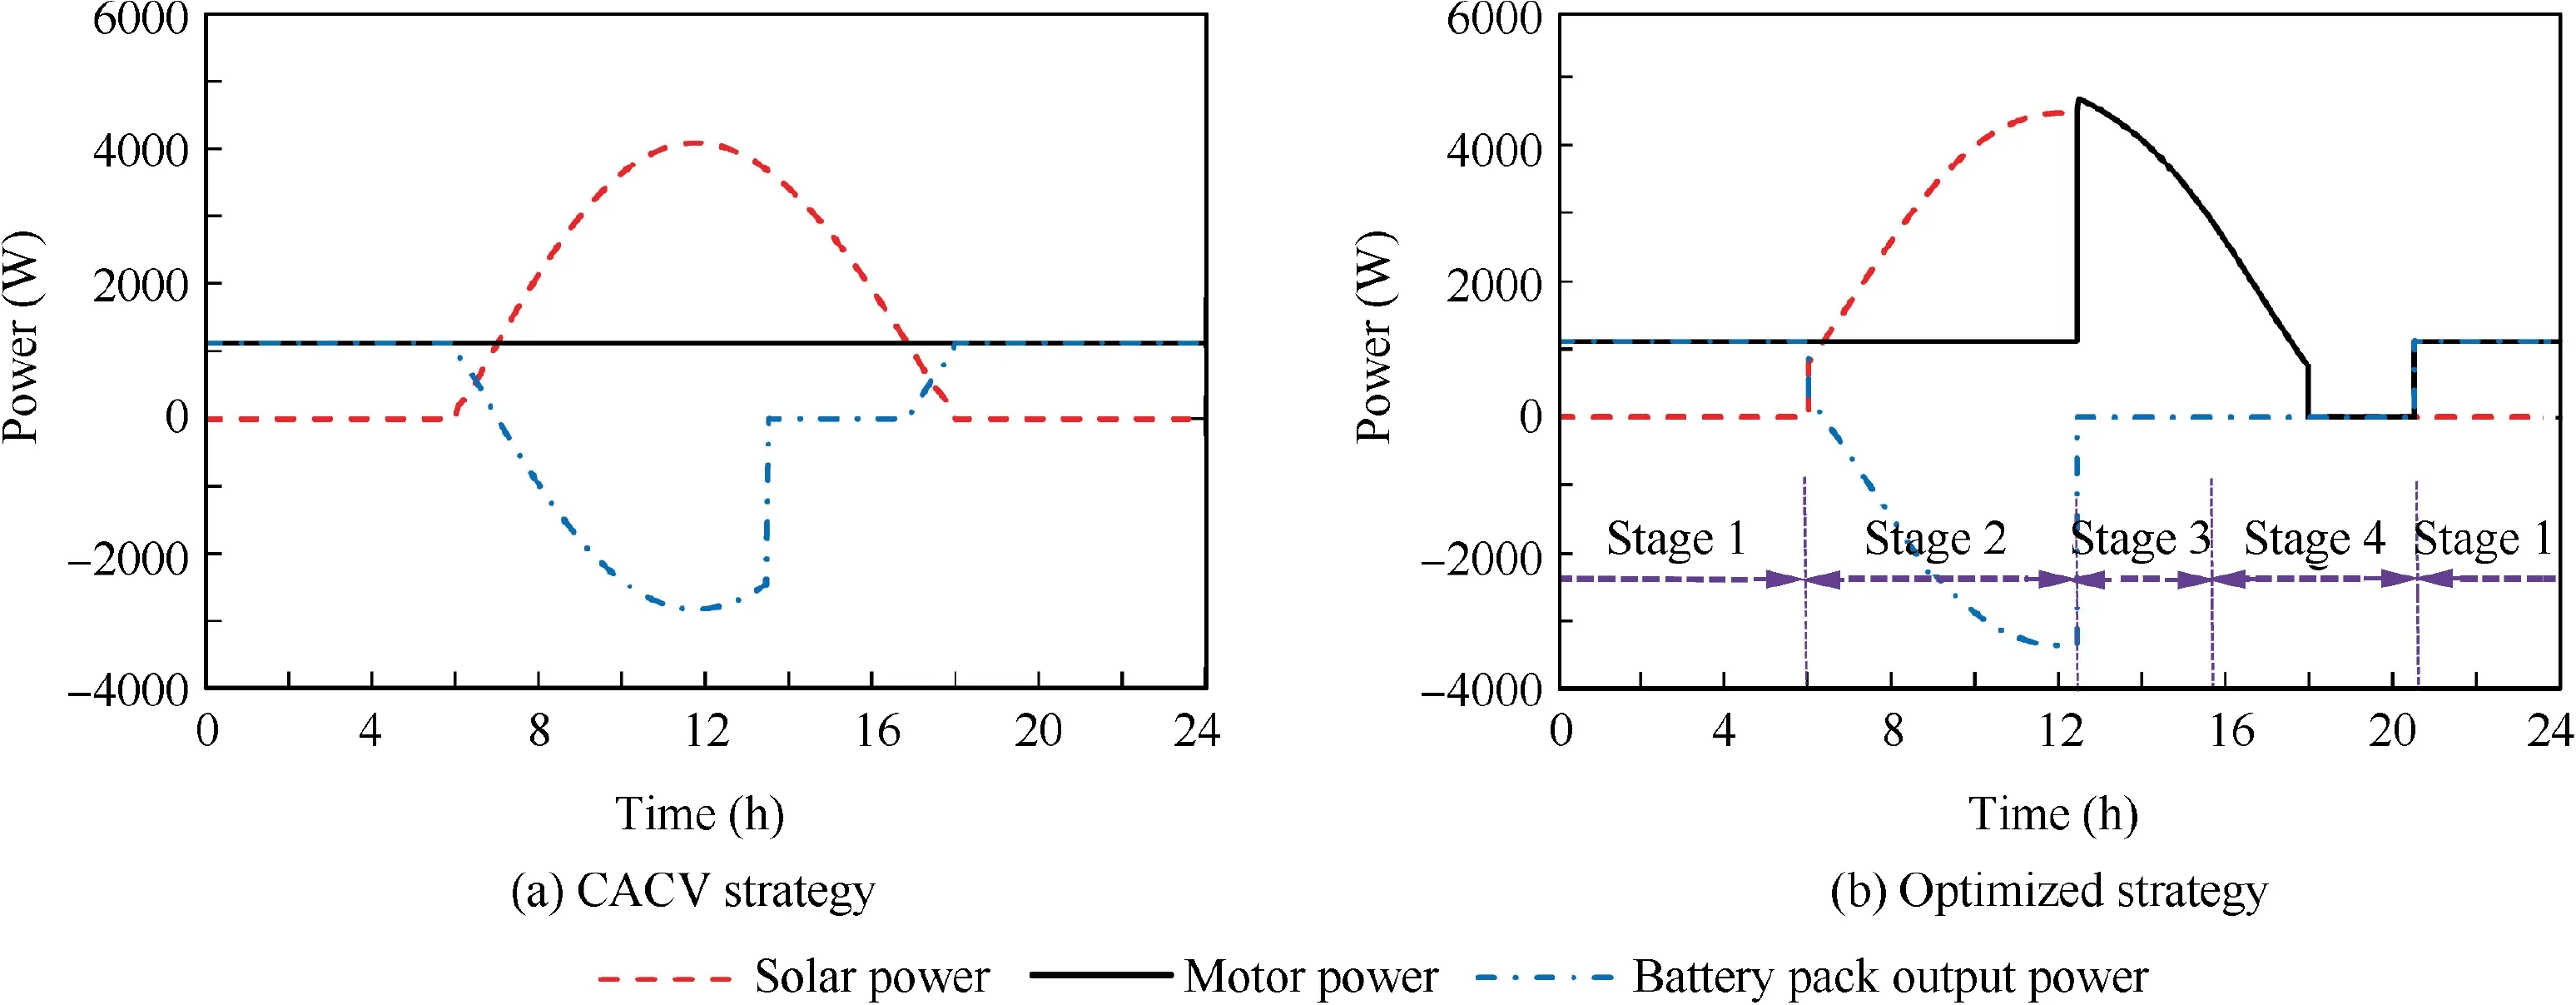
Fig. 5 Power of CACV strategy and optimized strategy.
Stage 1 ends when Ppv>0.
4.2.4. Stage 2: level flight and charging
During this stage, the photovoltaic cells collect solar power and Ppv>0.
While t=6.0 h,Ppvincreases suddenly.This is because the wing chord plane of aircraft is not horizontal but has a pitching angle, as shown in Fig. 8. In this instance, the pitching angle θ is 3.7°, which is equal to the angle of attack when the flight path angle is zero according to Eq. (2). In addition,the curvature effect of wing surface results in the change of solar power with heading angle even at the same solar elevation angle, as illustrated in Fig. 9. These two reasons contribute to generating power even the solar elevation angle is very small. It should be noted that Ppv=0 still holds as long as the sun is below the horizon.
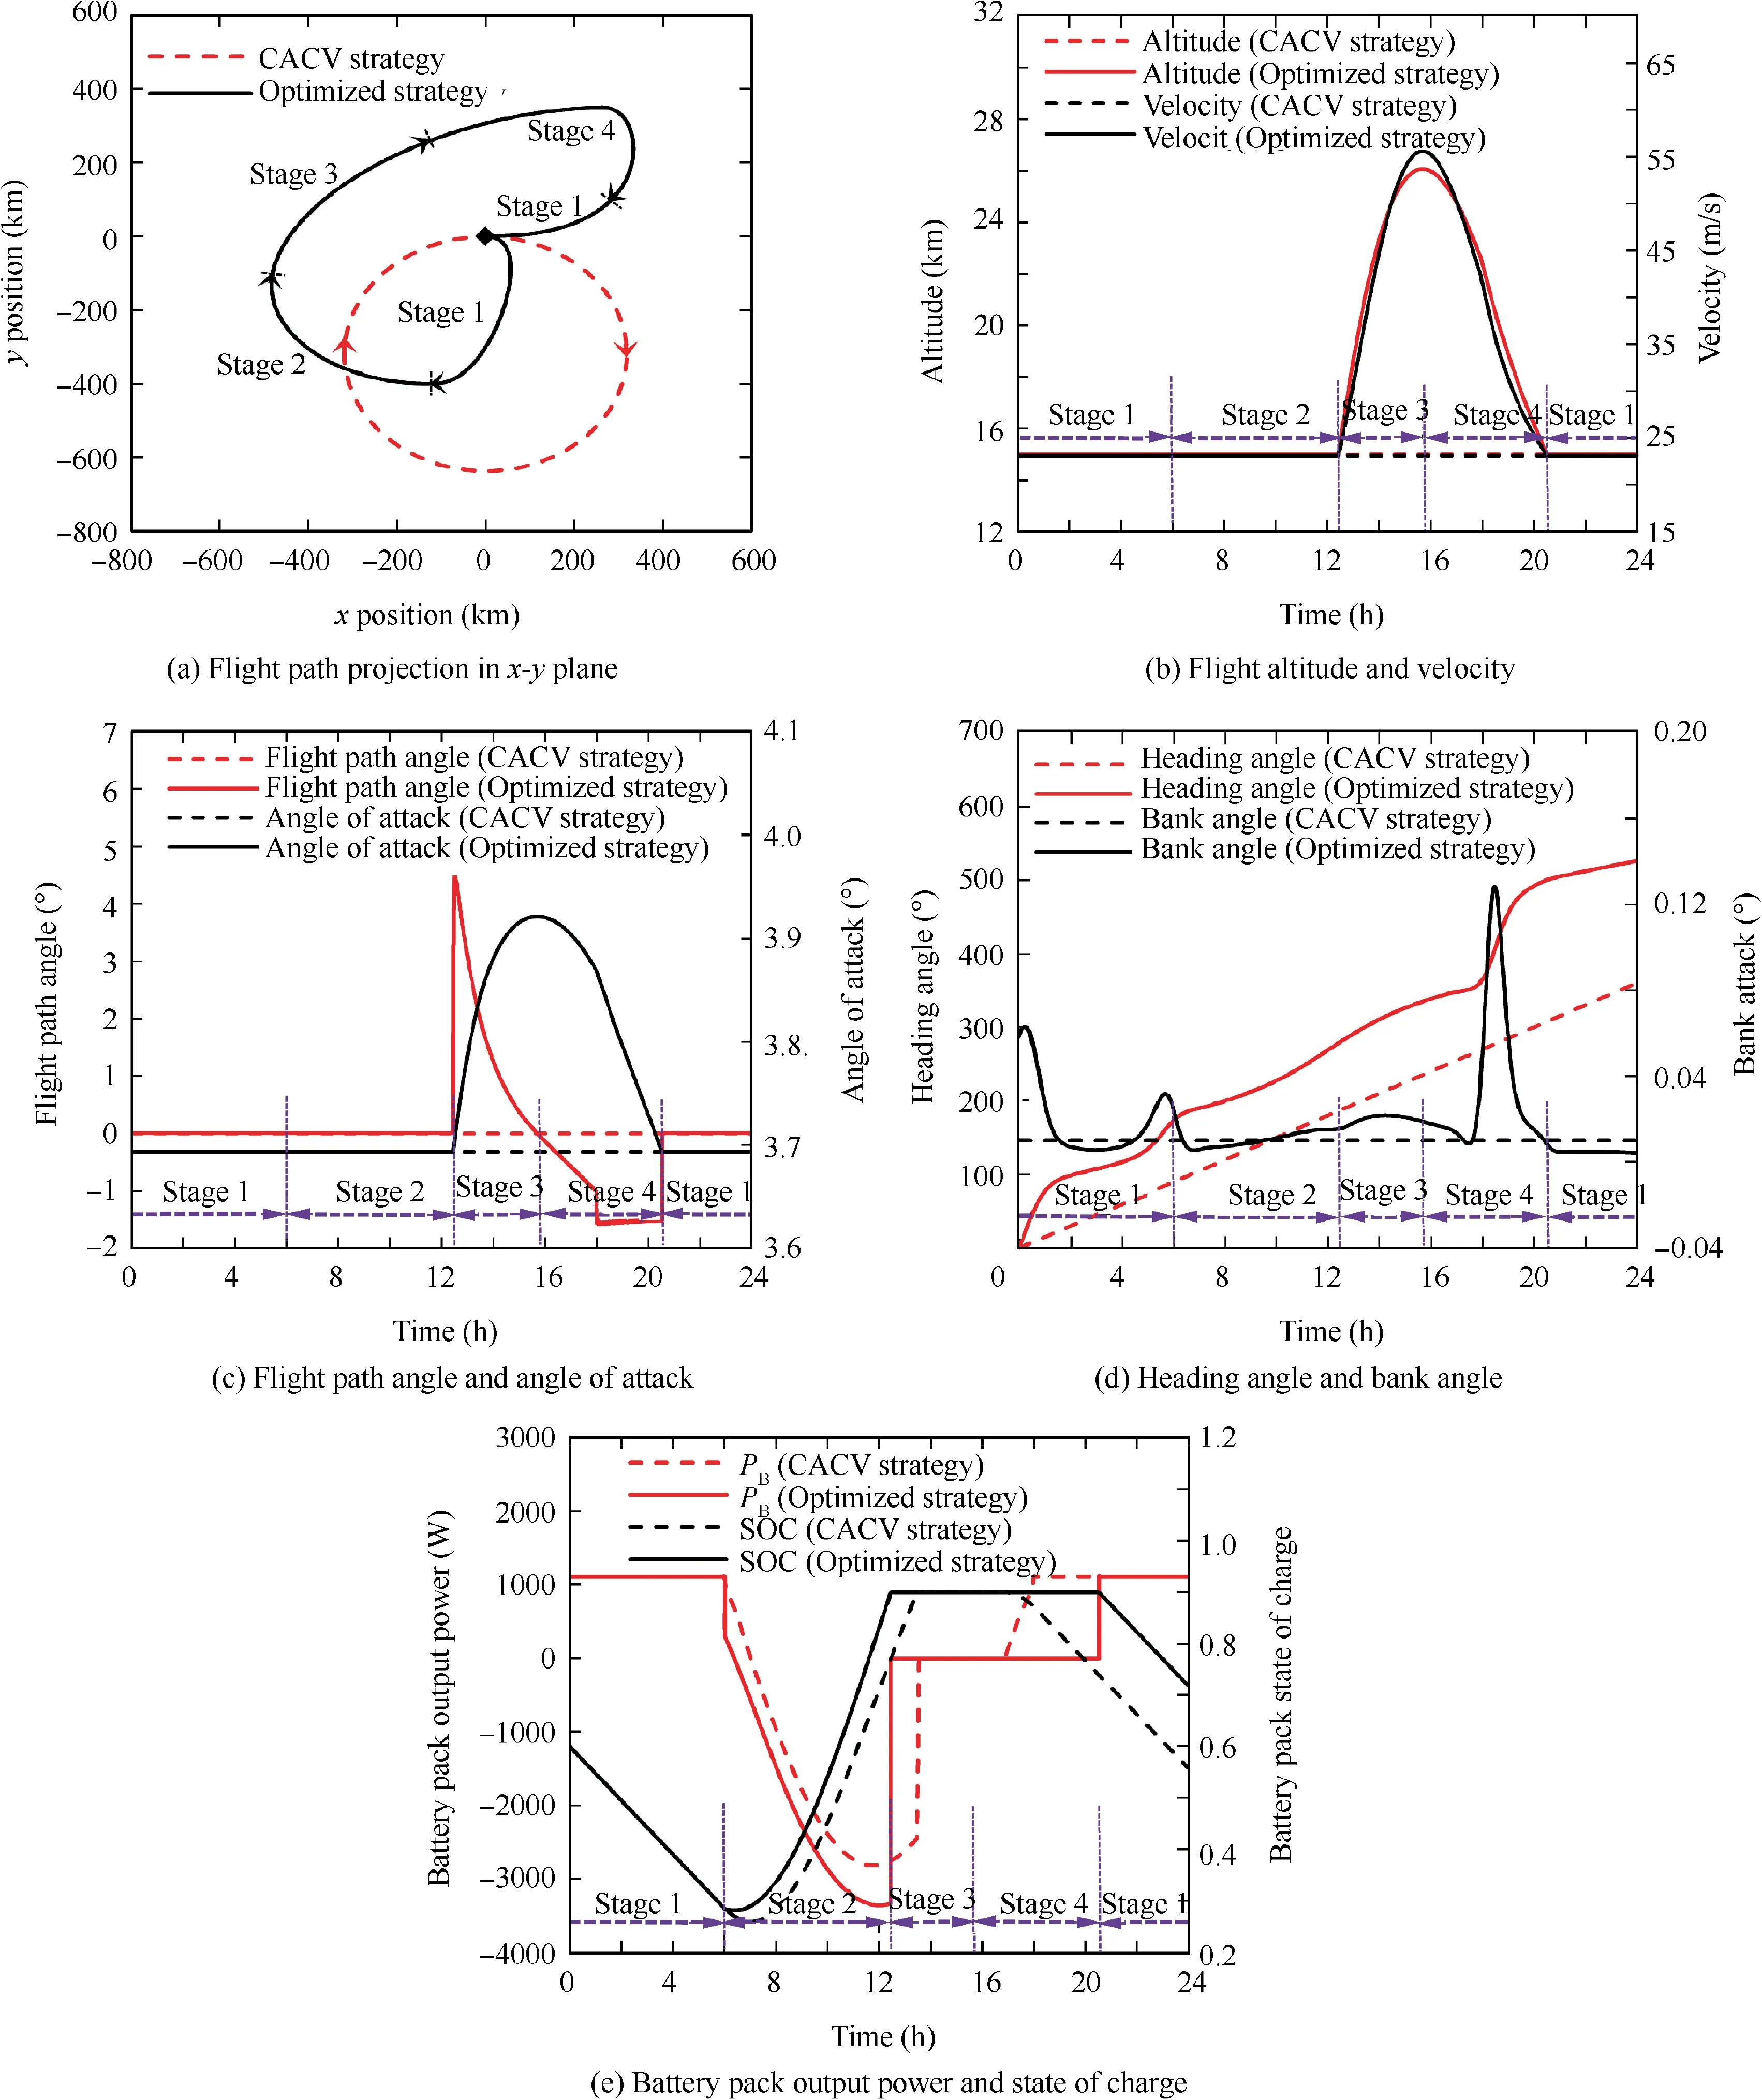
Fig. 7 Comparison of CACV strategy and optimized strategy.
When t <6.4 h, the solar power is insufficient to sustain level flight, the battery pack and photovoltaic cells supply power together, as illustrated in Fig. 5(b). Accordingly, the battery pack output power has a sudden drop at t=6 h.While t=6.4 h, SOC reaches the minimum value, 0.282,which is within the limited range. After that, the excess power is used to charge the battery pack until SOC=0.9. As the solar elevation angle increases, the charging power reaches a local maximum value, 3360 W, at 12 o’clock.
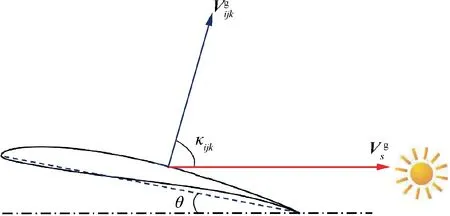
Fig. 8 Schematic diagram of incidence angle at αe=0.
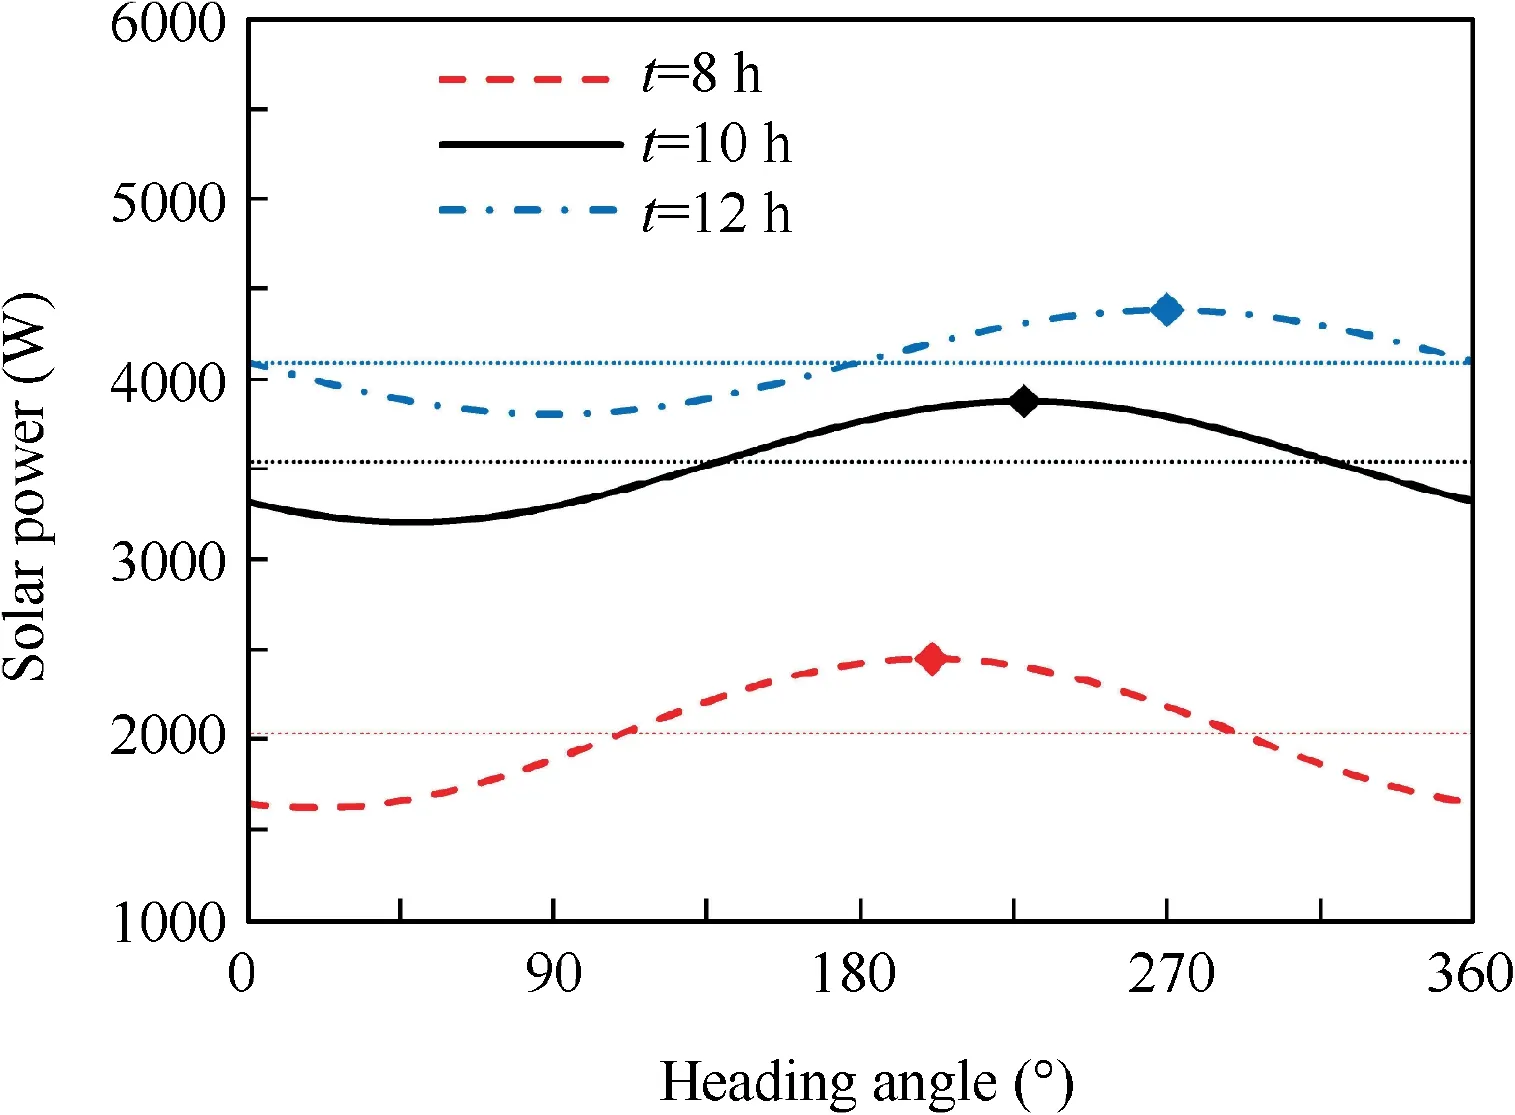
Fig. 9 Solar power versus heading angle.
Similar to the previous stage, the aircraft flies at the minimum altitude, 15 km. The flight velocity in this stage is also close to the minimum-power velocity, 23.1 m/s. During this stage, the aircraft flies with small bank angle to change the heading direction in order to gain more energy. The heading angle increases from 180° to 280°, while the solar azimuth angle increases from-90°to 10°.The difference between these two angles is always about 270° in this stage, as shown in Fig. 10. Note that solar azimuth angle is defined to be -90°when the sun is due east and the heading angle is defined to be 0°when the nose of aircraft faces east.It means that the aircraft always turns its back towards the sun, tracking the maximum power points in Fig. 9.
When the aircraft utilizes the changes of heading angle to gain more solar power,the additional power required for flight caused by bank angle is negligibly small.If the aircraft utilizes the changes of bank angle to increase the solar power directly,the power required for flight increases at the same time.Besides,the heading angle changes rapidly,inevitably decreasing the solar power after a short profitable time, which is not applicable for long-endurance flight. Therefore, it is beneficial to utilize the heading angle rather than the bank angle for HALE aircraft to gain more solar energy.
In this stage,the net energy is increased by 2.97 kWh compared with CACV strategy in this way.
Stage 2 ends when SOC reaches the maximum value, 0.9.
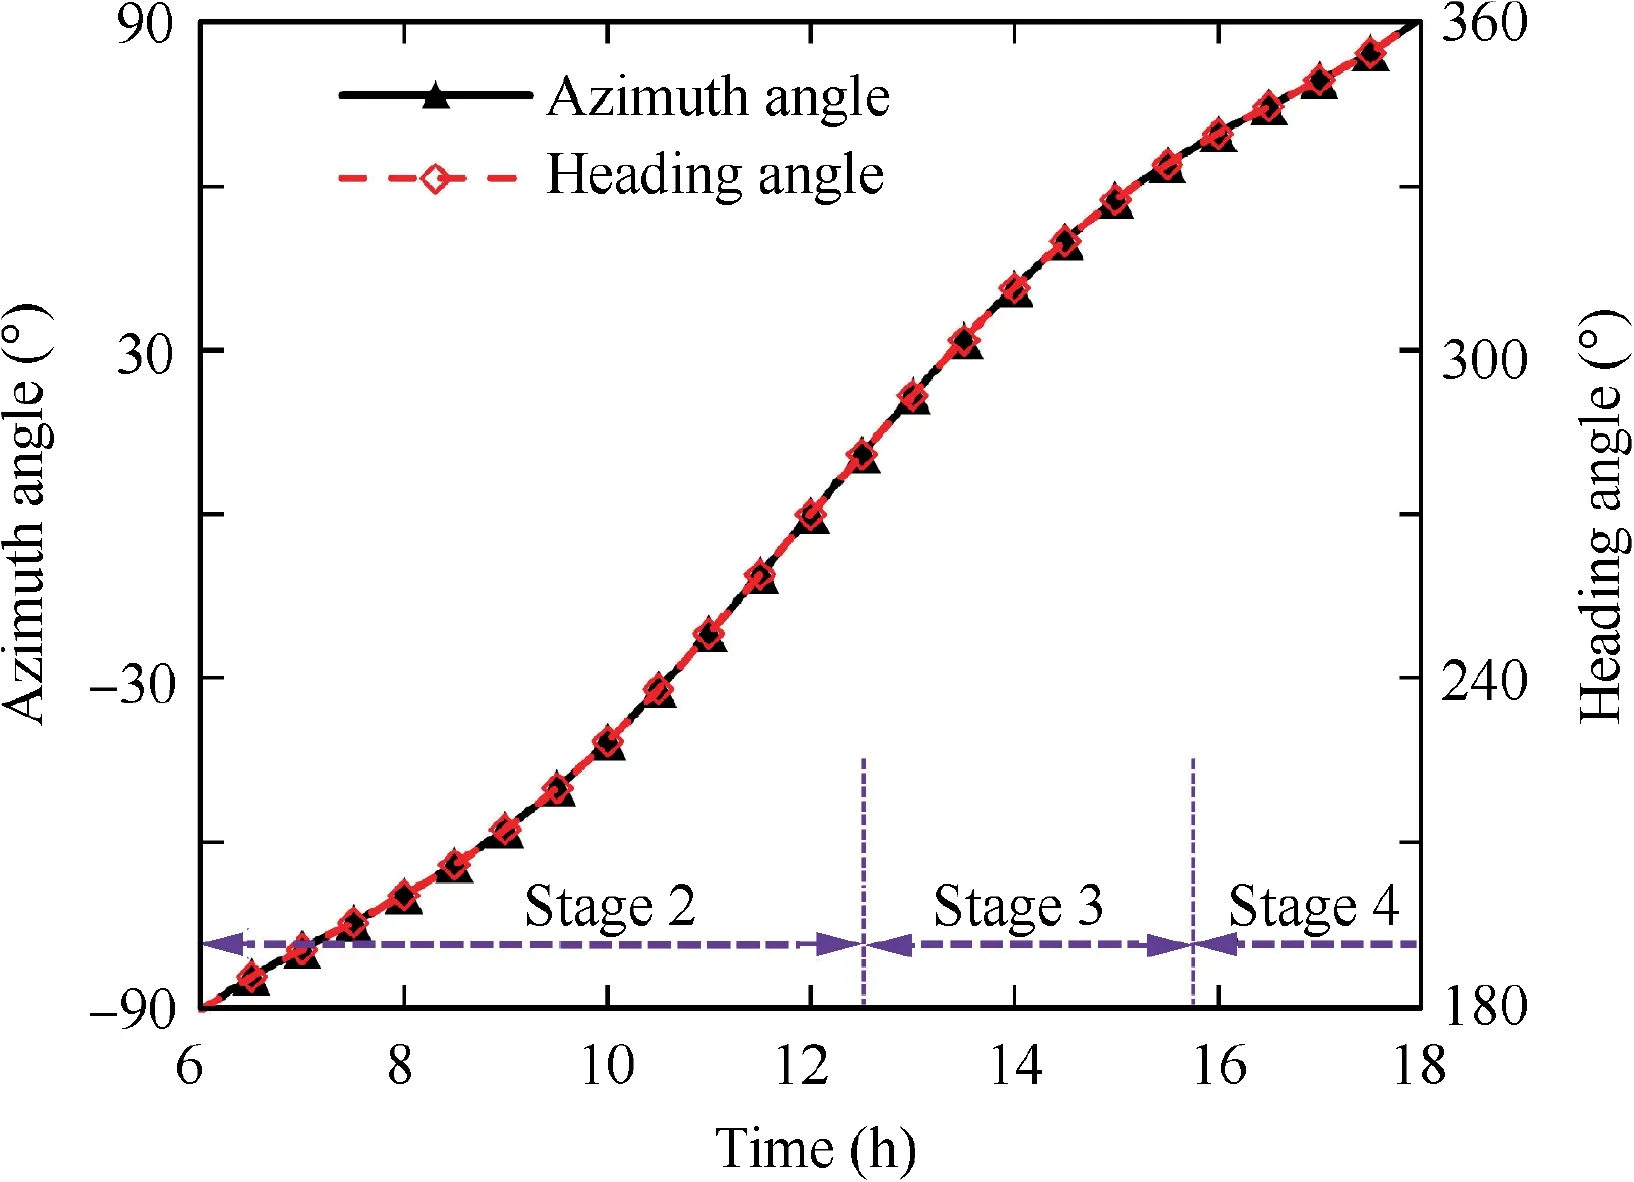
Fig. 10 Solar azimuth angle and aircraft heading angle.
4.2.5. Stage 3: ascent flight
Since the battery has been fully charged, the aircraft keeps ascending using excess power with the velocity closing to the minimum-power velocity corresponding to current altitude.
The initial climb rate is 1.9 m/s and the initial path angle is 4.5°which causes a sudden increase of solar power.As demonstrated in Fig. 5(b), in this stage, the power required increases with altitude while the power collected decreases with time.Then at t=15.7 h, the climb rate decreases to zero. Meanwhile the maximum altitude, 26.1 km, is reached. The ascent flight lasts for 3.2 h,during which the aircraft stores a gravitational potential energy of 4.0 kWh using an altitude difference of 11.1 km.Similar to Stage 2,the aircraft changes the heading direction to track the maximum power points in Fig. 9. The energy collected in this stage is increased by 2.17 kWh compared with CACV strategy.
Note that more power is required for level flight as flight altitude increases. Under the condition of certain total solar energy,the more energy required for level flight,the less energy left to charge the battery or to ascend to store gravitational potential energy. Therefore, it is better for aircraft to charge the battery before ascent flight rather than charge the battery at a higher altitude. The optimized strategy accords with this characteristic.
Stage 3 ends when the excess power decreases to zero.
4.2.6. Stage 4: descent flight
The aircraft begins to descend since the power collected by photovoltaic cells is not enough to maintain the level flight at the current altitude. Before sunset, the solar power decreases and the descent rate increases gradually. However,the thrust remains positive for longer descent time. By changing heading direction, the net energy collected in this period of time is increased by 1.38 kWh compared with CACV strategy. After sunset, the aircraft uses gravitational potential energy to glide without power. The descent flight lasts for 4.8 h.
Stage 4 ends when the aircraft reaches 15 km.Then Stage 1 starts again and forms a closed loop.Throughout the Stage 3-4, the aircraft store and release the gravitational potential energy, which partly takes the role of battery pack.
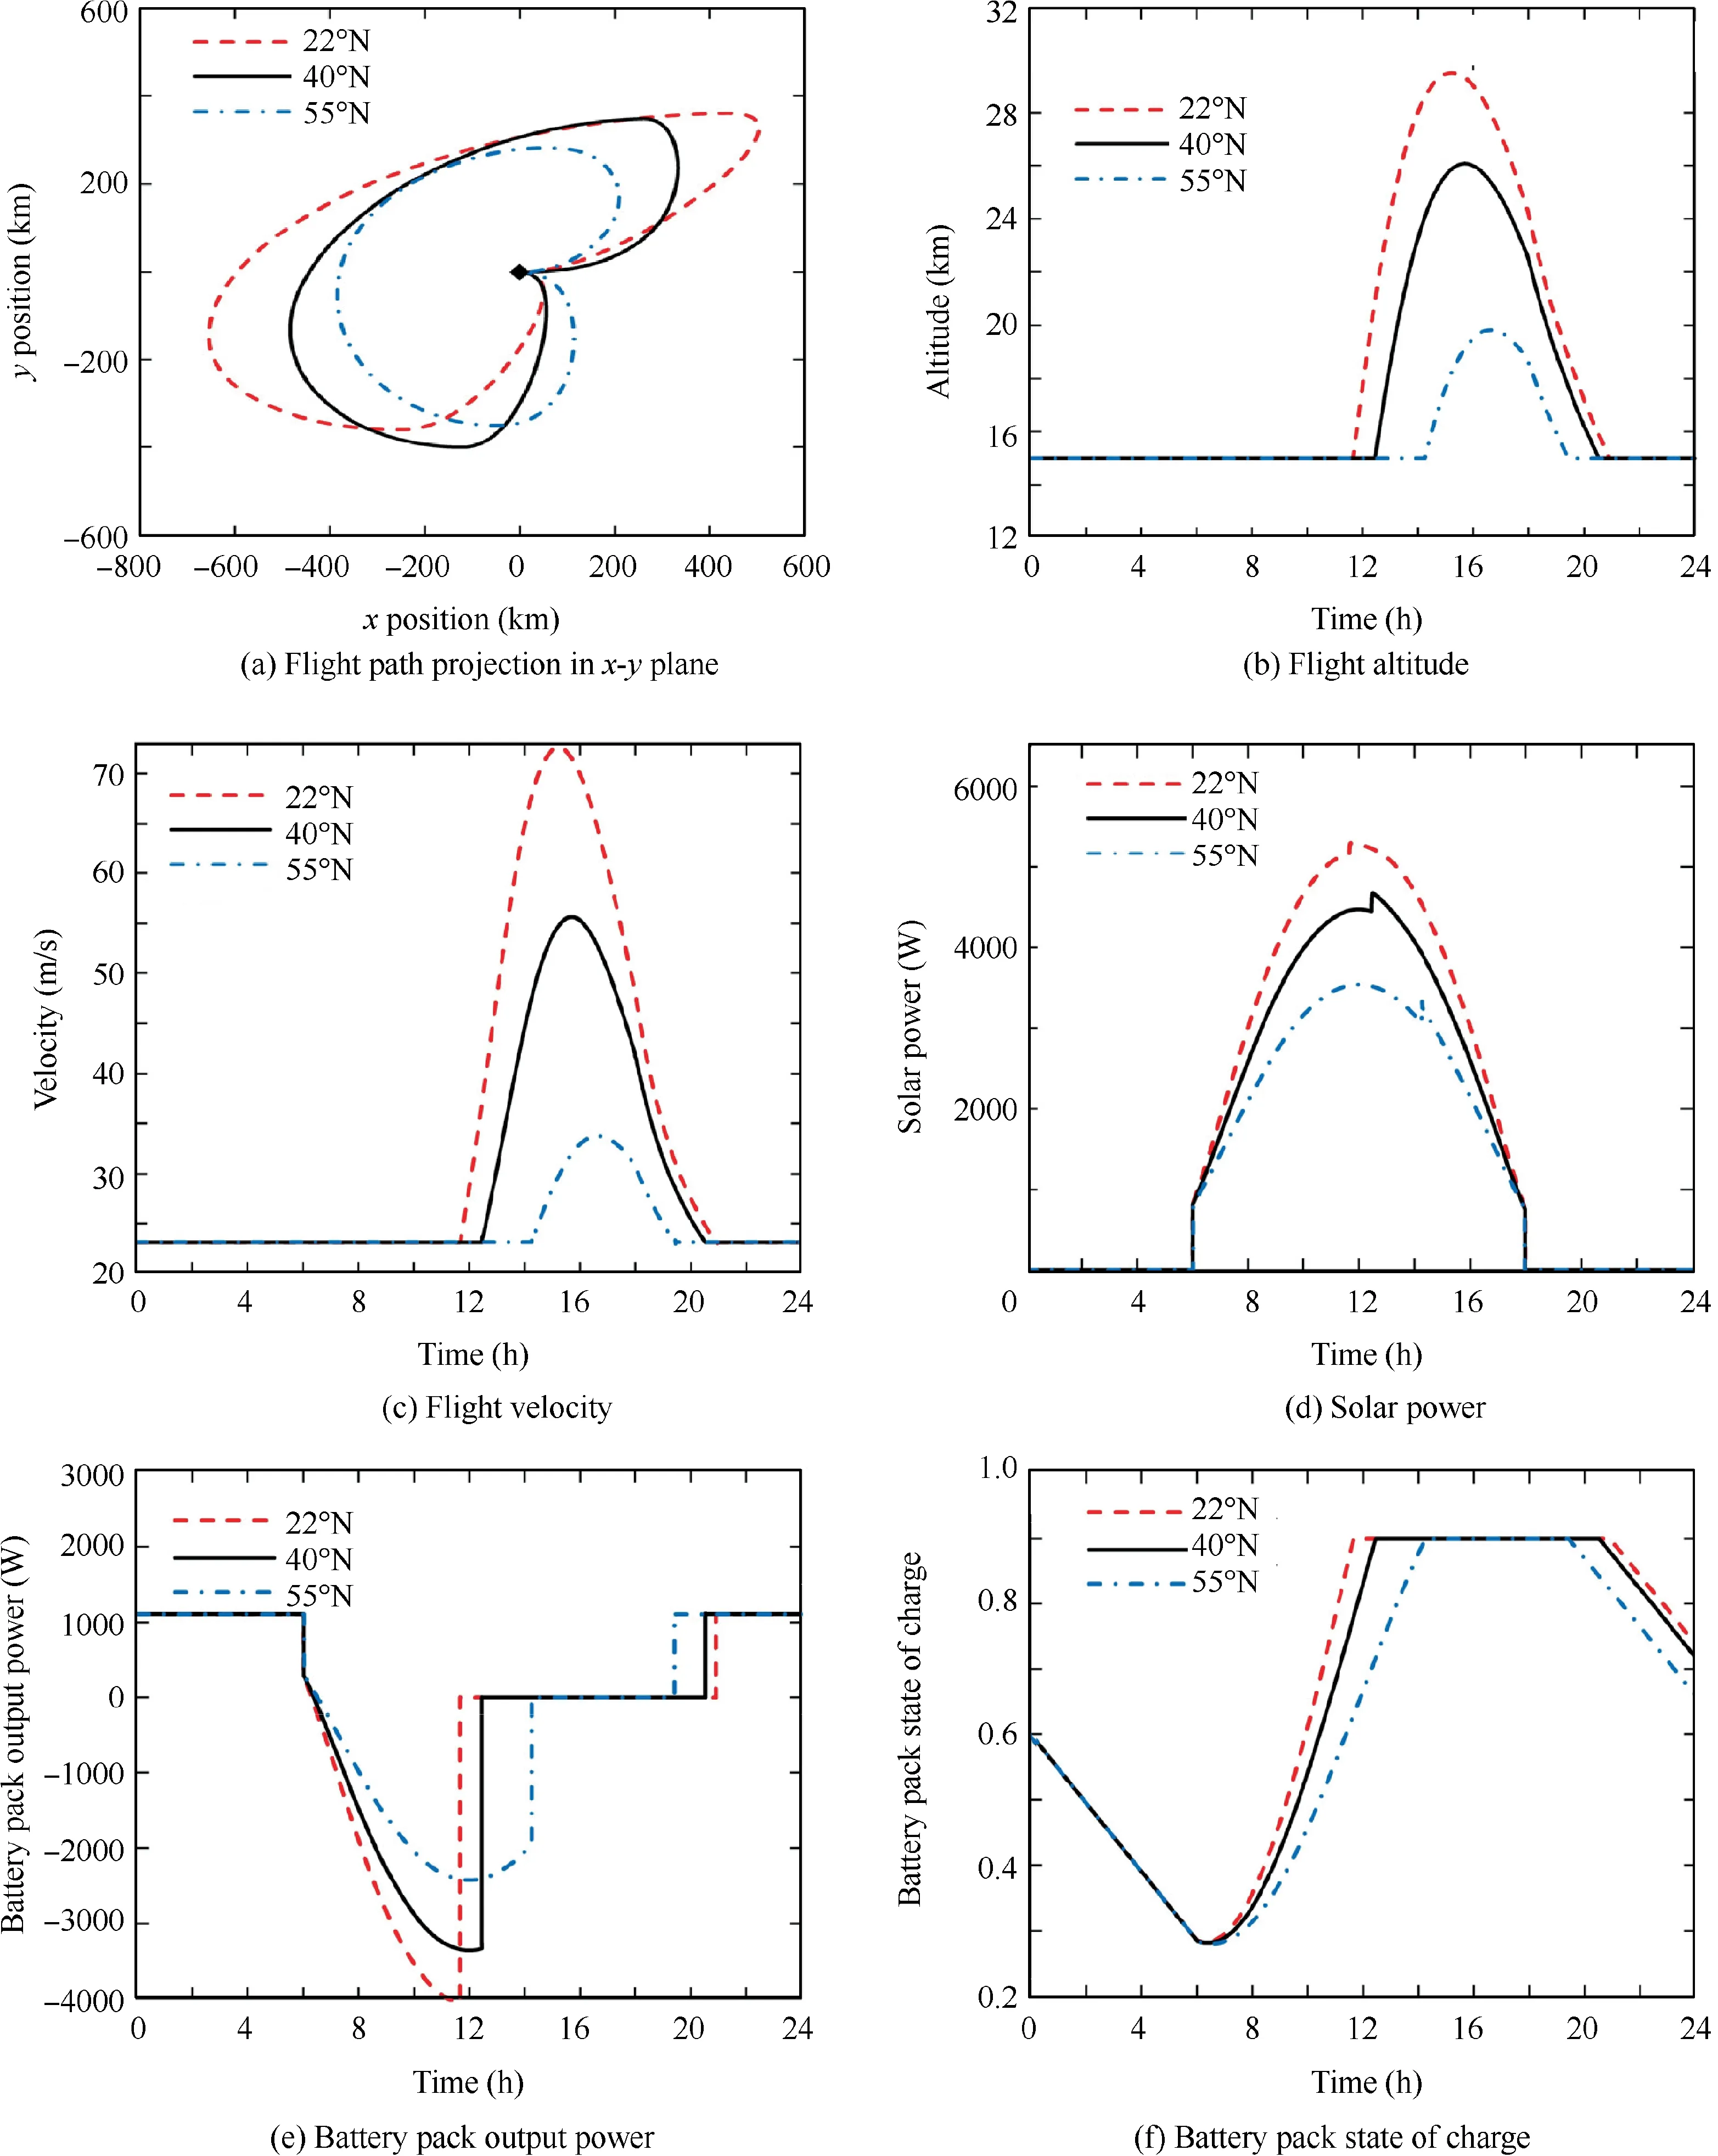
Fig. 11 Comparison of optimization results in different regions.
4.3. Influence of flight region on optimization results
The sunlight intensity has great effect on the power collected by photovoltaic cells. Here, optimization is implemented in three flight regions: Hong Kong (22° N), Beijing (40° N),and Moscow (55° N), where the flight date is fixed on March 21st.In these instances,the daylight hours are almost the same(about 12 hours).
Results show that the optimized strategies have similar characteristics in different flight regions, as shown in Fig. 11.Each strategy can be divided into four stages:level flight,level flight and charging, ascent flight, and descent flight, as described in Section 4.2. Each result satisfies the process constraints, such as the minimum flight altitude (Fig. 11(b)) and the minimum value of SOC (Fig. 11(f)), etc.
During Stage 2-4,the aircraft changes heading angle to collect more solar power and each strategy features a difference of 270° between the heading angle and solar azimuth angle. The reasons are explained in the previous section. During Stage 3 and 4,the gravitational potential energy is stored and released.The gravitational potential energy is stored and released in Stage 3 and 4.
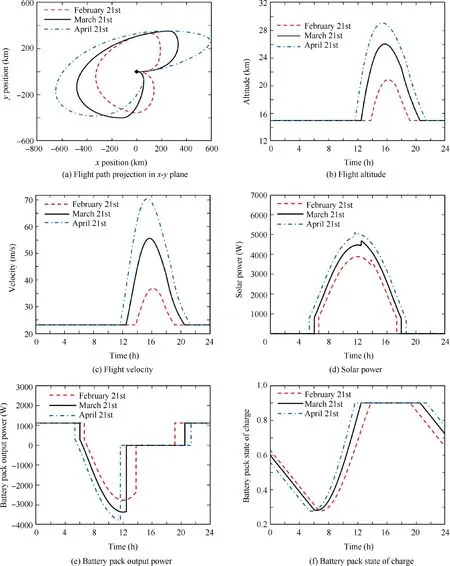
Fig. 12 Comparison of optimized strategy in different seasons.

Table 7 Simulation results of CACV strategy and optimized strategy in different regions.

Table 8 Simulation results of CACV strategy and optimized strategy in different seasons.
The sunlight intensity is higher at 22° N and the solar power is higher than that of 40° N and 55° N. Accordingly,the battery pack can be fully charged at an earlier time and the aircraft is able to reach a higher altitude then glide a longer time after sunset.The total flight distance in the day-night circle is also longer because of the larger flight velocity in daytime. The optimization results of 55° N feature an opposite trend since the sunlight intensity is relatively lower.
Table 7 lists the simulation results of optimized strategy and corresponding CACV strategy in different regions. Comparing to CACV strategy, the optimized strategy increases total solar energy by 14.3%, 21.0%, and 30.6% at 22° N,40°N,and 55°N,respectively.The increment improves as latitude increases since the influence of heading angle on solar power is more obvious at small solar elevation angle, as demonstrated in Fig. 9.
Comparing to CACV strategy, the optimized strategy increases SOCfby 16.0, 16.1 and 24.0 percentage points at 22° N, 40° N, and 55° N, respectively. Note that in CACV strategy, the aircraft is not able to accomplish the day-night circle without energy reduction in battery pack, which means the aircraft won’t be able to flight for weeks without stopping in these three instances. Significantly, SOCf>SOC0holds in optimized strategy, which supports longer flight endurance.
4.4. Influence of flight season on optimization results
Here, three flight dates: February 21st, March 21st, and April 21st are considered and the flight region is fixed in Beijing(40°N). Results indicate that the optimized strategies have similar characteristics on different flight dates, as shown in Fig. 11.Each strategy can be divided into four stages as described in Section 4.2. On April 21st, the sunlight intensity is higher and daytime is longer. Accordingly, the battery pack can be fully charged at an earlier time and the aircraft is able to reach a higher altitude then glide a longer time after sunset.The total flight distance in the day-night circle is also longer because of the larger flight velocity in daytime.The optimization results of February 21st feature an opposite trend.
The simulation results of optimized strategy and corresponding CACV strategy in different seasons are listed in Table 8.Comparing to CACV strategy,the optimized strategy improves total solar energy by and 27.0%, 21.0%, and 16.7%while increases the SOCfby 18.3, 16.1 and 15.9 percentage points on February 21st, March 21st, and April 21st, respectively.It can be seen that optimized strategy brings more profits on condition of lower sunlight intensity and shorter daytime.This conclusion is consistent with that of region influence study. Significantly, the optimized strategy makes SOCf>SOC0holds in these three instances, which expands the aircraft of closed-loop flight capability.
5. Conclusions
(1) Gauss pseudo-spectral method is applicable to flight strategy optimization problem for high-altitude longendurance solar-powered aircraft due to its advantages in treating process constraints and terminal constraints.
(2) By comprehensive utilization of changing attitude angle and flight altitude,the optimized flight strategy is able to increase the power of photovoltaic cells and the final state of charge of battery pack compared with constant-altitude constant-velocity strategy.
(3) The optimized flight strategy consists of four stages:level fight, level fight and charging, ascent flight, and decent flight. It is beneficial to utilize the heading angle rather than the bank angle to gain more solar energy in long-endurance flight.During daytime,turning the back of aircraft towards the sun contributes to increasing the solar power. Charging the battery before ascent flight brings more energy profits than charging at a higher altitude.
(4) The optimized strategy can increase the solar power and battery pack state of charge in different regions and seasons.The optimized strategy brings more profits on condition of lower sunlight intensity and shorter daytime.
 CHINESE JOURNAL OF AERONAUTICS2019年10期
- CHINESE JOURNAL OF AERONAUTICS的其它文章
- Design and analysis of a hypersonic inlet with an integrated bump/forebody
- Experimental study of effect of post processing on fracture toughness and fatigue crack growth performance of selective laser melting Ti-6Al-4V
- Efficient and accurate online estimation algorithm for zero-effort-miss and time-to-go based on data driven method
- Experimental and numerical investigation of threedimensional vortex structures of a pitching airfoil at a transitional Reynolds number
- A methodology for simulating 2D shock-induced dynamic stall at flight test-based fluctuating freestream
- Robust adaptive compensation control for unmanned autonomous helicopter with input saturation and actuator faults
