
Huayou Cobalt Scored Growth In Production And Sales Of New Cobalt Materials, And Accelerated Transformation And upgrading
2019-12-11 08:43:54
China Nonferrous Metals Monthly 2019年12期
Huayou Cobalt Scored Growth In Production And Sales Of New Cobalt Materials, And Accelerated Transformation And upgrading
Zhejiang Huayou Cobalt Co., Ltd. (“Huayou Cobalt”) is mainly engaged in manufacturing new energy lithium battery materials and new cobalt materials, including ternary precursors of lithium battery materials and new cobalt materials as cobaltosic oxide and cobaltous sulfate. Based on the financial report of H1 2019 of Huayou Cobalt, it realized an operating income of RMB 9.104 billion, up by 34.21% on a year-on-year basis.
In H1 2019, under the pressure of weak market price of cobalt products, Huayou Cobalt endeavored to give play to its own advantages, and successfully improved the performance of the first two quarters on a month-on-month basis. Specifically, in H1 2019, Huayou Cobalt produced 12,600-ton cobalt products (up by 17.79% on a year-on-year basis) and sold 12,800-ton cobalt products (up by 37.16% on a year-on-year basis), which fully demonstrated the leading position of Huayou Cobalt.
Based on the data published by CAAM, in H1 2019, the production and sales of battery electric vehicles reached 490,000 and 493,000 respectively, up by 56.6% and 57.3% on a year-on-year basis respectively, and the positive terminal market data revealed the vitality of new energy industry and huge demand for cathode materials. Currently, the core products of Huayou Cobalt have been included in the supply chain of world-famous new energy lithium battery enterprises as LG CHEM, CATL, BYD, POSCO, and it has carried out strategic collaboration with new energy electric vehicle and energy storage enterprises as TESLA, connected, expanded and deeply optimized the application channel of downstream products, and accelerated the transformation to supply of new energy lithium battery materials.
Moreover, Huayou Cobalt paid high attention to the industry chain layout, formed a vertically integrated industry chain in three segments of resources, non-ferrous metals and new energy, and actively explored the recycling segment, in order to fully create a circular industry ecosystem covering cobalt-nickel resources, smelting, ternary precursors, cathode materials for lithium ion batteries and resources recycling.
Unit: metric ton
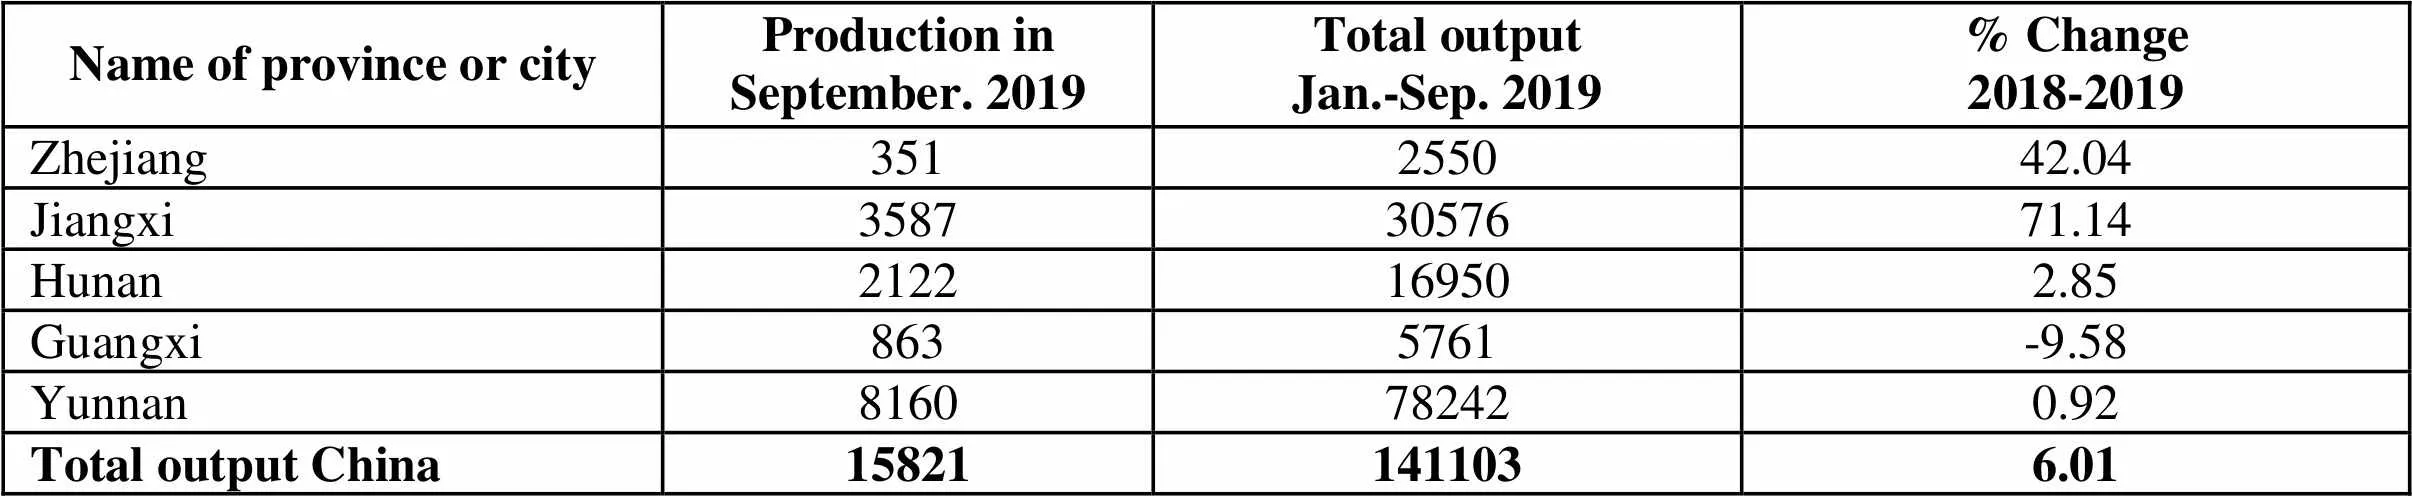
Name of province or cityProduction inSeptember. 2019Total outputJan.-Sep. 2019% Change2018-2019 Zhejiang351255042.04 Jiangxi35873057671.14 Hunan2122169502.85 Guangxi8635761-9.58 Yunnan8160782420.92 Total output China158211411036.01
< Unit: metric ton
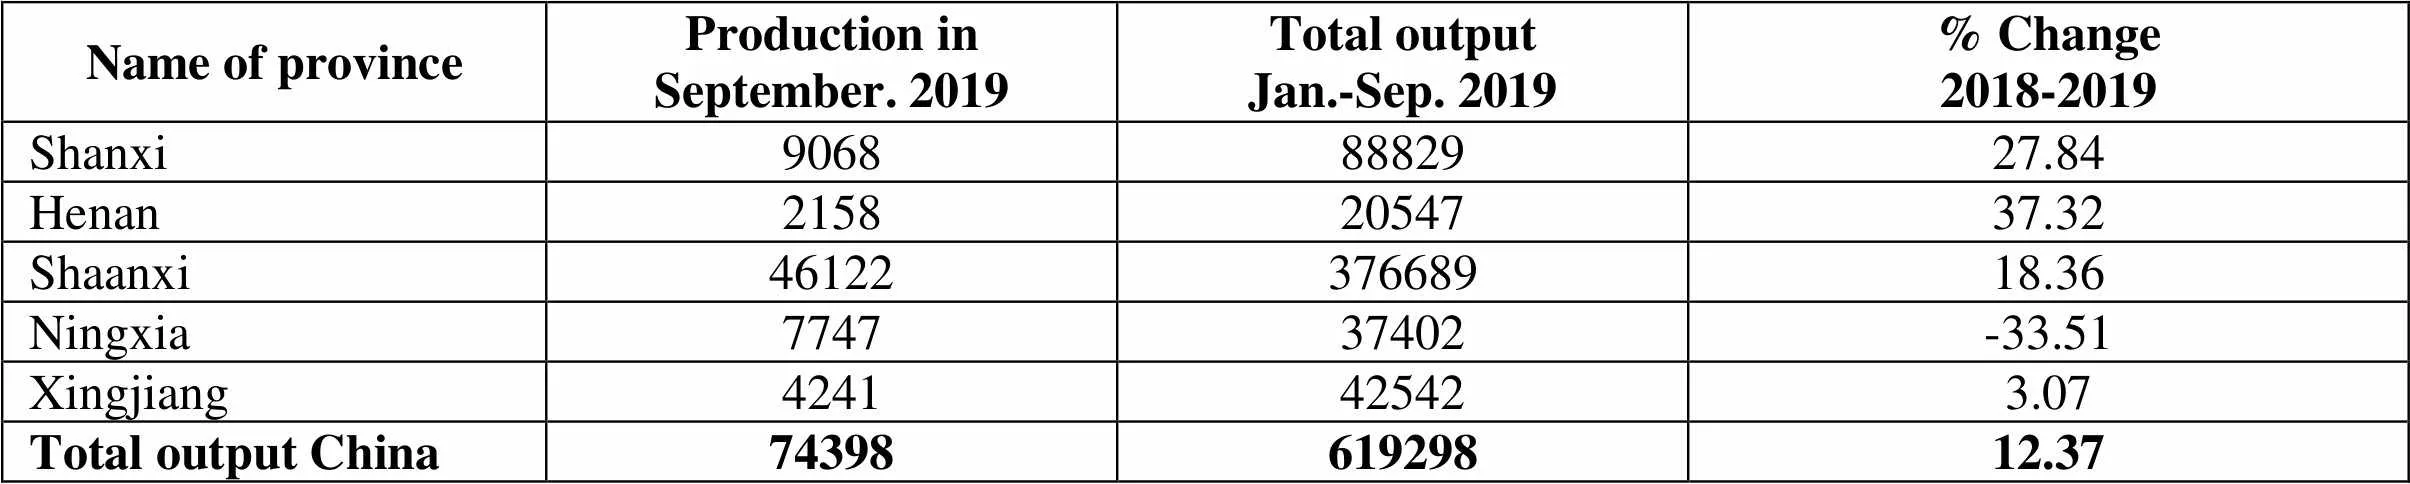
Name of provinceProduction inSeptember. 2019Total outputJan.-Sep. 2019% Change2018-2019 Shanxi90688882927.84 Henan21582054737.32 Shaanxi4612237668918.36 Ningxia774737402-33.51 Xingjiang4241425423.07 Total output China7439861929812.37
Unit: metric ton
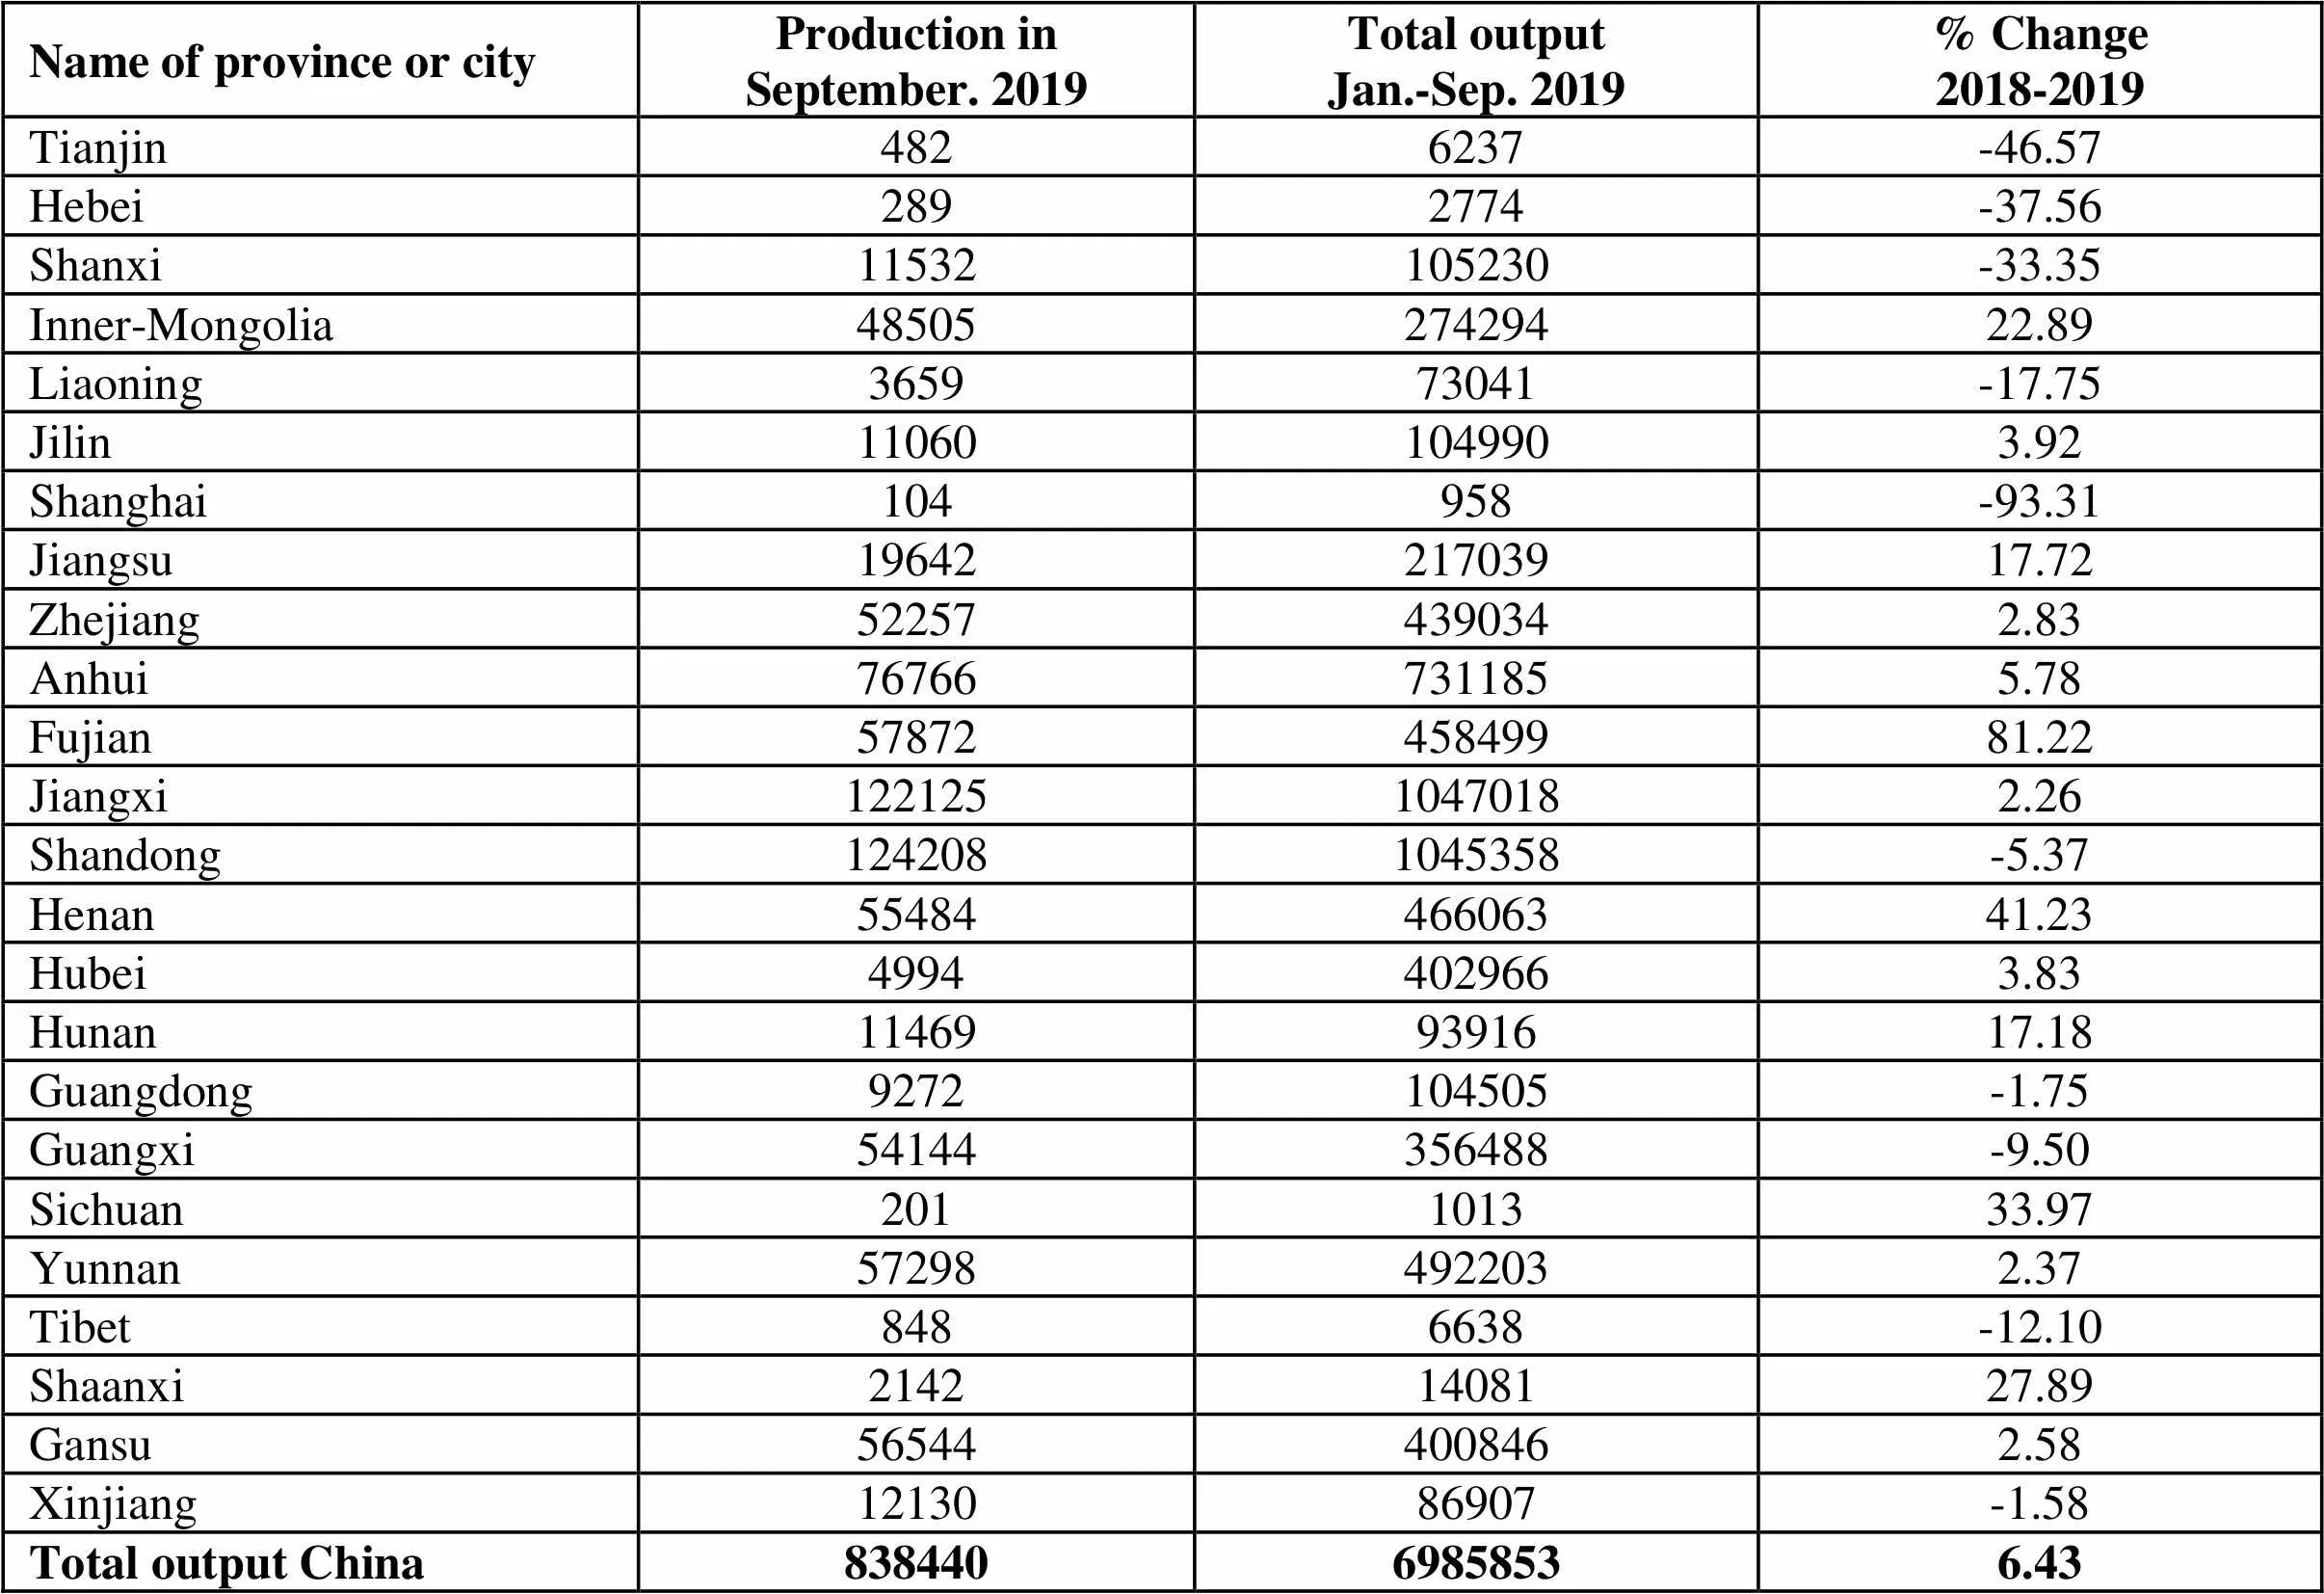
Name of province or cityProduction inSeptember. 2019Total outputJan.-Sep. 2019% Change2018-2019 Tianjin4826237-46.57 Hebei2892774-37.56 Shanxi11532105230-33.35 Inner-Mongolia4850527429422.89 Liaoning365973041-17.75 Jilin110601049903.92 Shanghai104958-93.31 Jiangsu1964221703917.72 Zhejiang522574390342.83 Anhui767667311855.78 Fujian5787245849981.22 Jiangxi12212510470182.26 Shandong1242081045358-5.37 Henan5548446606341.23 Hubei49944029663.83 Hunan114699391617.18 Guangdong9272104505-1.75 Guangxi54144356488-9.50 Sichuan201101333.97 Yunnan572984922032.37 Tibet8486638-12.10 Shaanxi21421408127.89 Gansu565444008462.58 Xinjiang1213086907-1.58 Total output China83844069858536.43
Unit: metric ton
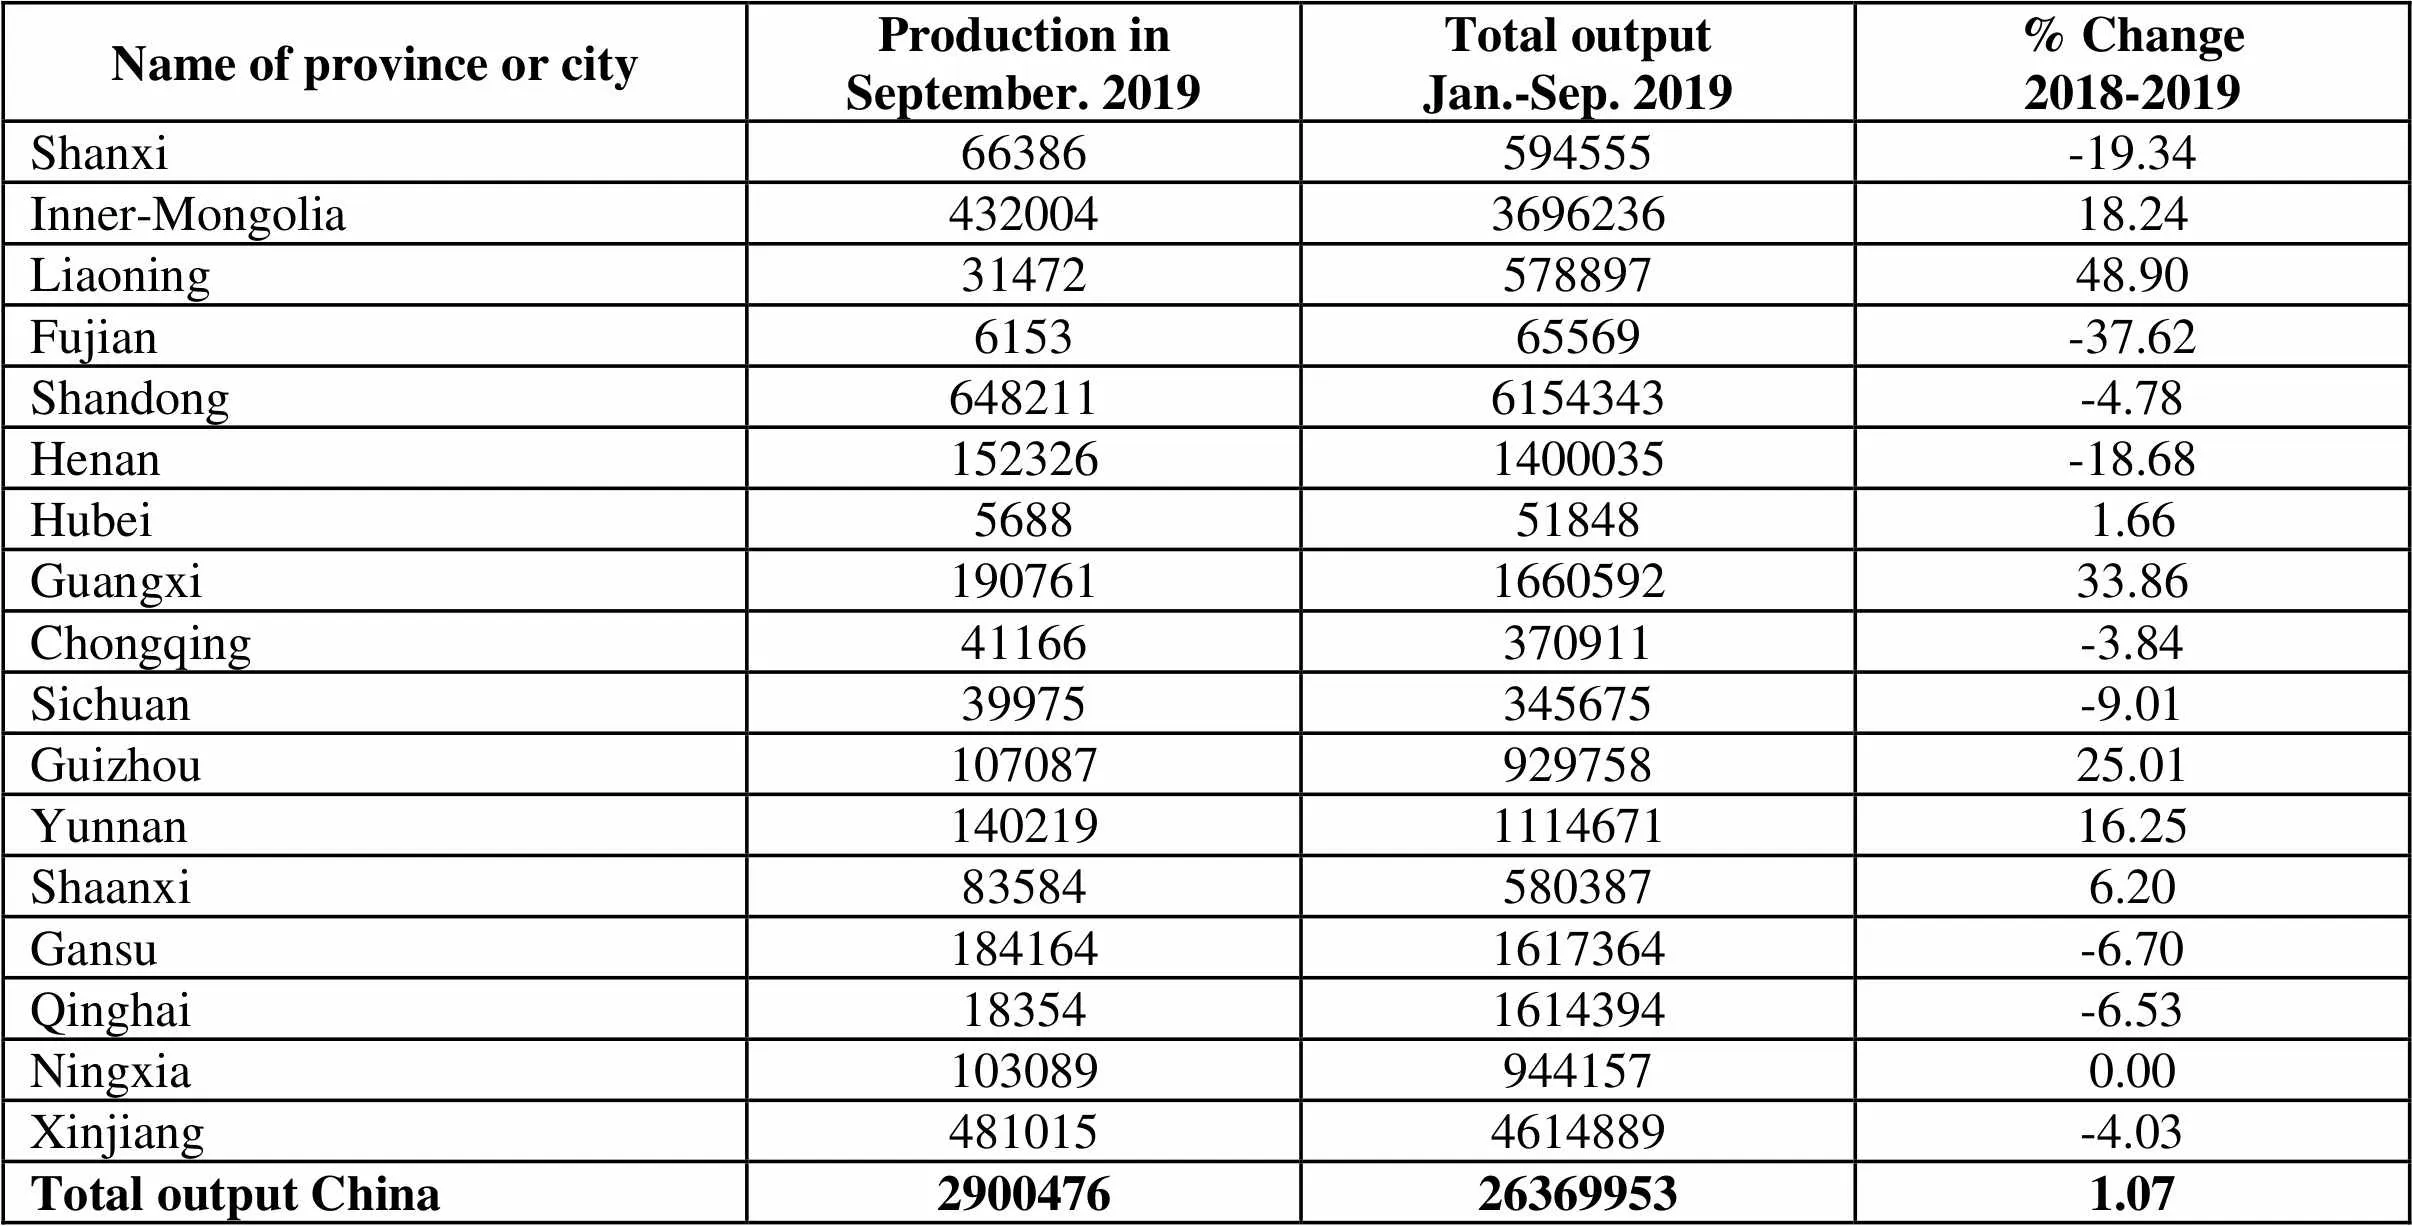
Name of province or cityProduction inSeptember. 2019Total outputJan.-Sep. 2019% Change2018-2019 Shanxi66386594555-19.34 Inner-Mongolia432004369623618.24 Liaoning3147257889748.90 Fujian615365569-37.62 Shandong6482116154343-4.78 Henan1523261400035-18.68 Hubei5688518481.66 Guangxi190761166059233.86 Chongqing41166370911-3.84 Sichuan39975345675-9.01 Guizhou10708792975825.01 Yunnan140219111467116.25 Shaanxi835845803876.20 Gansu1841641617364-6.70 Qinghai183541614394-6.53 Ningxia1030899441570.00 Xinjiang4810154614889-4.03 Total output China2900476263699531.07
Unit: metric ton
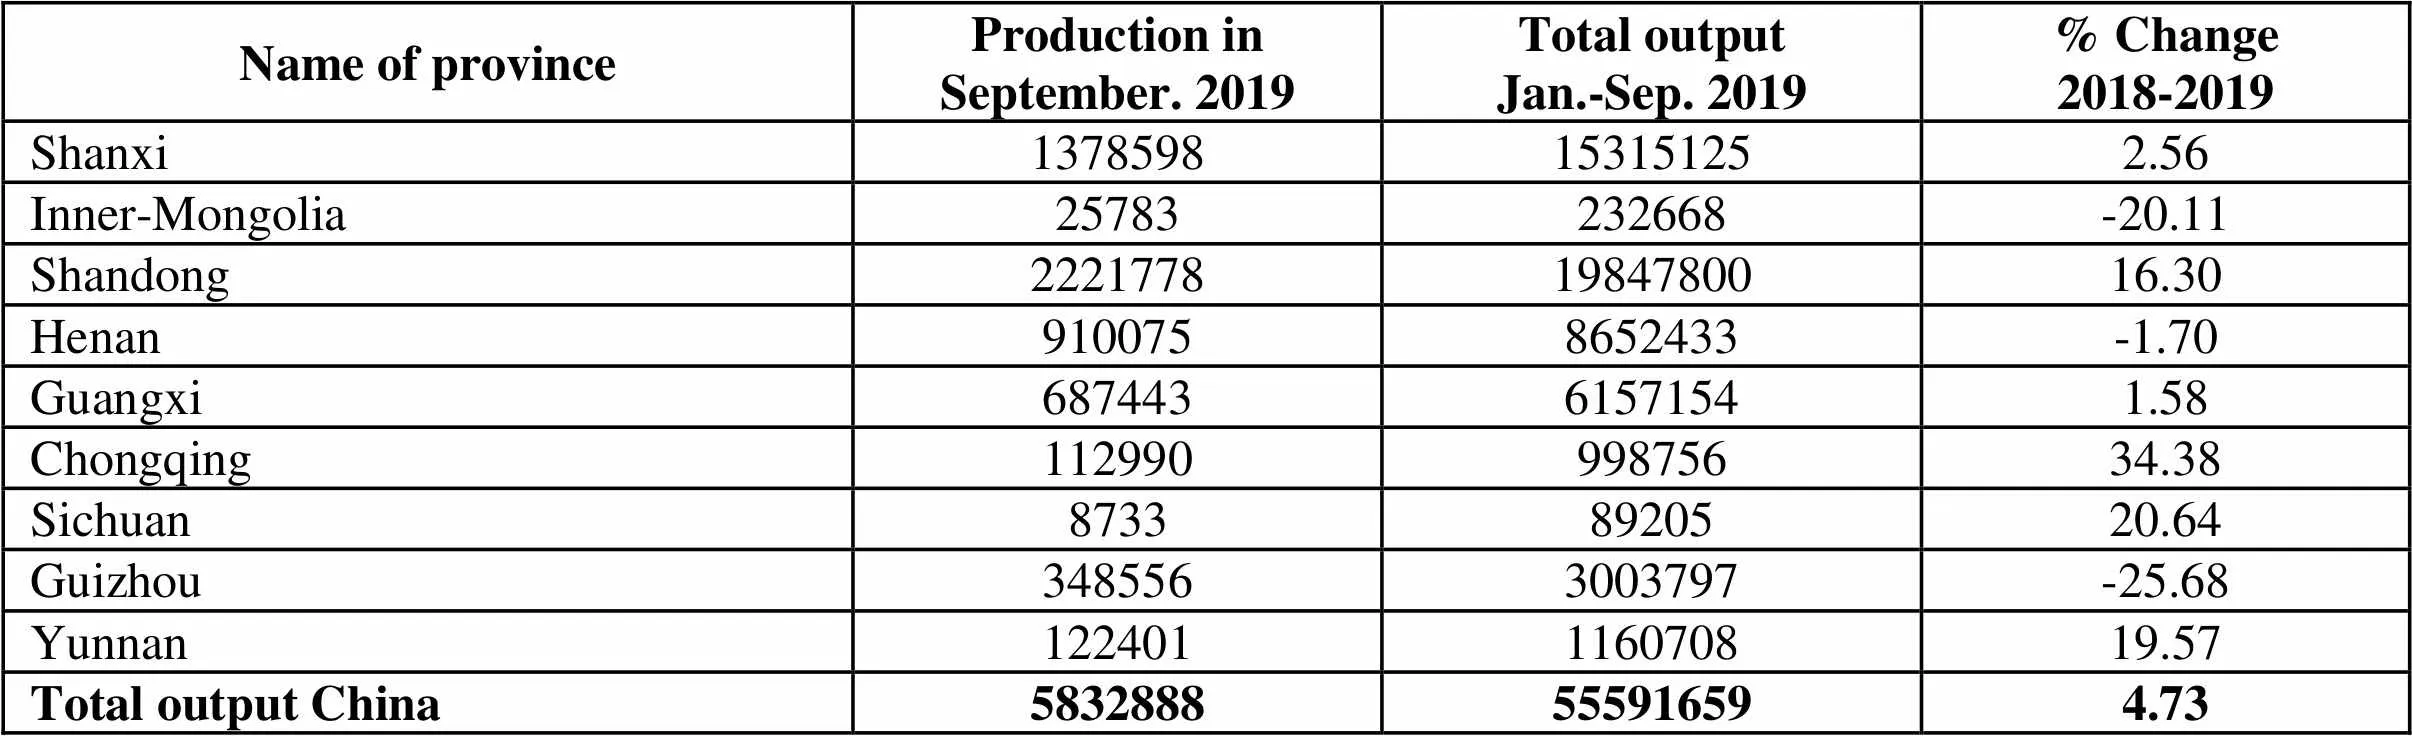
Name of province Production inSeptember. 2019Total outputJan.-Sep. 2019% Change2018-2019 Shanxi1378598153151252.56 Inner-Mongolia25783232668-20.11 Shandong22217781984780016.30 Henan9100758652433-1.70 Guangxi68744361571541.58 Chongqing11299099875634.38 Sichuan87338920520.64 Guizhou3485563003797-25.68 Yunnan122401116070819.57 Total output China5832888555916594.73
Unit: metric ton
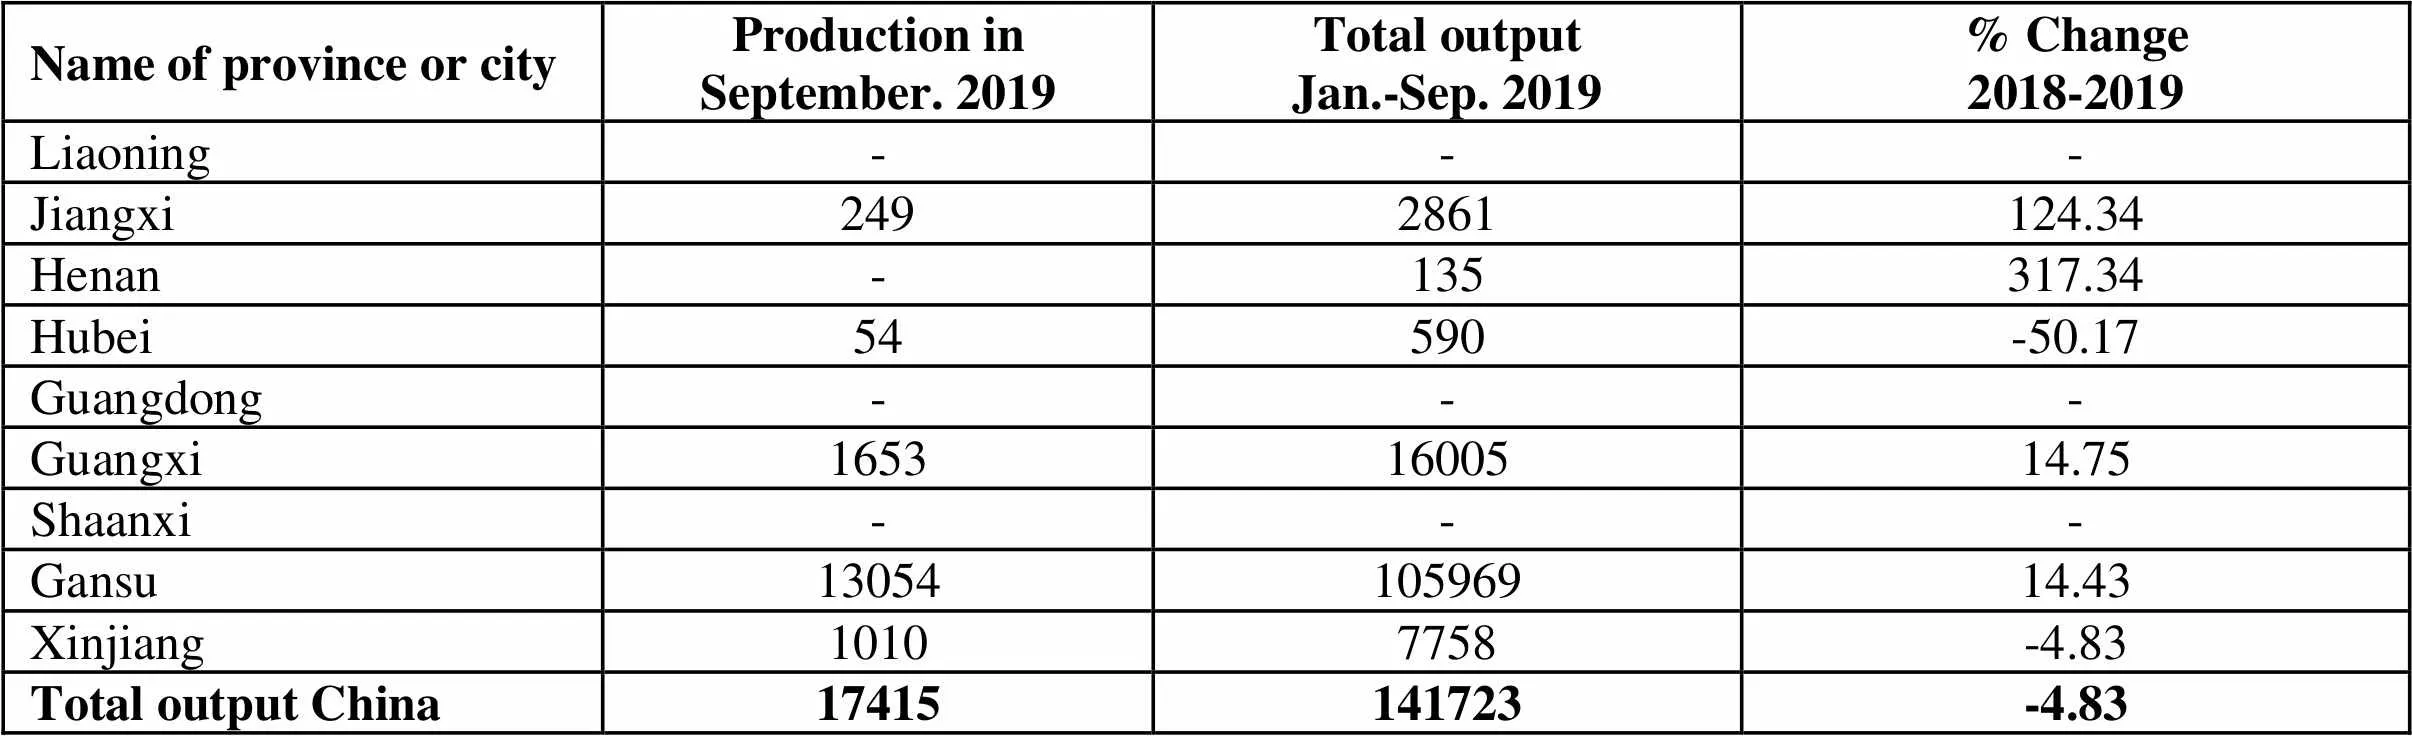
Name of province or cityProduction inSeptember. 2019Total outputJan.-Sep. 2019% Change2018-2019 Liaoning--- Jiangxi2492861124.34 Henan-135317.34 Hubei54590-50.17 Guangdong--- Guangxi16531600514.75 Shaanxi--- Gansu1305410596914.43 Xinjiang10107758-4.83 Total output China17415141723-4.83
Unit: metric ton
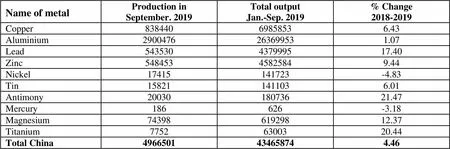
Name of metalProduction inSeptember. 2019Total outputJan.-Sep. 2019% Change2018-2019 Copper83844069858536.43 Aluminium2900476263699531.07 Lead543530437999517.40 Zinc54845345825849.44 Nickel17415141723-4.83 Tin158211411036.01 Antimony2003018073621.47 Mercury186626-3.18 Magnesium7439861929812.37 Titanium77526300320.44 Total China4966501434658744.46
Unit: metric ton
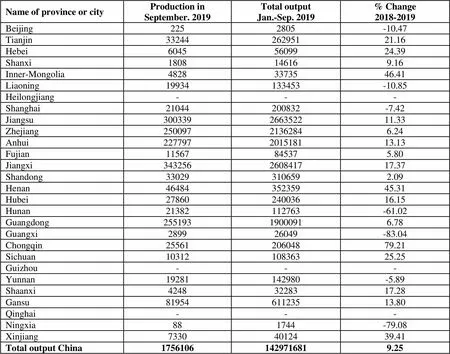
Name of province or cityProduction inSeptember. 2019Total outputJan.-Sep. 2019% Change2018-2019 Beijing2252805-10.47 Tianjin3324426295121.16 Hebei60455609924.39 Shanxi1808146169.16 Inner-Mongolia48283373546.41 Liaoning19934133453-10.85 Heilongjiang--- Shanghai21044200832-7.42 Jiangsu300339266352211.33 Zhejiang25009721362846.24 Anhui227797201518113.13 Fujian11567845375.80 Jiangxi343256260841717.37 Shandong330293106592.09 Henan4648435235945.31 Hubei2786024003616.15 Hunan21382112763-61.02 Guangdong25519319000916.78 Guangxi289926049-83.04 Chongqin2556120604879.21 Sichuan1031210836325.25 Guizhou--- Yunnan19281142980-5.89 Shaanxi42483228317.28 Gansu8195461123513.80 Qinghai--- Ningxia881744-79.08 Xinjiang73304012439.41 Total output China17561061429716819.25
Unit: metric ton
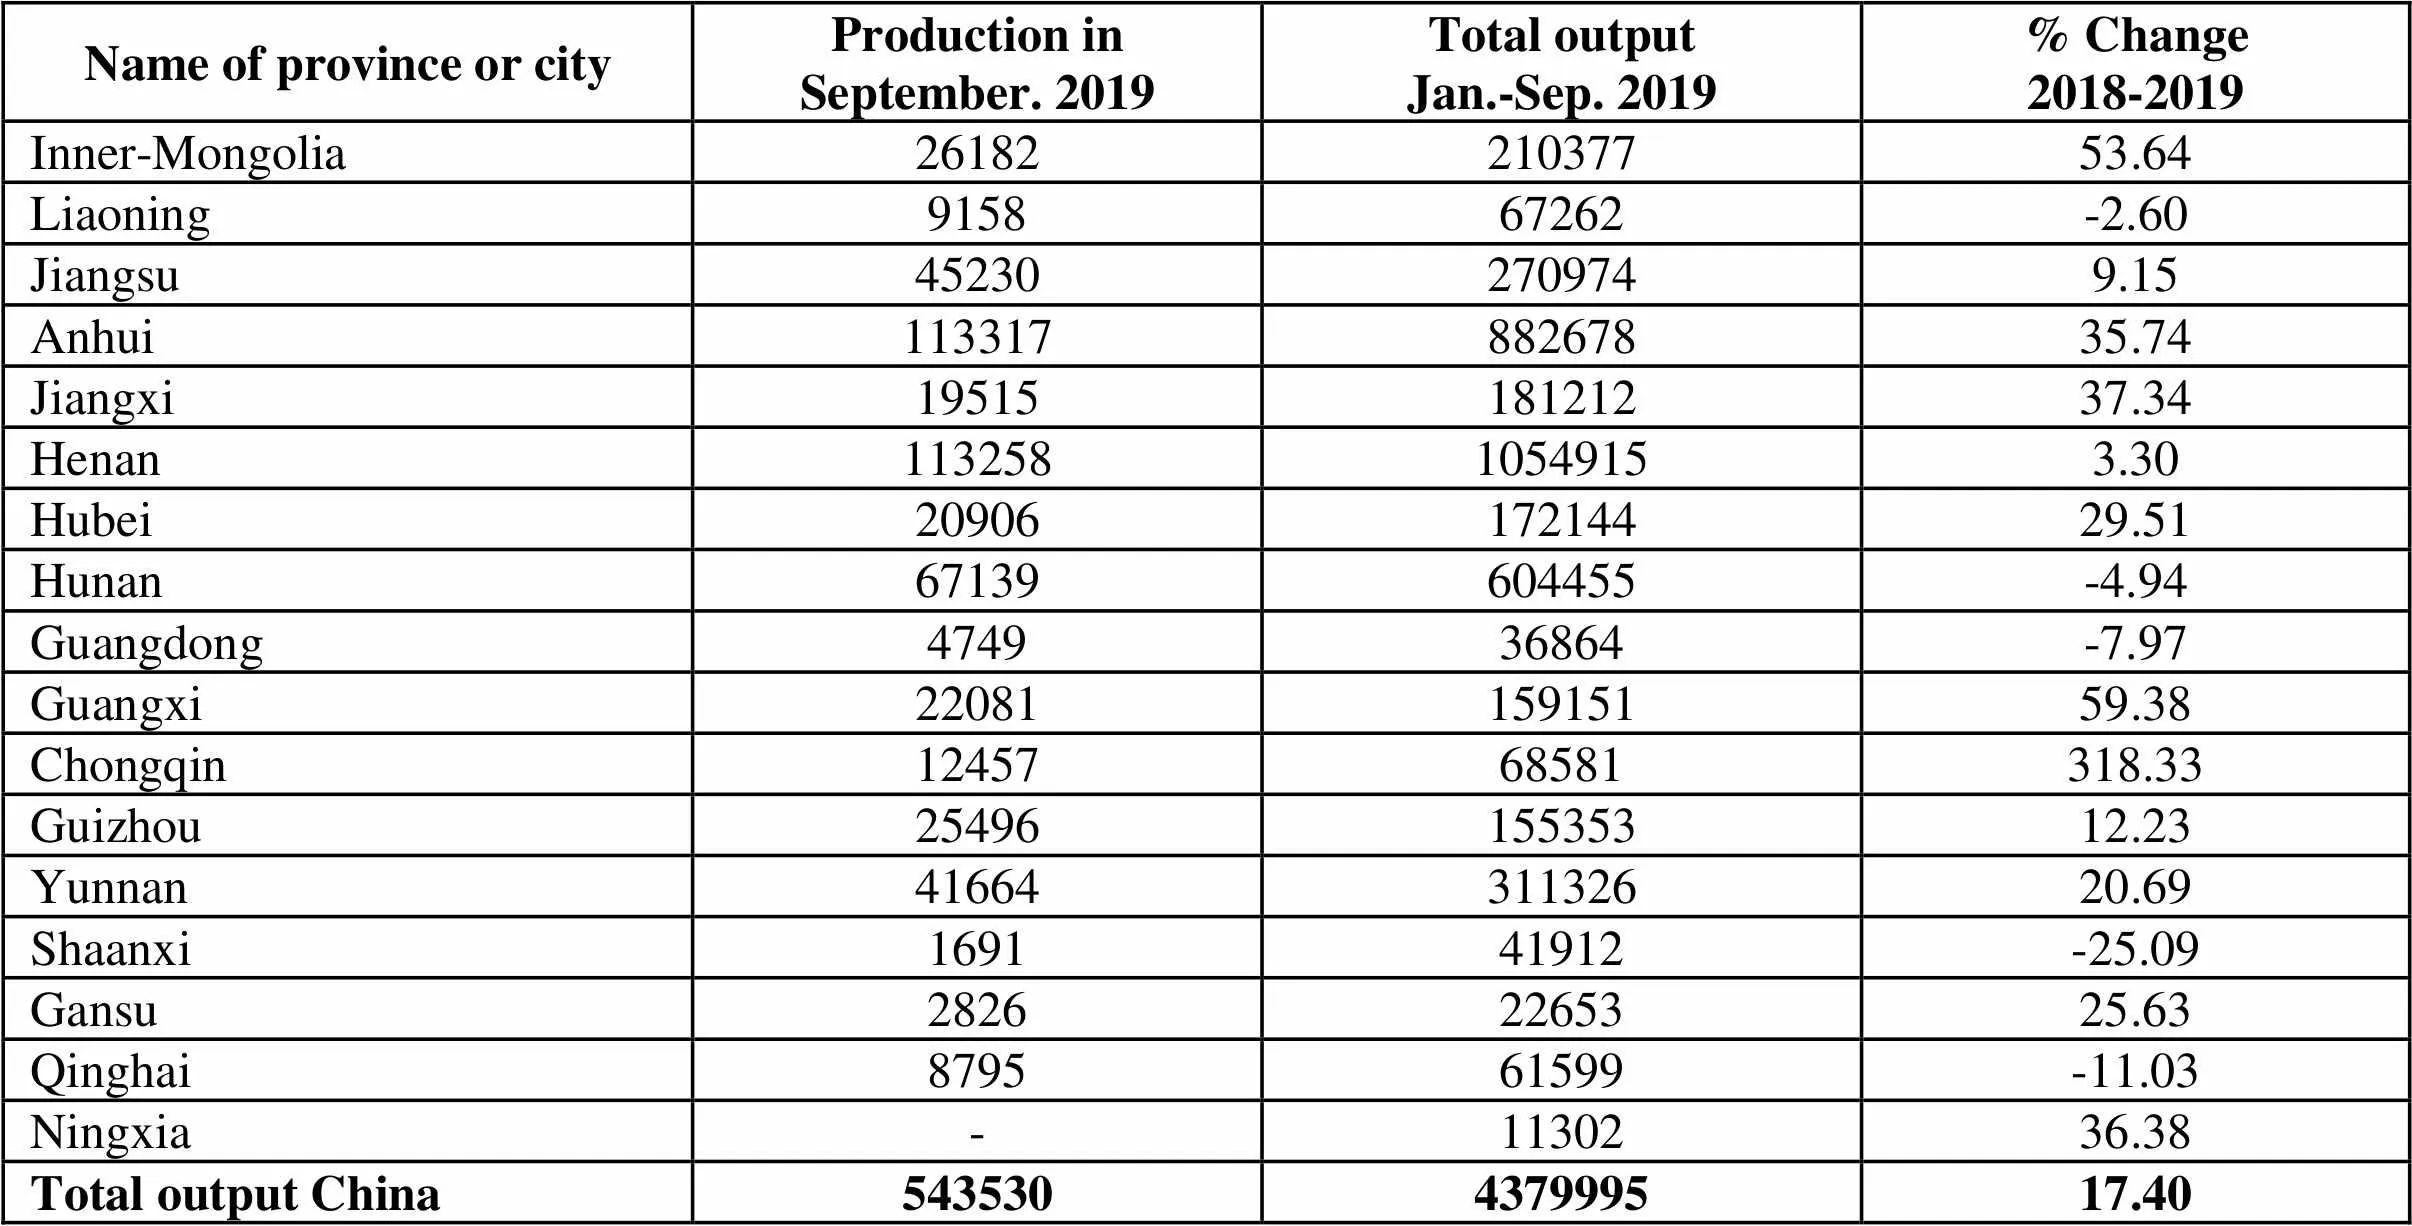
Name of province or cityProduction inSeptember. 2019Total outputJan.-Sep. 2019% Change2018-2019 Inner-Mongolia 2618221037753.64 Liaoning915867262-2.60 Jiangsu452302709749.15 Anhui11331788267835.74 Jiangxi1951518121237.34 Henan11325810549153.30 Hubei2090617214429.51 Hunan67139604455-4.94 Guangdong474936864-7.97 Guangxi2208115915159.38 Chongqin1245768581318.33 Guizhou2549615535312.23 Yunnan4166431132620.69 Shaanxi169141912-25.09 Gansu28262265325.63 Qinghai879561599-11.03 Ningxia-1130236.38 Total output China543530437999517.40
Unit: metric ton(metal content)
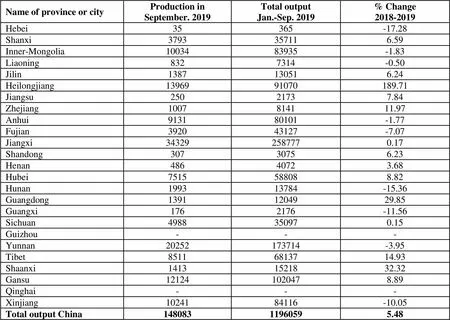
Name of province or cityProduction inSeptember. 2019Total outputJan.-Sep. 2019% Change2018-2019 Hebei35365-17.28 Shanxi3793357116.59 Inner-Mongolia1003483935-1.83 Liaoning8327314-0.50 Jilin1387130516.24 Heilongjiang1396991070189.71 Jiangsu25021737.84 Zhejiang1007814111.97 Anhui913180101-1.77 Fujian392043127-7.07 Jiangxi343292587770.17 Shandong30730756.23 Henan48640723.68 Hubei7515588088.82 Hunan199313784-15.36 Guangdong13911204929.85 Guangxi1762176-11.56 Sichuan4988350970.15 Guizhou--- Yunnan20252173714-3.95 Tibet85116813714.93 Shaanxi14131521832.32 Gansu121241020478.89 Qinghai--- Xinjiang1024184116-10.05 Total output China14808311960595.48
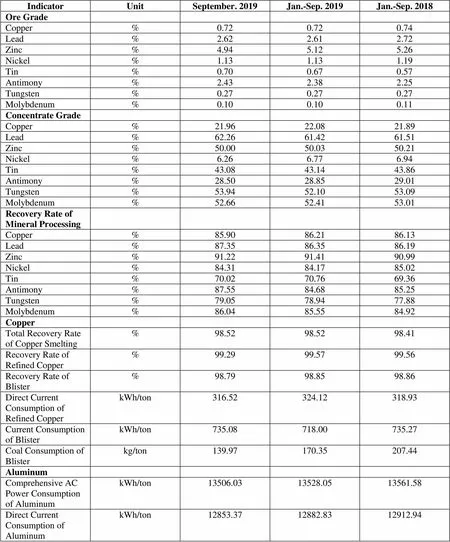
IndicatorUnitSeptember. 2019Jan.-Sep. 2019Jan.-Sep. 2018 Ore Grade Copper%0.720.720.74 Lead%2.622.612.72 Zinc%4.945.125.26 Nickel%1.131.131.19 Tin%0.700.670.57 Antimony%2.432.382.25 Tungsten%0.270.270.27 Molybdenum%0.100.100.11 Concentrate Grade Copper%21.9622.0821.89 Lead%62.2661.4261.51 Zinc%50.0050.0350.21 Nickel%6.266.776.94 Tin%43.0843.1443.86 Antimony%28.5028.8529.01 Tungsten%53.9452.1053.09 Molybdenum%52.6652.4153.01 Recovery Rate of Mineral Processing Copper%85.9086.2186.13 Lead%87.3586.3586.19 Zinc%91.2291.4190.99 Nickel%84.3184.1785.02 Tin%70.0270.7669.36 Antimony%87.5584.6885.25 Tungsten%79.0578.9477.88 Molybdenum%86.0485.5584.92 Copper Total Recovery Rate of Copper Smelting%98.5298.5298.41 Recovery Rate of Refined Copper%99.2999.5799.56 Recovery Rate of Blister%98.7998.8598.86 Direct Current Consumption of Refined CopperkWh/ton316.52324.12318.93 Current Consumption of BlisterkWh/ton735.08718.00735.27 Coal Consumption of Blisterkg/ton139.97170.35207.44 Aluminum Comprehensive AC Power Consumption of AluminumkWh/ton13506.0313528.0513561.58 Direct Current Consumption of AluminumkWh/ton12853.3712882.8312912.94
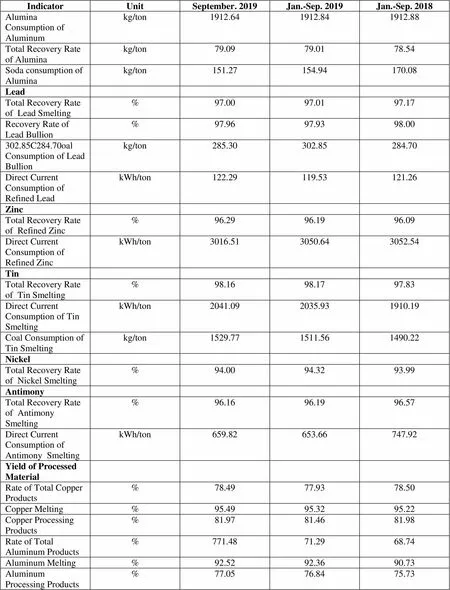
IndicatorUnitSeptember. 2019Jan.-Sep. 2019Jan.-Sep. 2018 Alumina Consumption of Aluminumkg/ton1912.641912.841912.88 Total Recovery Rate of Aluminakg/ton79.0979.0178.54 Soda consumption of Aluminakg/ton151.27154.94170.08 Lead Total Recovery Rate of Lead Smelting%97.0097.0197.17 Recovery Rate of Lead Bullion%97.9697.9398.00 302.85C284.70oal Consumption of Lead Bullionkg/ton285.30302.85284.70 Direct Current Consumption of Refined LeadkWh/ton122.29119.53121.26 Zinc Total Recovery Rate of Refined Zinc%96.2996.1996.09 Direct Current Consumption of Refined ZinckWh/ton3016.513050.643052.54 Tin Total Recovery Rate of Tin Smelting%98.1698.1797.83 Direct Current Consumption of Tin SmeltingkWh/ton2041.092035.931910.19 Coal Consumption of Tin Smeltingkg/ton1529.771511.561490.22 Nickel Total Recovery Rate of Nickel Smelting%94.0094.3293.99 Antimony Total Recovery Rate of Antimony Smelting%96.1696.1996.57 Direct Current Consumption of Antimony SmeltingkWh/ton659.82653.66747.92 Yield of Processed Material Rate of Total Copper Products%78.4977.9378.50 Copper Melting %95.4995.3295.22 Copper Processing Products%81.9781.4681.98 Rate of Total Aluminum Products%771.4871.2968.74 Aluminum Melting%92.5292.3690.73 Aluminum Processing Products%77.0576.8475.73
Unit: metric ton
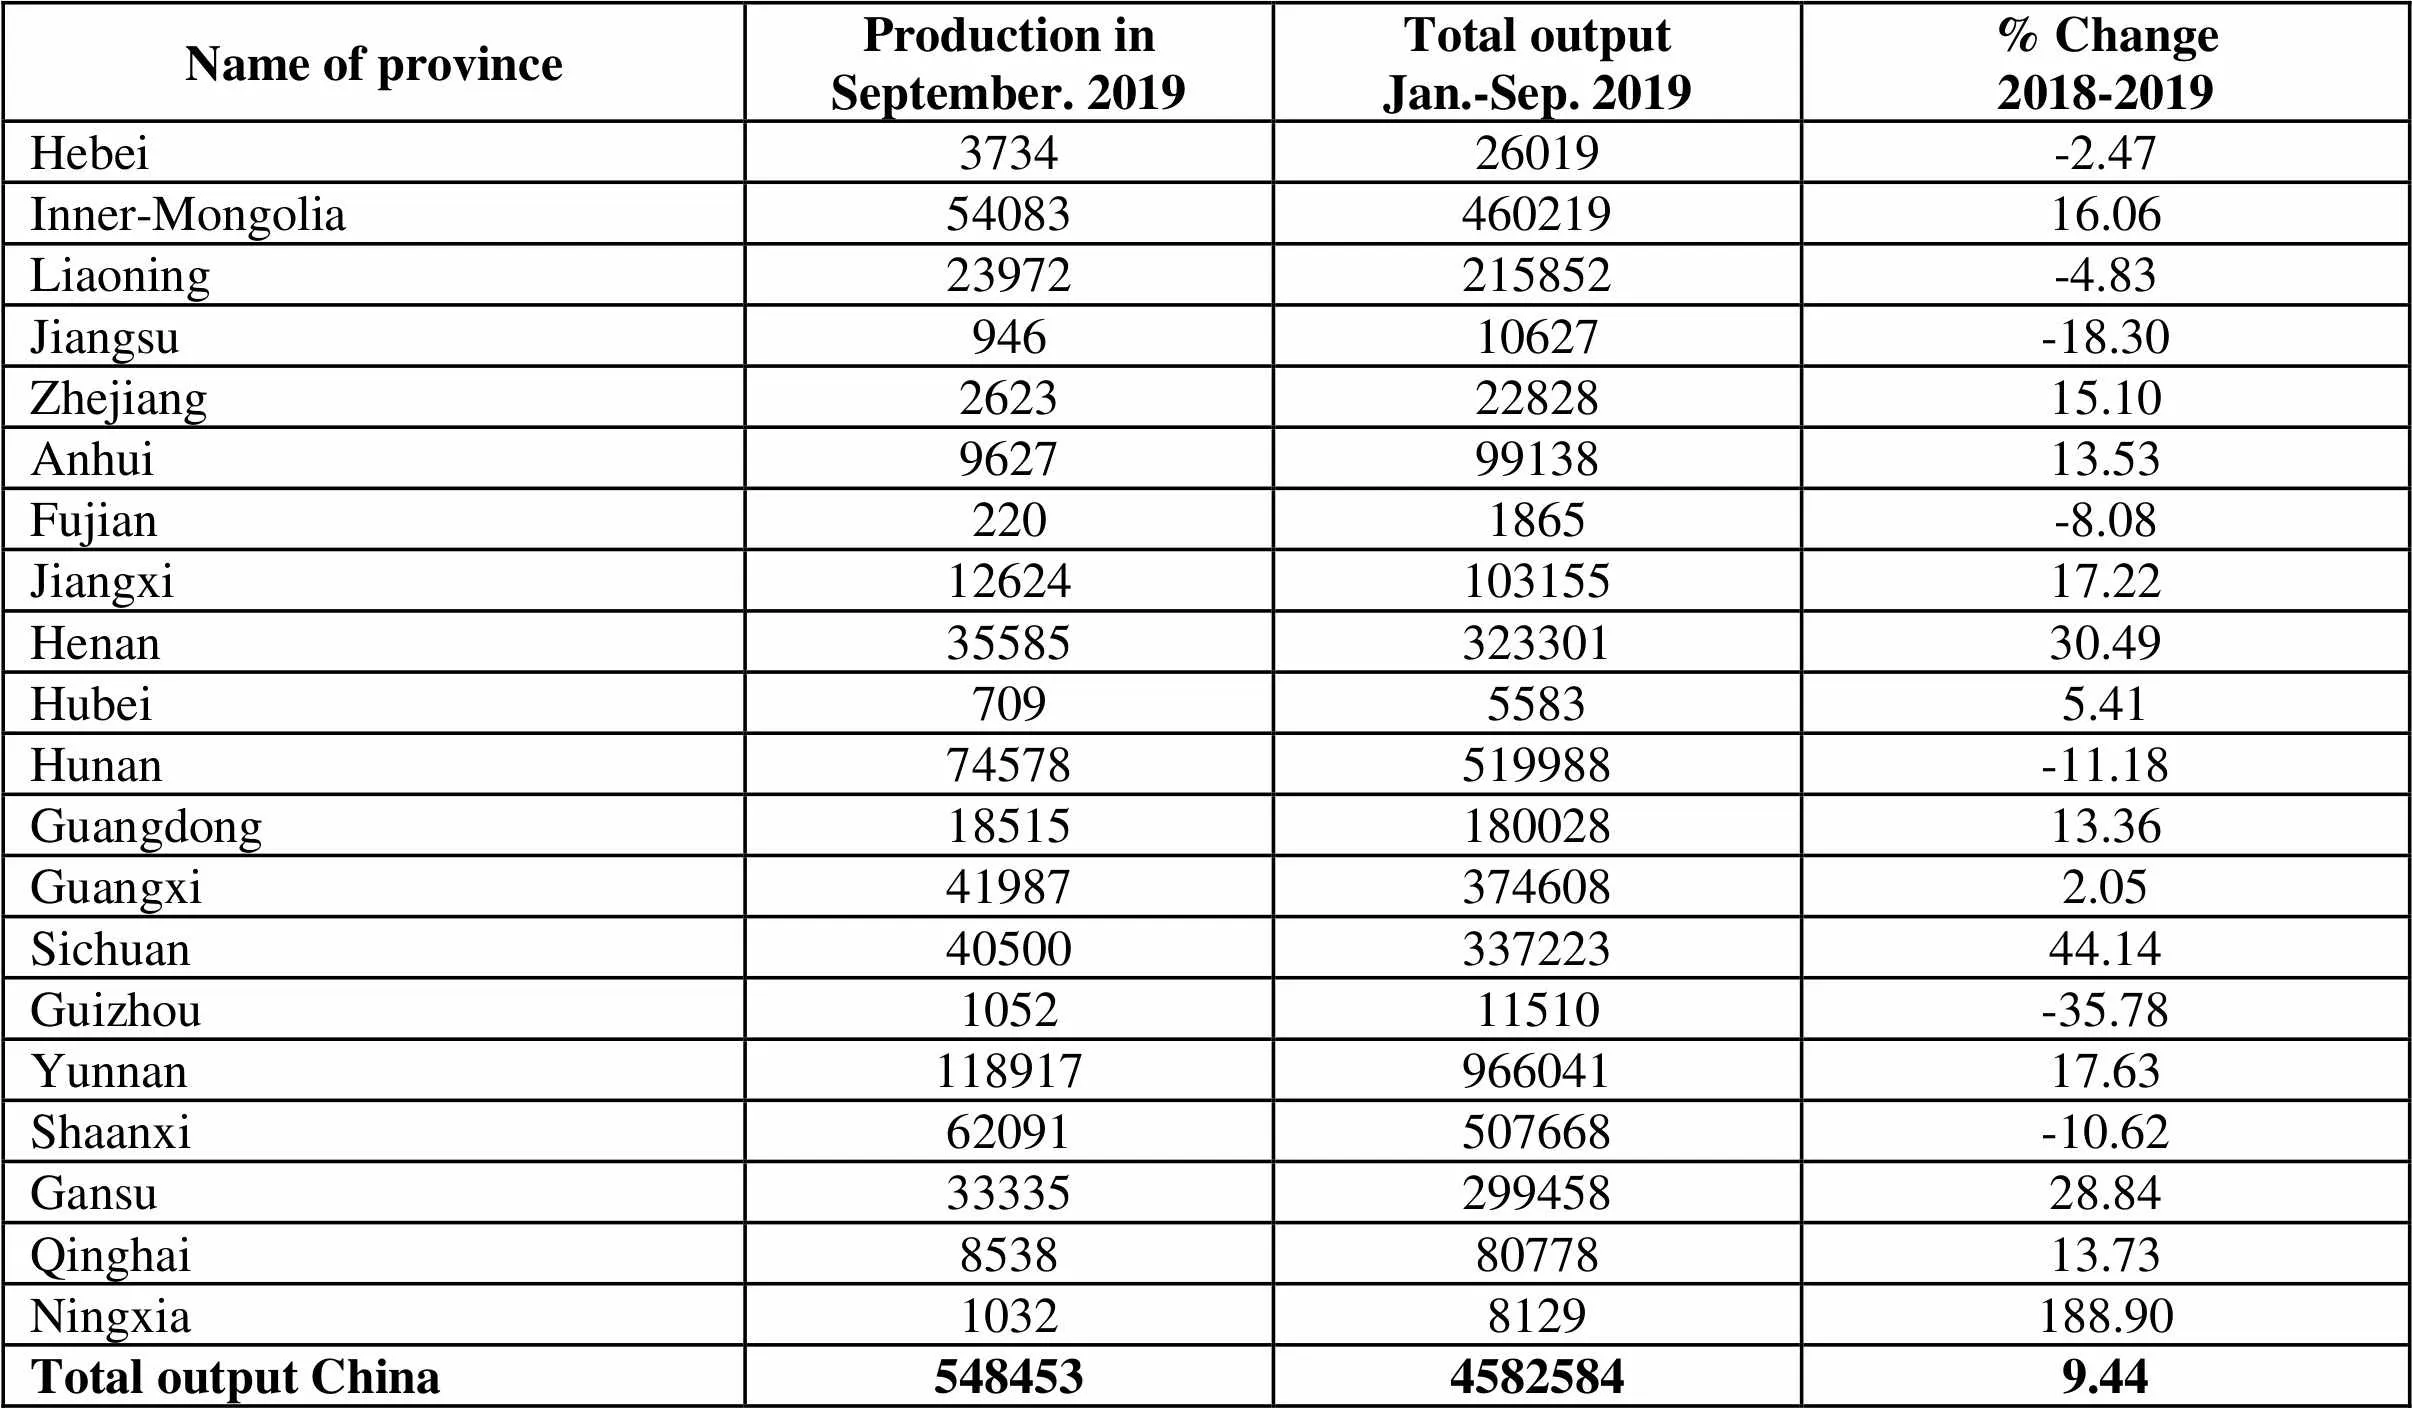
Name of provinceProduction inSeptember. 2019Total outputJan.-Sep. 2019% Change2018-2019 Hebei373426019-2.47 Inner-Mongolia5408346021916.06 Liaoning23972215852-4.83 Jiangsu94610627-18.30 Zhejiang26232282815.10 Anhui96279913813.53 Fujian2201865-8.08 Jiangxi1262410315517.22 Henan3558532330130.49 Hubei70955835.41 Hunan74578519988-11.18 Guangdong1851518002813.36 Guangxi419873746082.05 Sichuan4050033722344.14 Guizhou105211510-35.78 Yunnan11891796604117.63 Shaanxi62091507668-10.62 Gansu3333529945828.84 Qinghai85388077813.73 Ningxia10328129188.90 Total output China54845345825849.44
 China Nonferrous Metals Monthly2019年12期
- China Nonferrous Metals Monthly的其它文章
- The Chinese Lead And Zinc Industry Under High-quality Development