Hailiang Group Signs A Strategic Partnership Agreement With DAIKIN China
Hailiang Group Signs A Strategic Partnership Agreement With DAIKIN China
On May 14, 2019, Hailiang Group held the signing ceremony of a Strategic Partnership Agreement 2019 with DAIKIN China in its headquarters. Deng Guoyong, Vice-director of Technical Guidance Division of DAIKIN China, You Qihua, GM Assistant of Hailiang and GM of Marketing Management Center, Zhang Xiaogang, Deputy GM of Copper Pipeline Division of Hailiang and Director of Channel Marketing Department, and Wang Weifang, Deputy Director of Channel Marketing Department of Hailiang, etc. attended the ceremony.
At the ceremony, Mr. Deng highly recognized the comprehensive strength of Hailiang, and he said that DAIKIN wished to have a deep understanding of Hailiang, planned to fully support the marketing campaigns and looked forward to better cooperation with Hailiang in the future. Mr. You expressed his sincere thanks for the consistent guidance and attention of DAIKIN, and said that Hailiang will take full advantage of the strategic partnership to further improve product quality, delivery capacity and service and strengthen the brand competitiveness. Both sides said that they will give full play to their respective resources advantages in terms of personnel, technology and market for long-term strategic cooperation. The strategic partnership between Hailiang and DAIKIN, one of the global leaders in air conditioners, demonstrated that Hailiang nonferrous material manufacturing industry is starting a journey of becoming more high-end and intelligent, more technical, stronger in brand and competitiveness worldwide. The partnership laid a solid foundation for Hailiang to seek for strategic presence and sustainable, sound and rapid development nationwide.
As an influential global leader in air conditioner market, DAIKIN has been adhering to high standards and strict requirements for selection of strategic partners. Hailiang has been a strategic partner of DAIKIN for consecutive three years, which demonstrated not only the hard power of Hailiang’s channel marketing but also its firm commitment and ambition to become a global major player in the nonferrous material intelligent manufacturing field.
Hailiang has been dedicated to the R&D, production, distribution and service of high-end copper products, conductive profiles and aluminium profiles. With 15 production bases in Zhejiang, Shanghai, Anhui, Taishan Guangdong, Zhongshan Guangdong, Vietnam, Thailand, Chongqing, Chengdu, the US, Berlin German, Menden German, France, Italy and Spain, Hailiang has accumulated a large high-quality customer base at home and abroad, established long-term business cooperation relationship with over 1,000 customers in 117 countries or regions, and become strategic partners of multiple industry brands.
In the future, Hailiang will continuously improve its product quality, vigorously exploit the market, and work closely with DAIKIN to establish a long-term stable partnership. Guided by the objective of realizing leapfrog development in nonferrous material intelligent manufacturing, Hailiang will strive to achieve the transformation from traditional manufacturing to intelligent manufacturing across product and application groups, thus making greater contribution to social-economic development.
Unit: metric ton

Name of province or cityProduction inMay. 2019Total output Jan.-May. 2019% Change2018-2019 Zhejiang Jiangxi Hunan Guangxi Yunnan Total output China
Unit: metric ton

Name of provinceProduction inMay. 2019Total output Jan.-May. 2019% Change2018-2019 Shanxi Henan Shaanxi Ningxia Xingjiang Total output China
Unit: metric ton
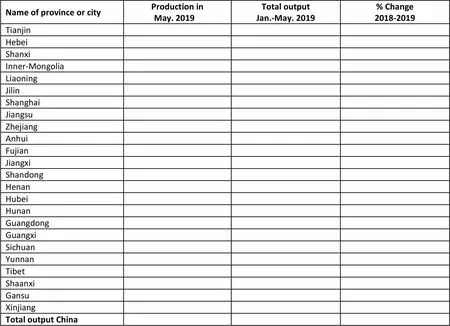
Name of province or cityProduction in May. 2019Total output Jan.-May. 2019% Change2018-2019 Tianjin Hebei Shanxi Inner-Mongolia Liaoning Jilin Shanghai Jiangsu Zhejiang Anhui Fujian Jiangxi Shandong Henan Hubei Hunan Guangdong Guangxi Sichuan Yunnan Tibet Shaanxi Gansu Xinjiang Total output China
Unit: metric ton
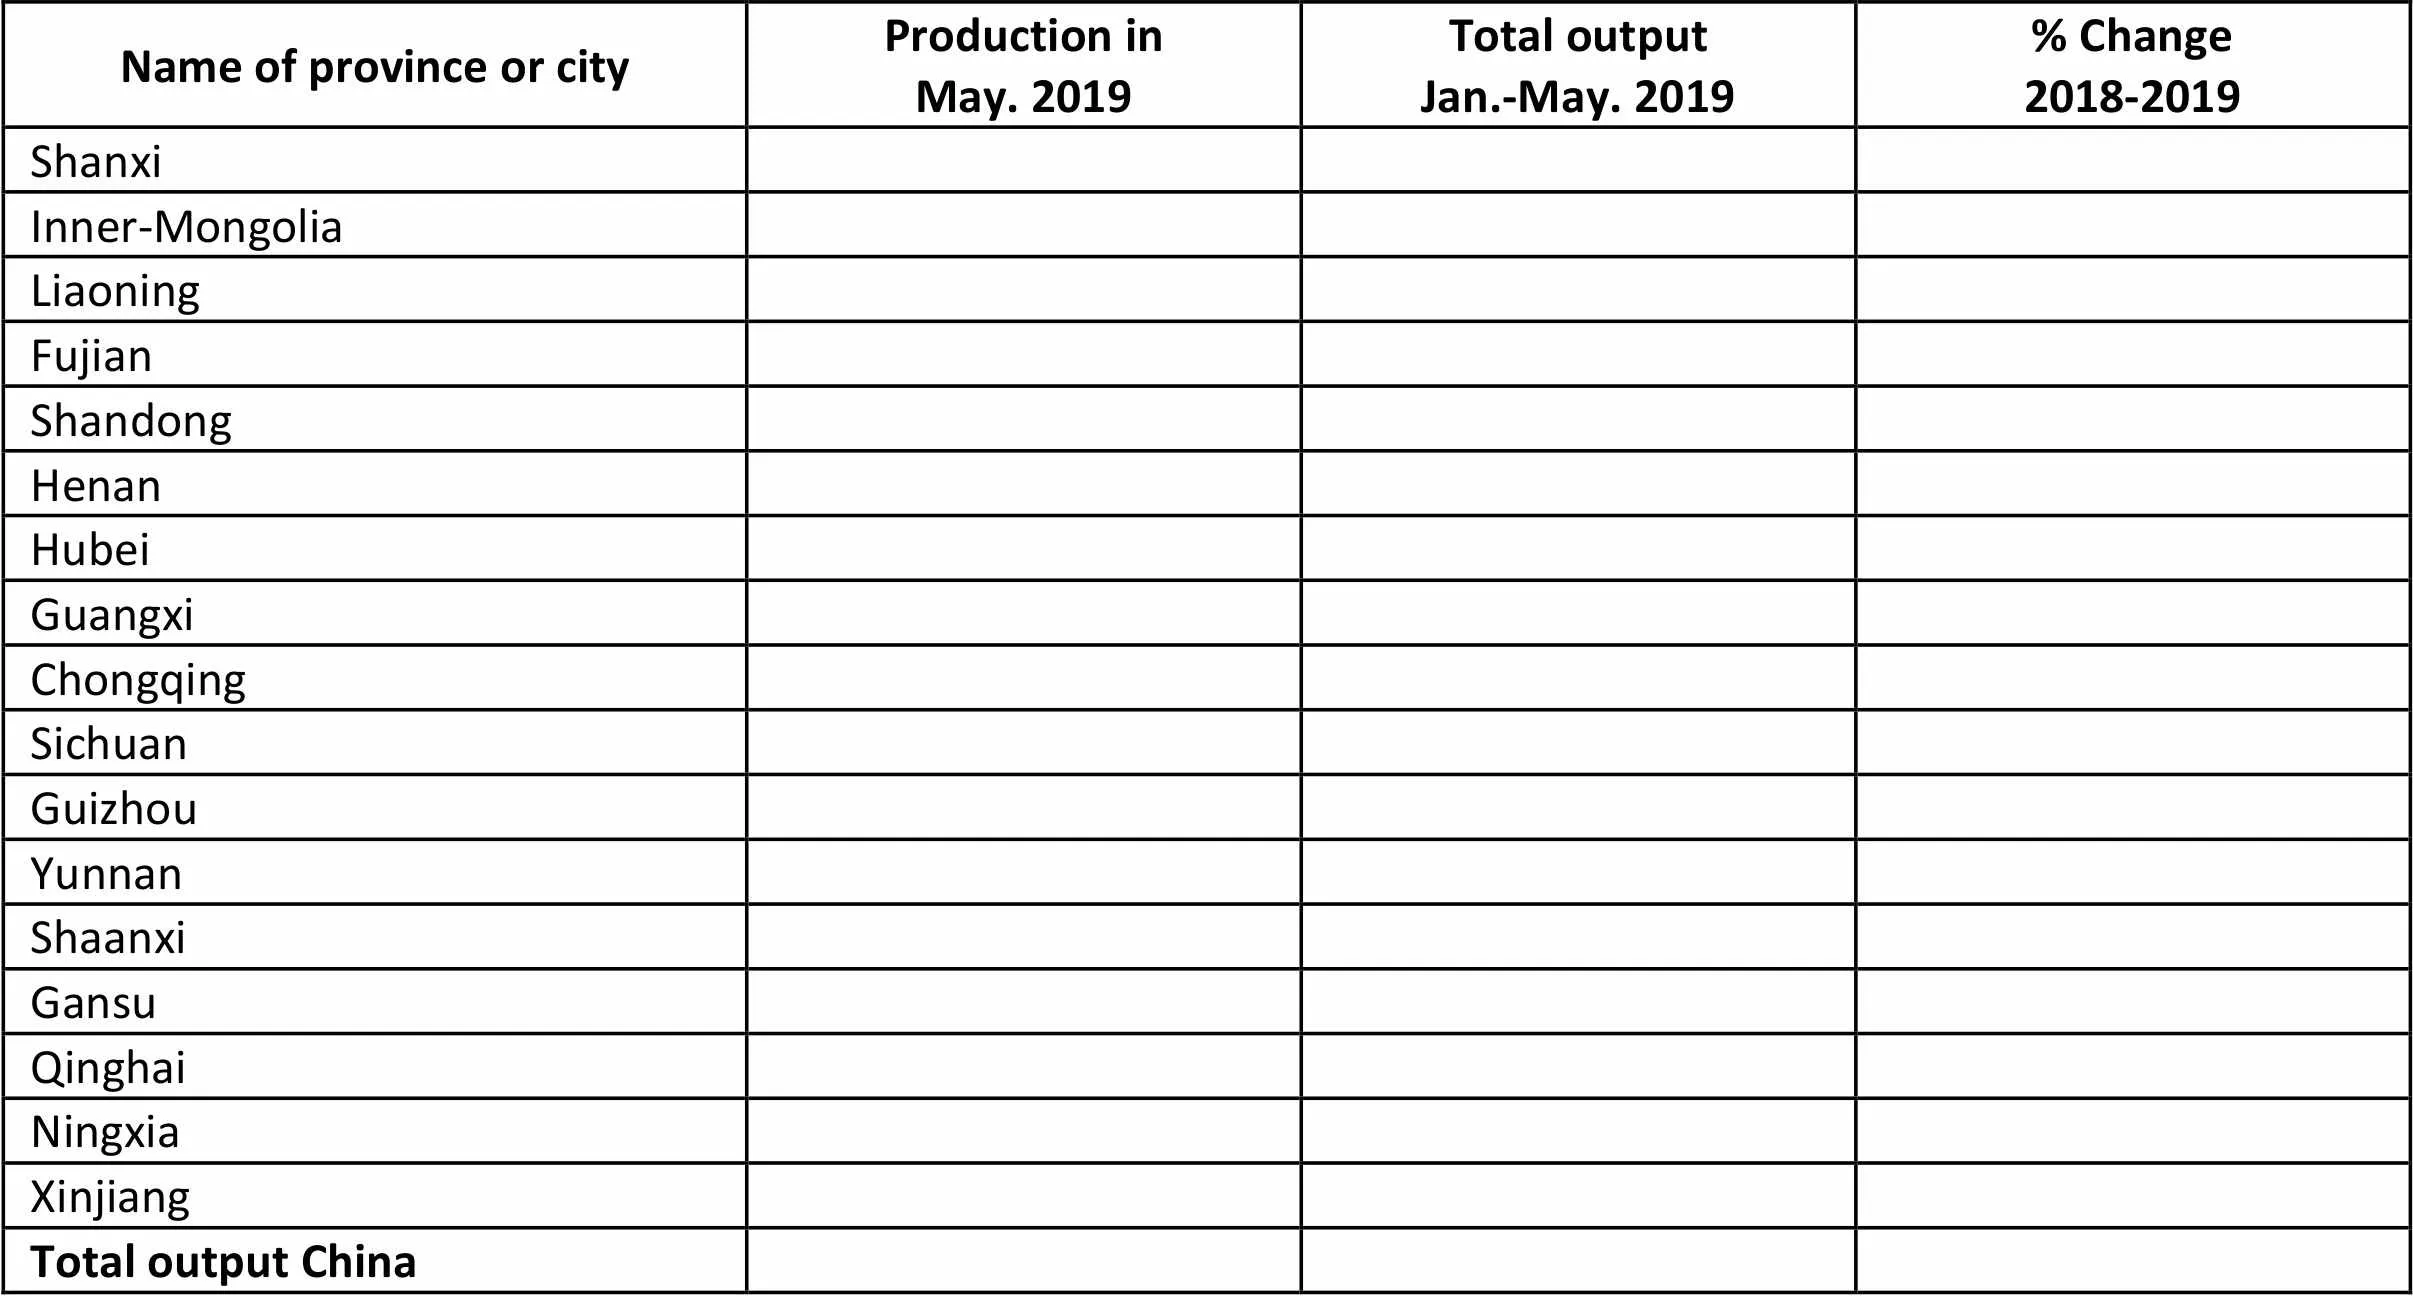
Name of province or cityProduction inMay. 2019Total output Jan.-May. 2019% Change2018-2019 Shanxi Inner-Mongolia Liaoning Fujian Shandong Henan Hubei Guangxi Chongqing Sichuan Guizhou Yunnan Shaanxi Gansu Qinghai Ningxia Xinjiang Total output China
Unit: metric ton

Name of province Production inMay. 2019Total output Jan.-May. 2019% Change2018-2019 Shanxi Inner-Mongolia Shandong Henan Guangxi Chongqing Sichuan Guizhou Yunnan Total output China
Unit: metric ton

Name of province or cityProduction inMay. 2019Total output Jan.-May. 2019% Change2018-2019 Liaoning Jiangxi Henan Hubei Guangdong Guangxi Shaanxi Gansu Xinjiang Total output China
Unit: metric ton
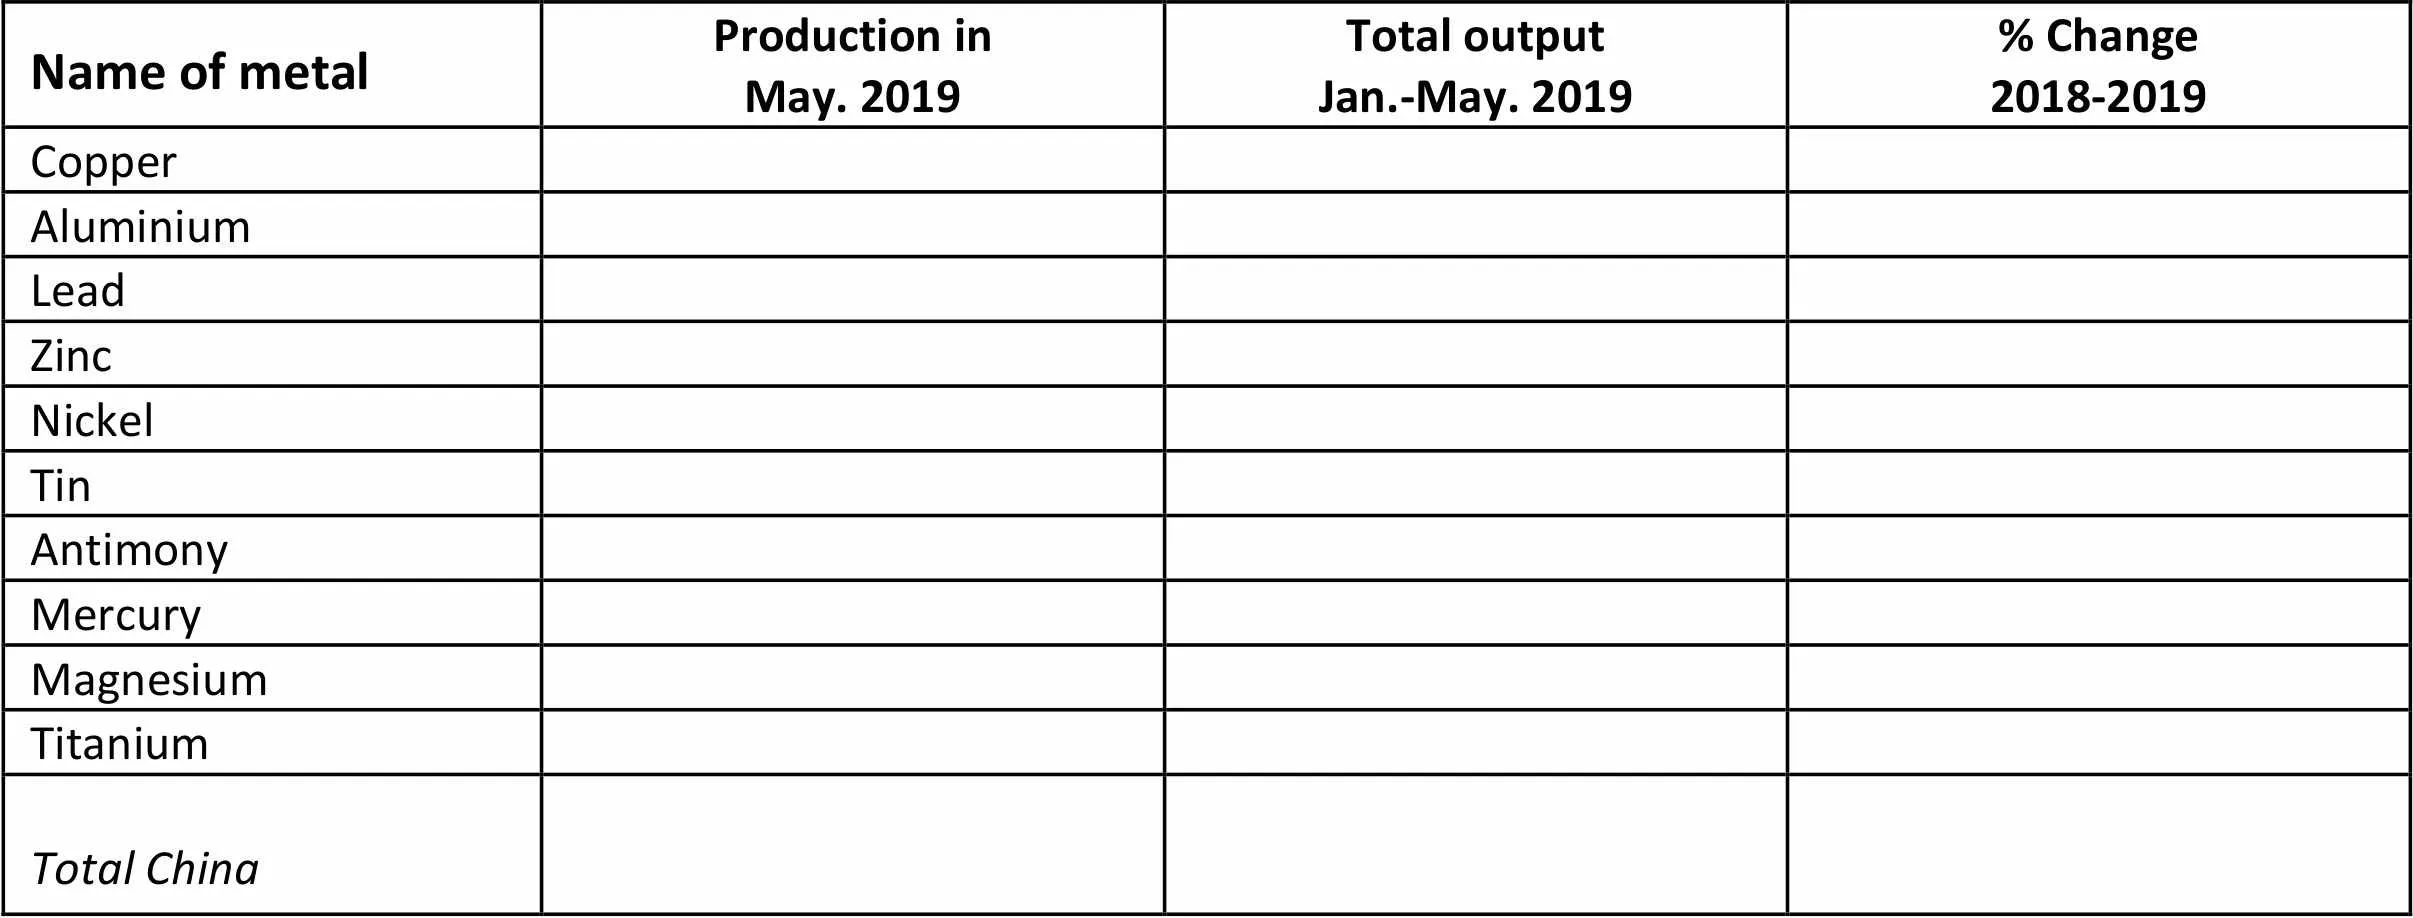
Name of metalProduction inMay. 2019Total output Jan.-May. 2019% Change2018-2019 Copper Aluminium Lead Zinc Nickel Tin Antimony Mercury Magnesium Titanium Total China
Unit: metric ton
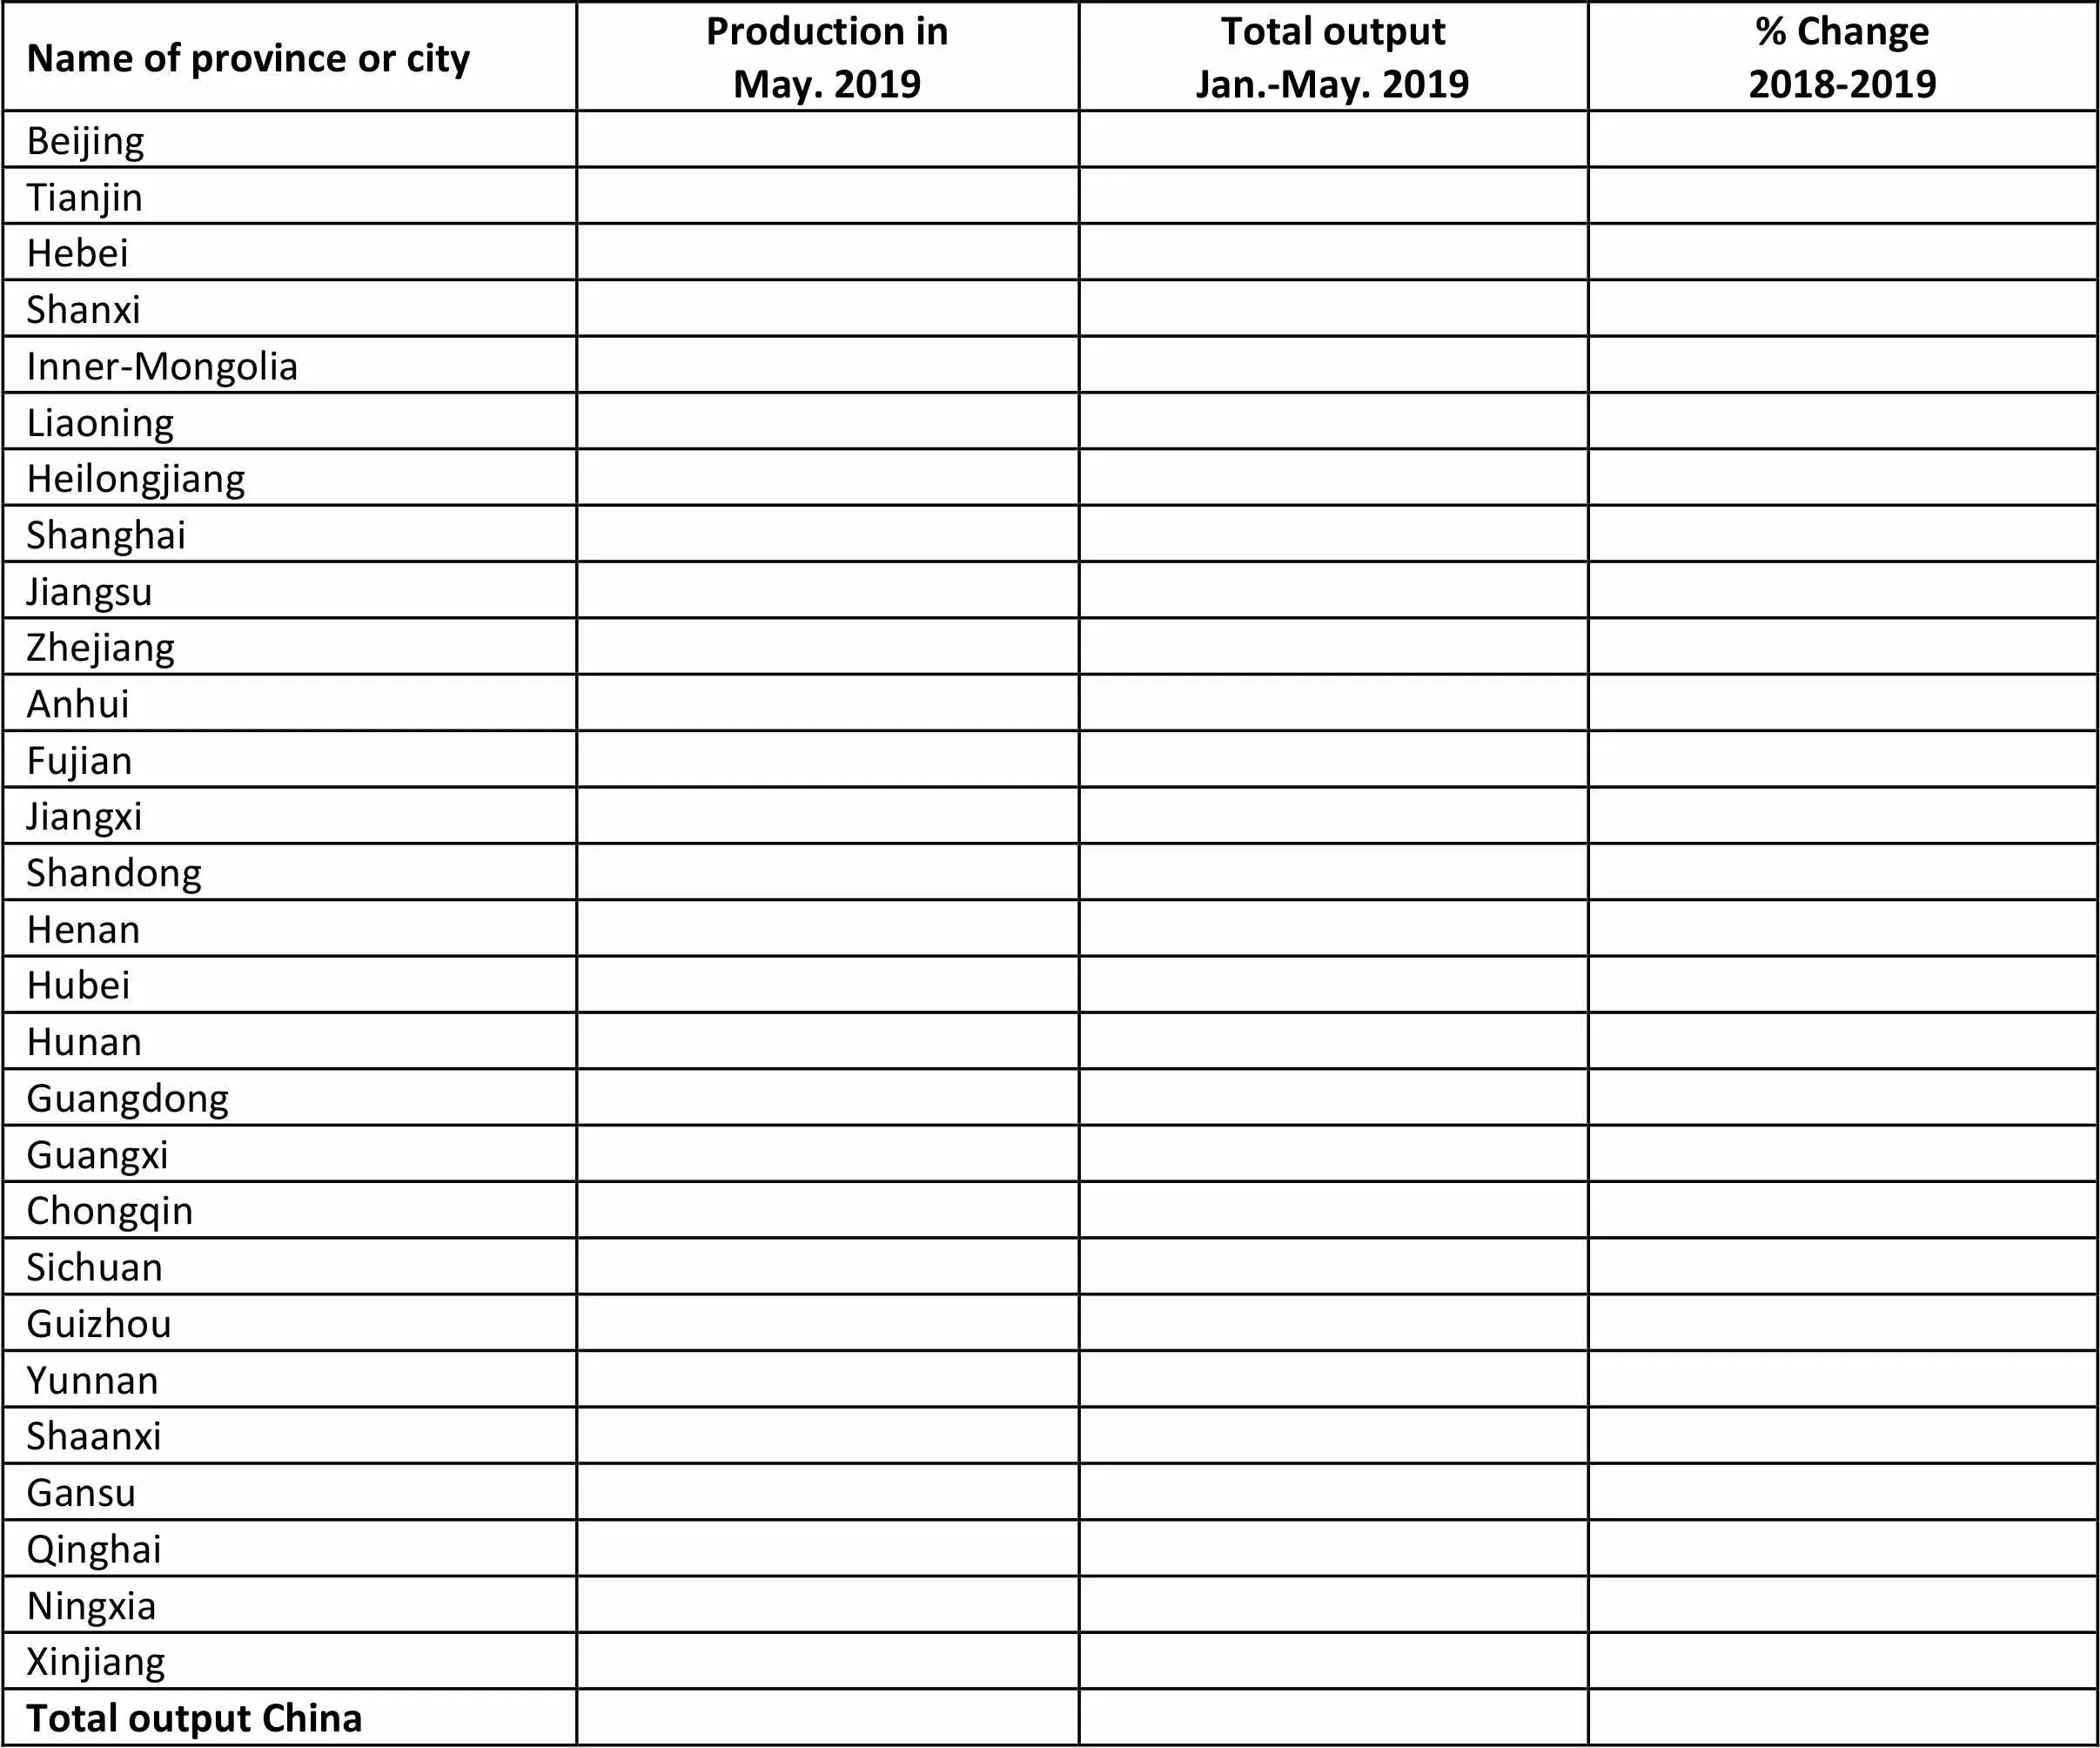
Name of province or cityProduction inMay. 2019Total output Jan.-May. 2019% Change2018-2019 Beijing Tianjin Hebei Shanxi Inner-Mongolia Liaoning Heilongjiang Shanghai Jiangsu Zhejiang Anhui Fujian Jiangxi Shandong Henan Hubei Hunan Guangdong Guangxi Chongqin Sichuan Guizhou Yunnan Shaanxi Gansu Qinghai Ningxia Xinjiang Total output China
Unit: metric ton

Name of province or cityProduction inMay. 2019Total output Jan.-May. 2019% Change2018-2019 Inner-Mongolia Liaoning Jiangsu Anhui Jiangxi Henan Hubei Hunan Guangdong Guangxi Chongqin Guizhou Yunnan Shaanxi Gansu Qinghai Ningxia Total output China
Unit: metric ton(metal content)
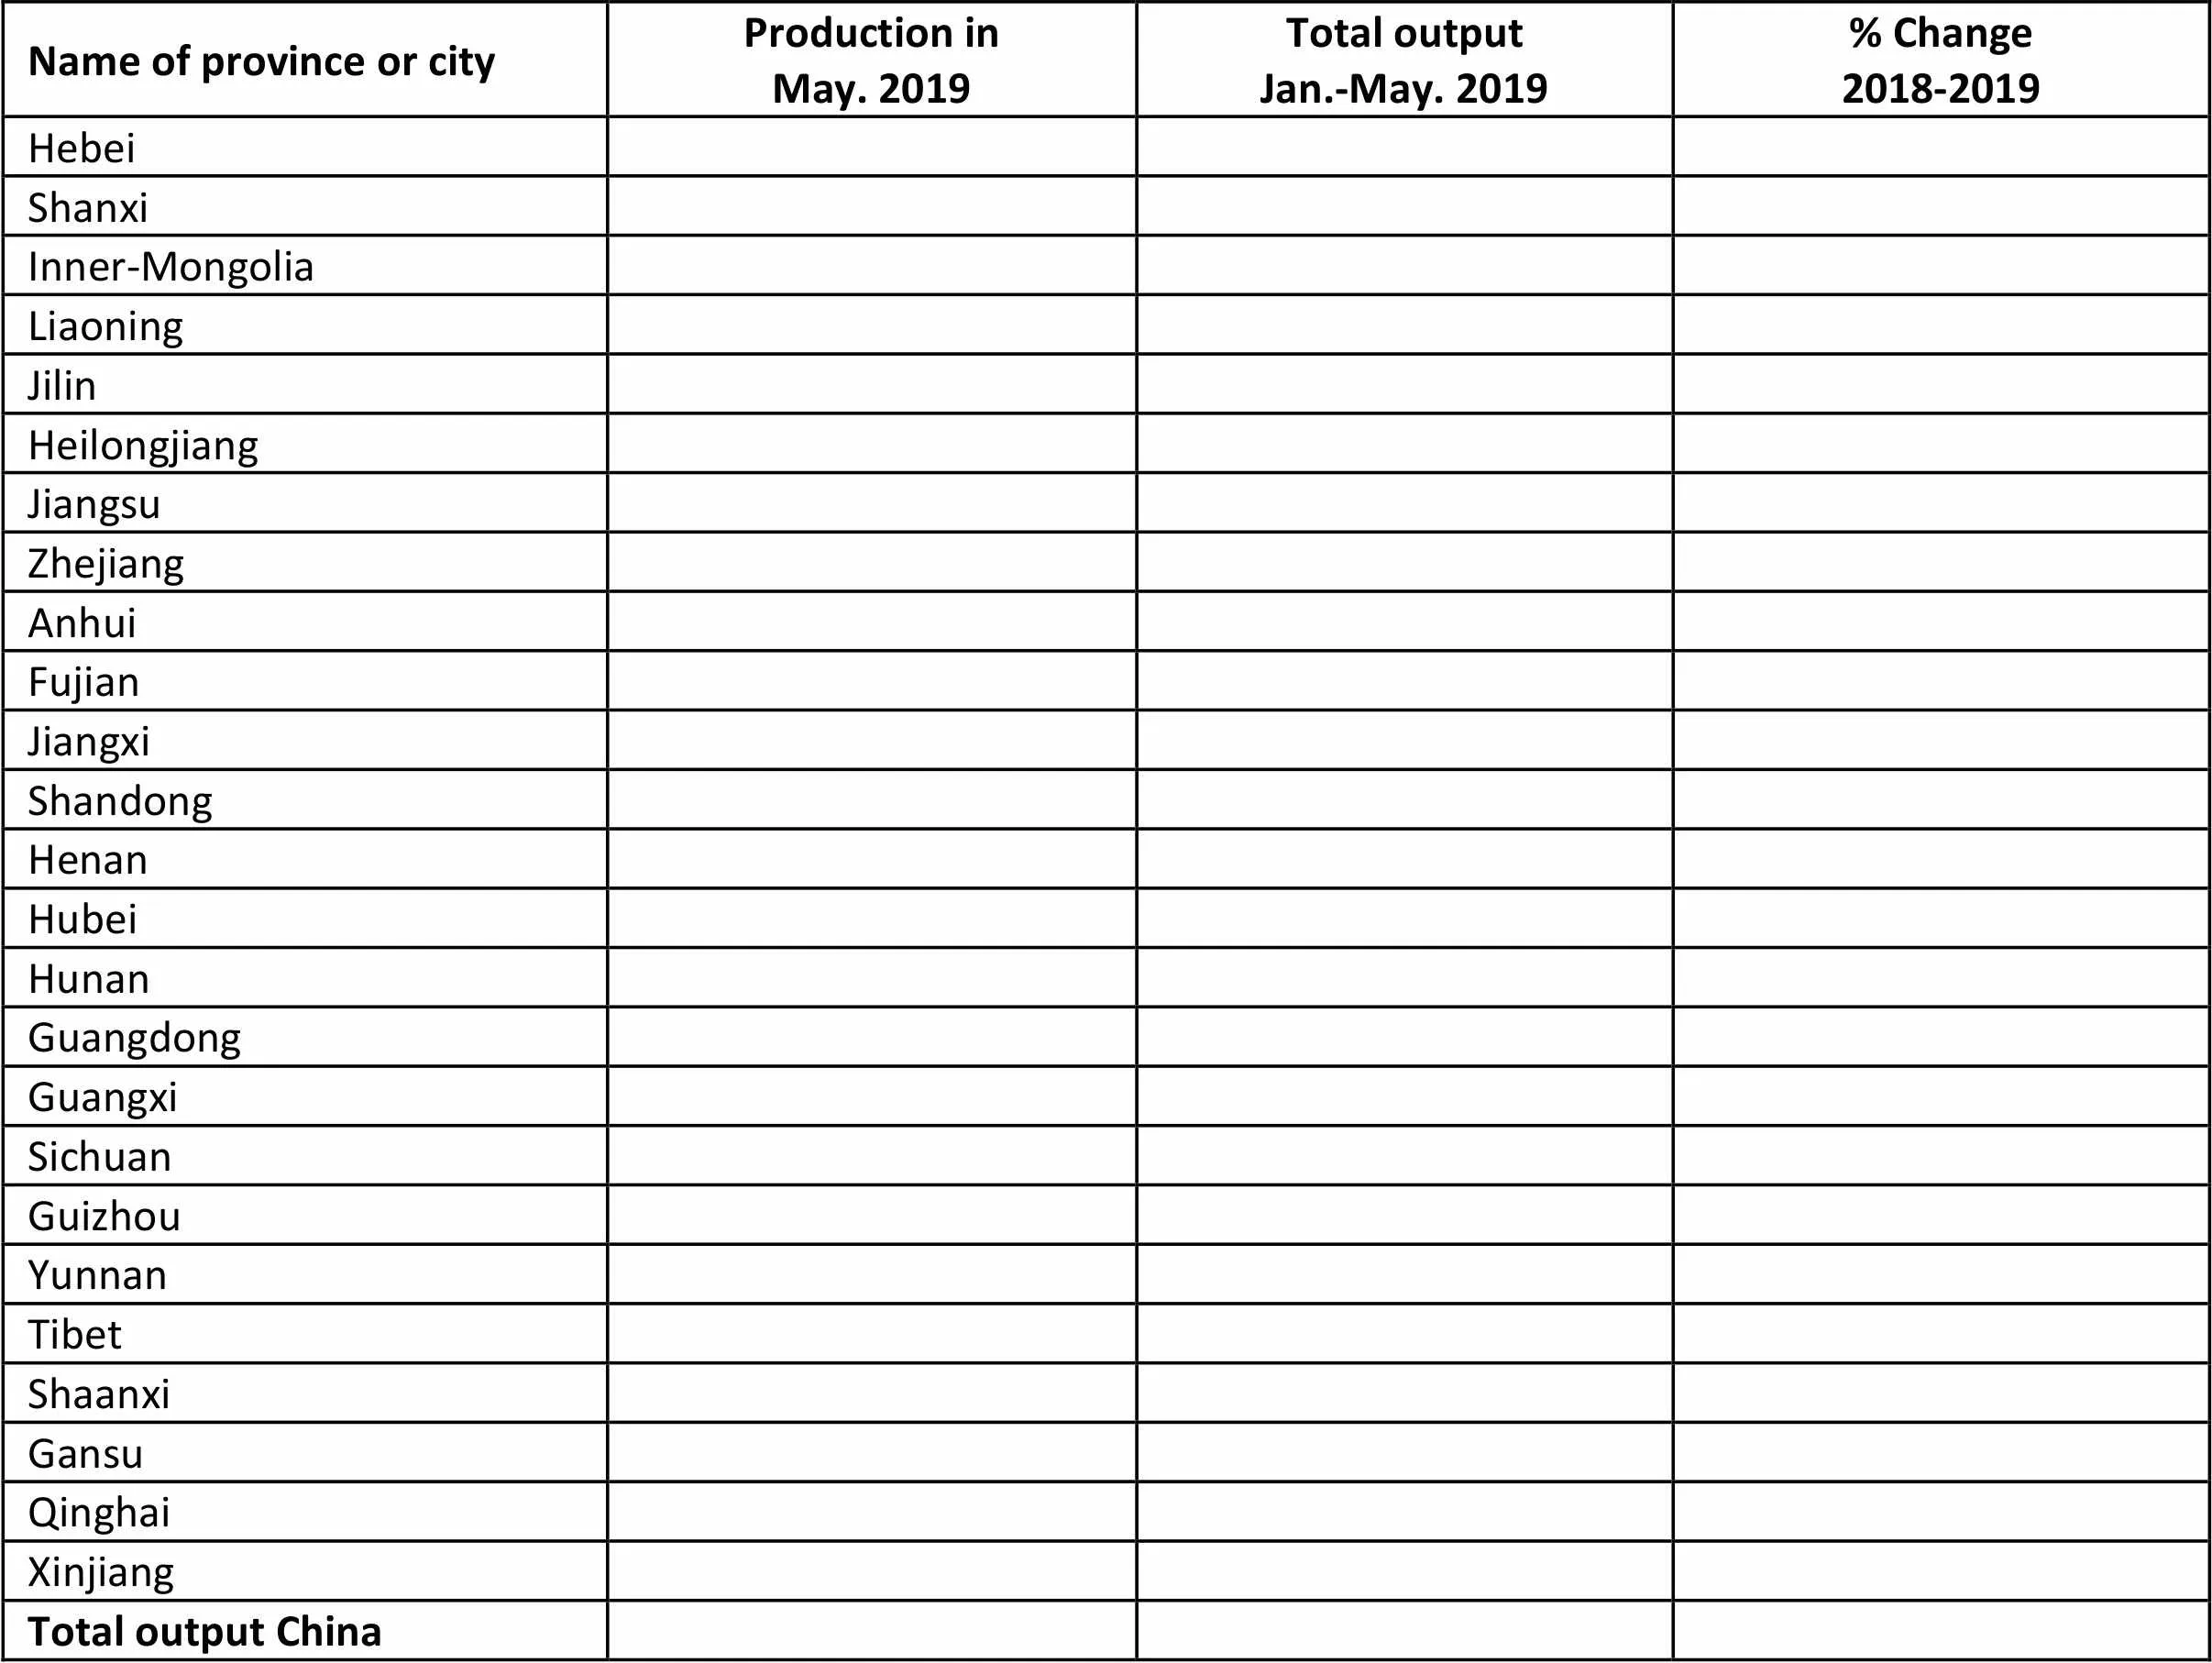
Name of province or cityProduction inMay. 2019Total output Jan.-May. 2019% Change2018-2019 Hebei Shanxi Inner-Mongolia Liaoning Jilin Heilongjiang Jiangsu Zhejiang Anhui Fujian Jiangxi Shandong Henan Hubei Hunan Guangdong Guangxi Sichuan Guizhou Yunnan Tibet Shaanxi Gansu Qinghai Xinjiang Total output China
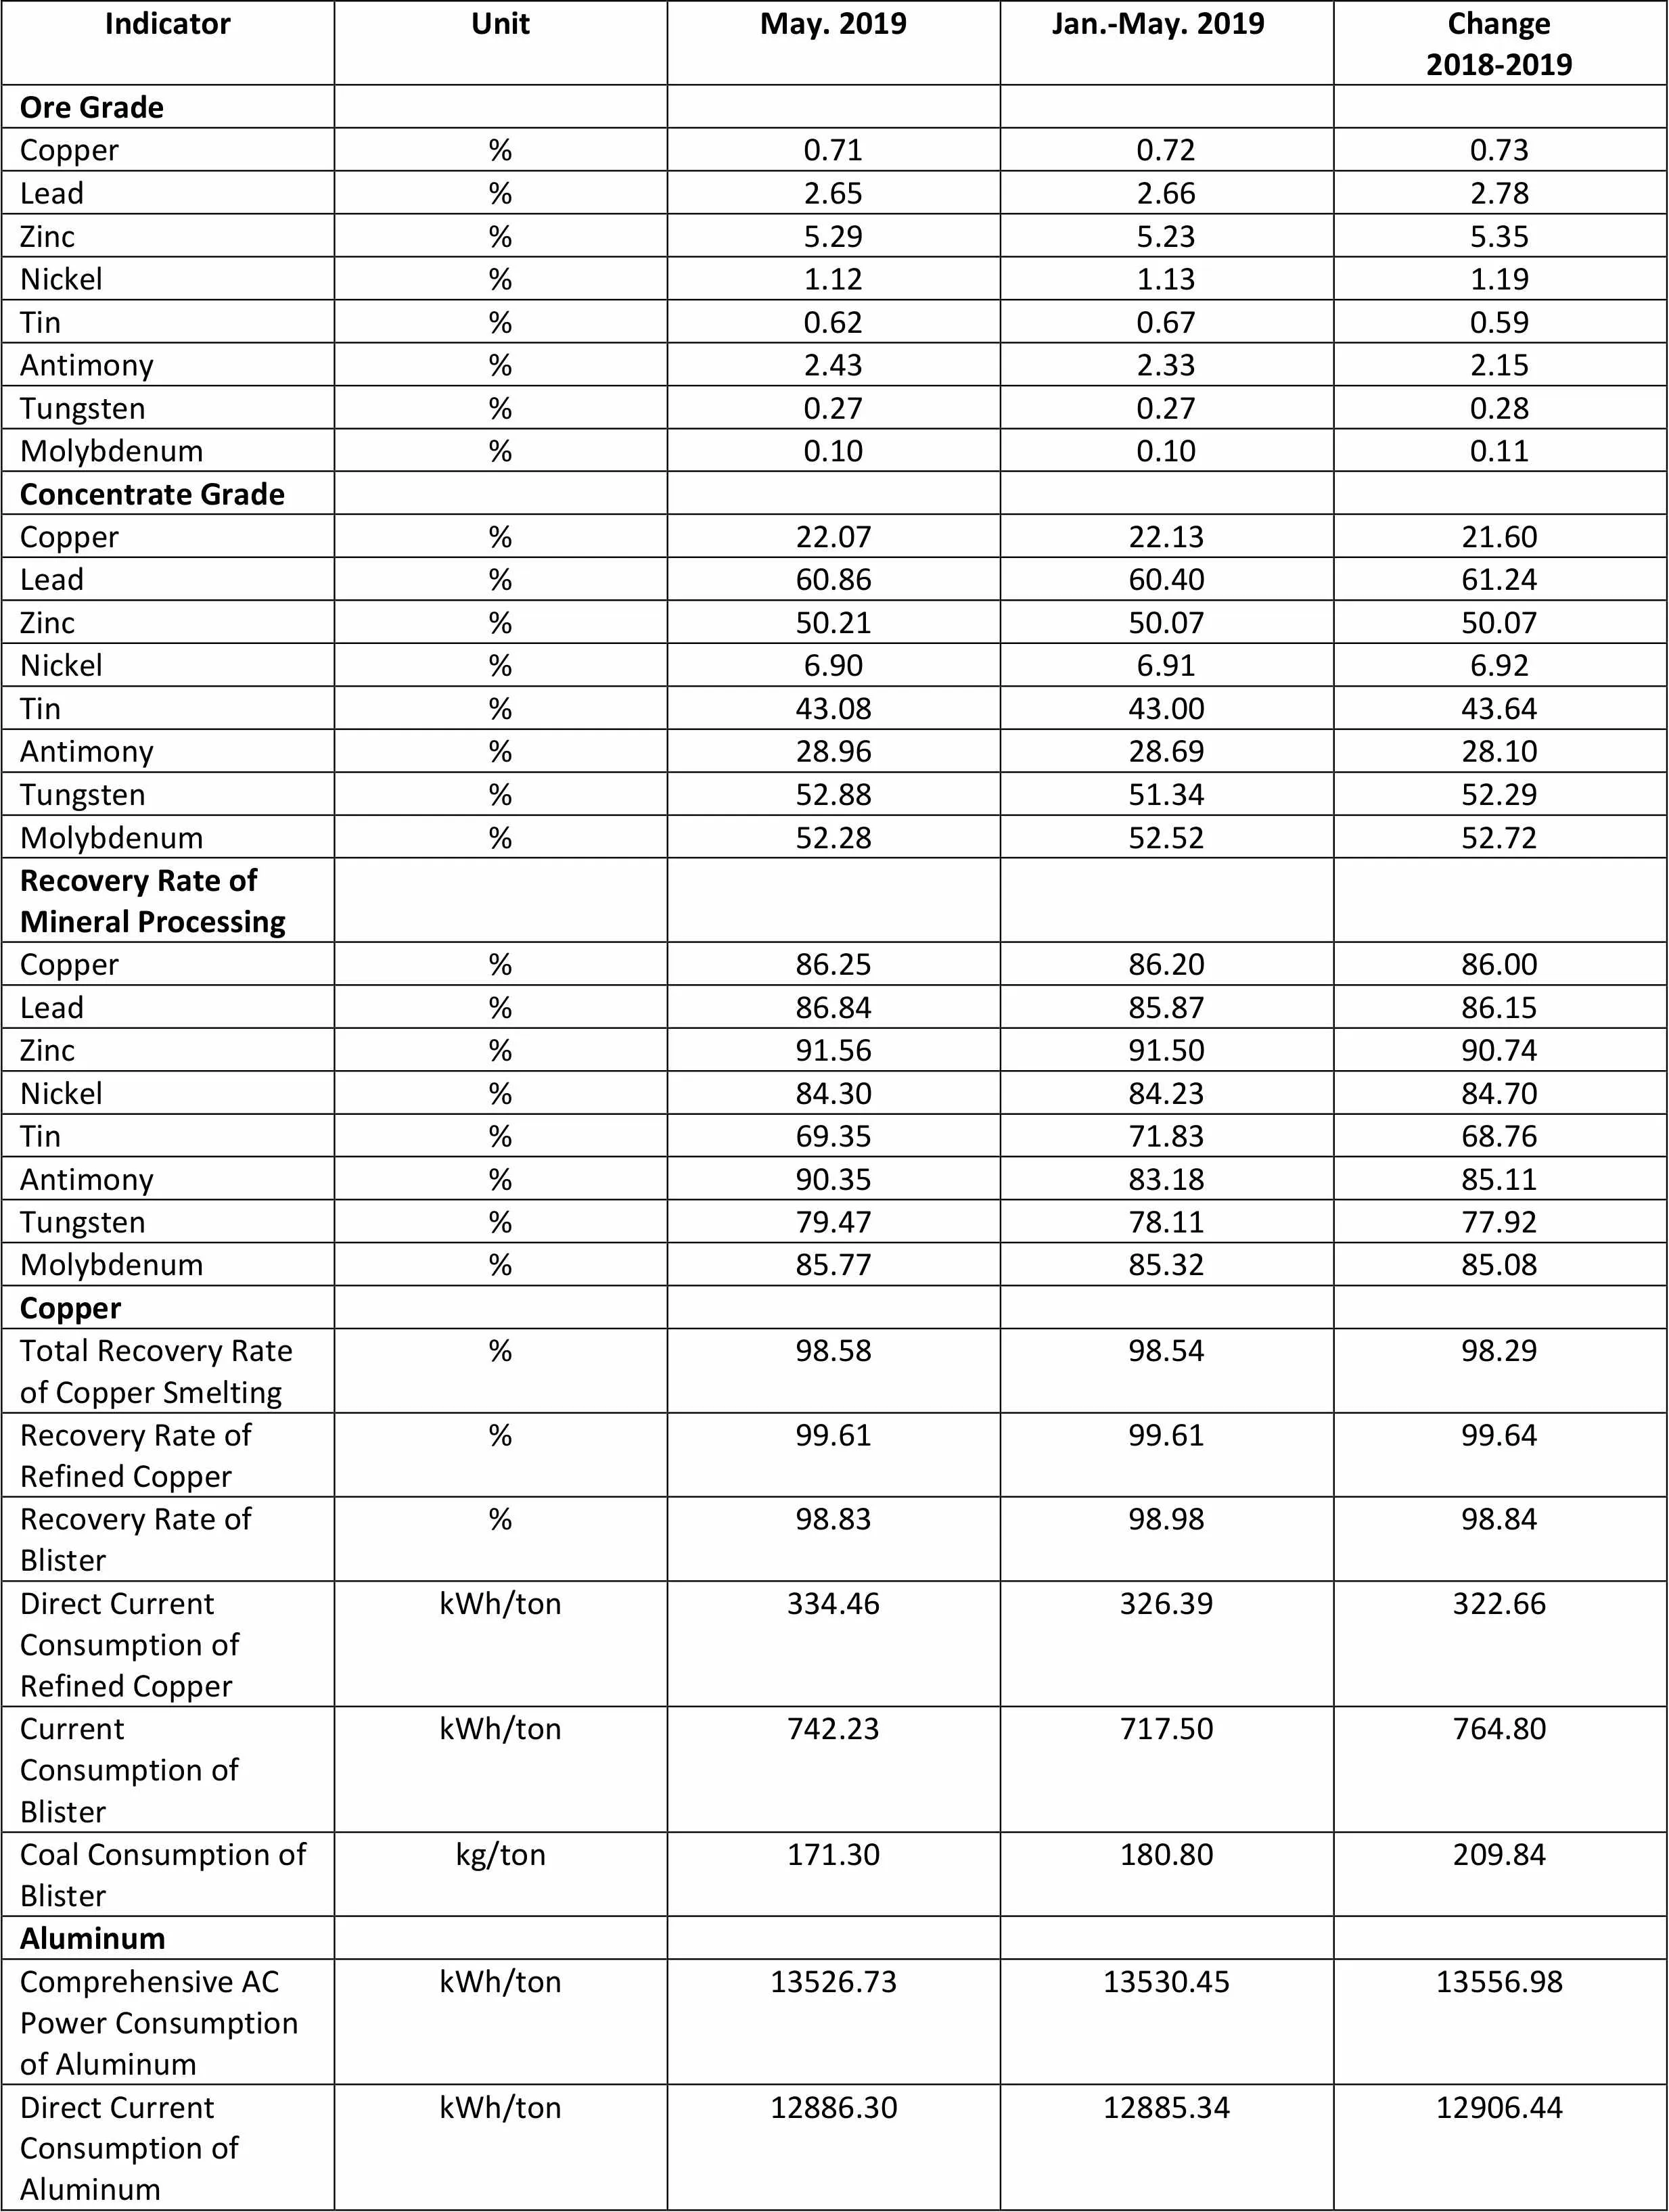
IndicatorUnitMay. 2019Jan.-May. 2019Change2018-2019 Ore Grade Copper%0.710.720.73 Lead%2.652.662.78 Zinc%5.295.235.35 Nickel%1.121.131.19 Tin%0.620.670.59 Antimony%2.432.332.15 Tungsten%0.270.270.28 Molybdenum%0.100.100.11 Concentrate Grade Copper%22.0722.1321.60 Lead%60.8660.4061.24 Zinc%50.2150.0750.07 Nickel%6.906.916.92 Tin%43.0843.0043.64 Antimony%28.9628.6928.10 Tungsten%52.8851.3452.29 Molybdenum%52.2852.5252.72 Recovery Rate of Mineral Processing Copper%86.2586.2086.00 Lead%86.8485.8786.15 Zinc%91.5691.5090.74 Nickel%84.3084.2384.70 Tin%69.3571.8368.76 Antimony%90.3583.1885.11 Tungsten%79.4778.1177.92 Molybdenum%85.7785.3285.08 Copper Total Recovery Rate of Copper Smelting%98.5898.5498.29 Recovery Rate of Refined Copper%99.6199.6199.64 Recovery Rate of Blister%98.8398.9898.84 Direct Current Consumption of Refined CopperkWh/ton334.46326.39322.66 Current Consumption of BlisterkWh/ton742.23717.50764.80 Coal Consumption of Blisterkg/ton171.30180.80209.84 Aluminum Comprehensive AC Power Consumption of AluminumkWh/ton13526.7313530.4513556.98 Direct Current Consumption of AluminumkWh/ton12886.3012885.3412906.44

Continued from the previous page
Unit: metric ton
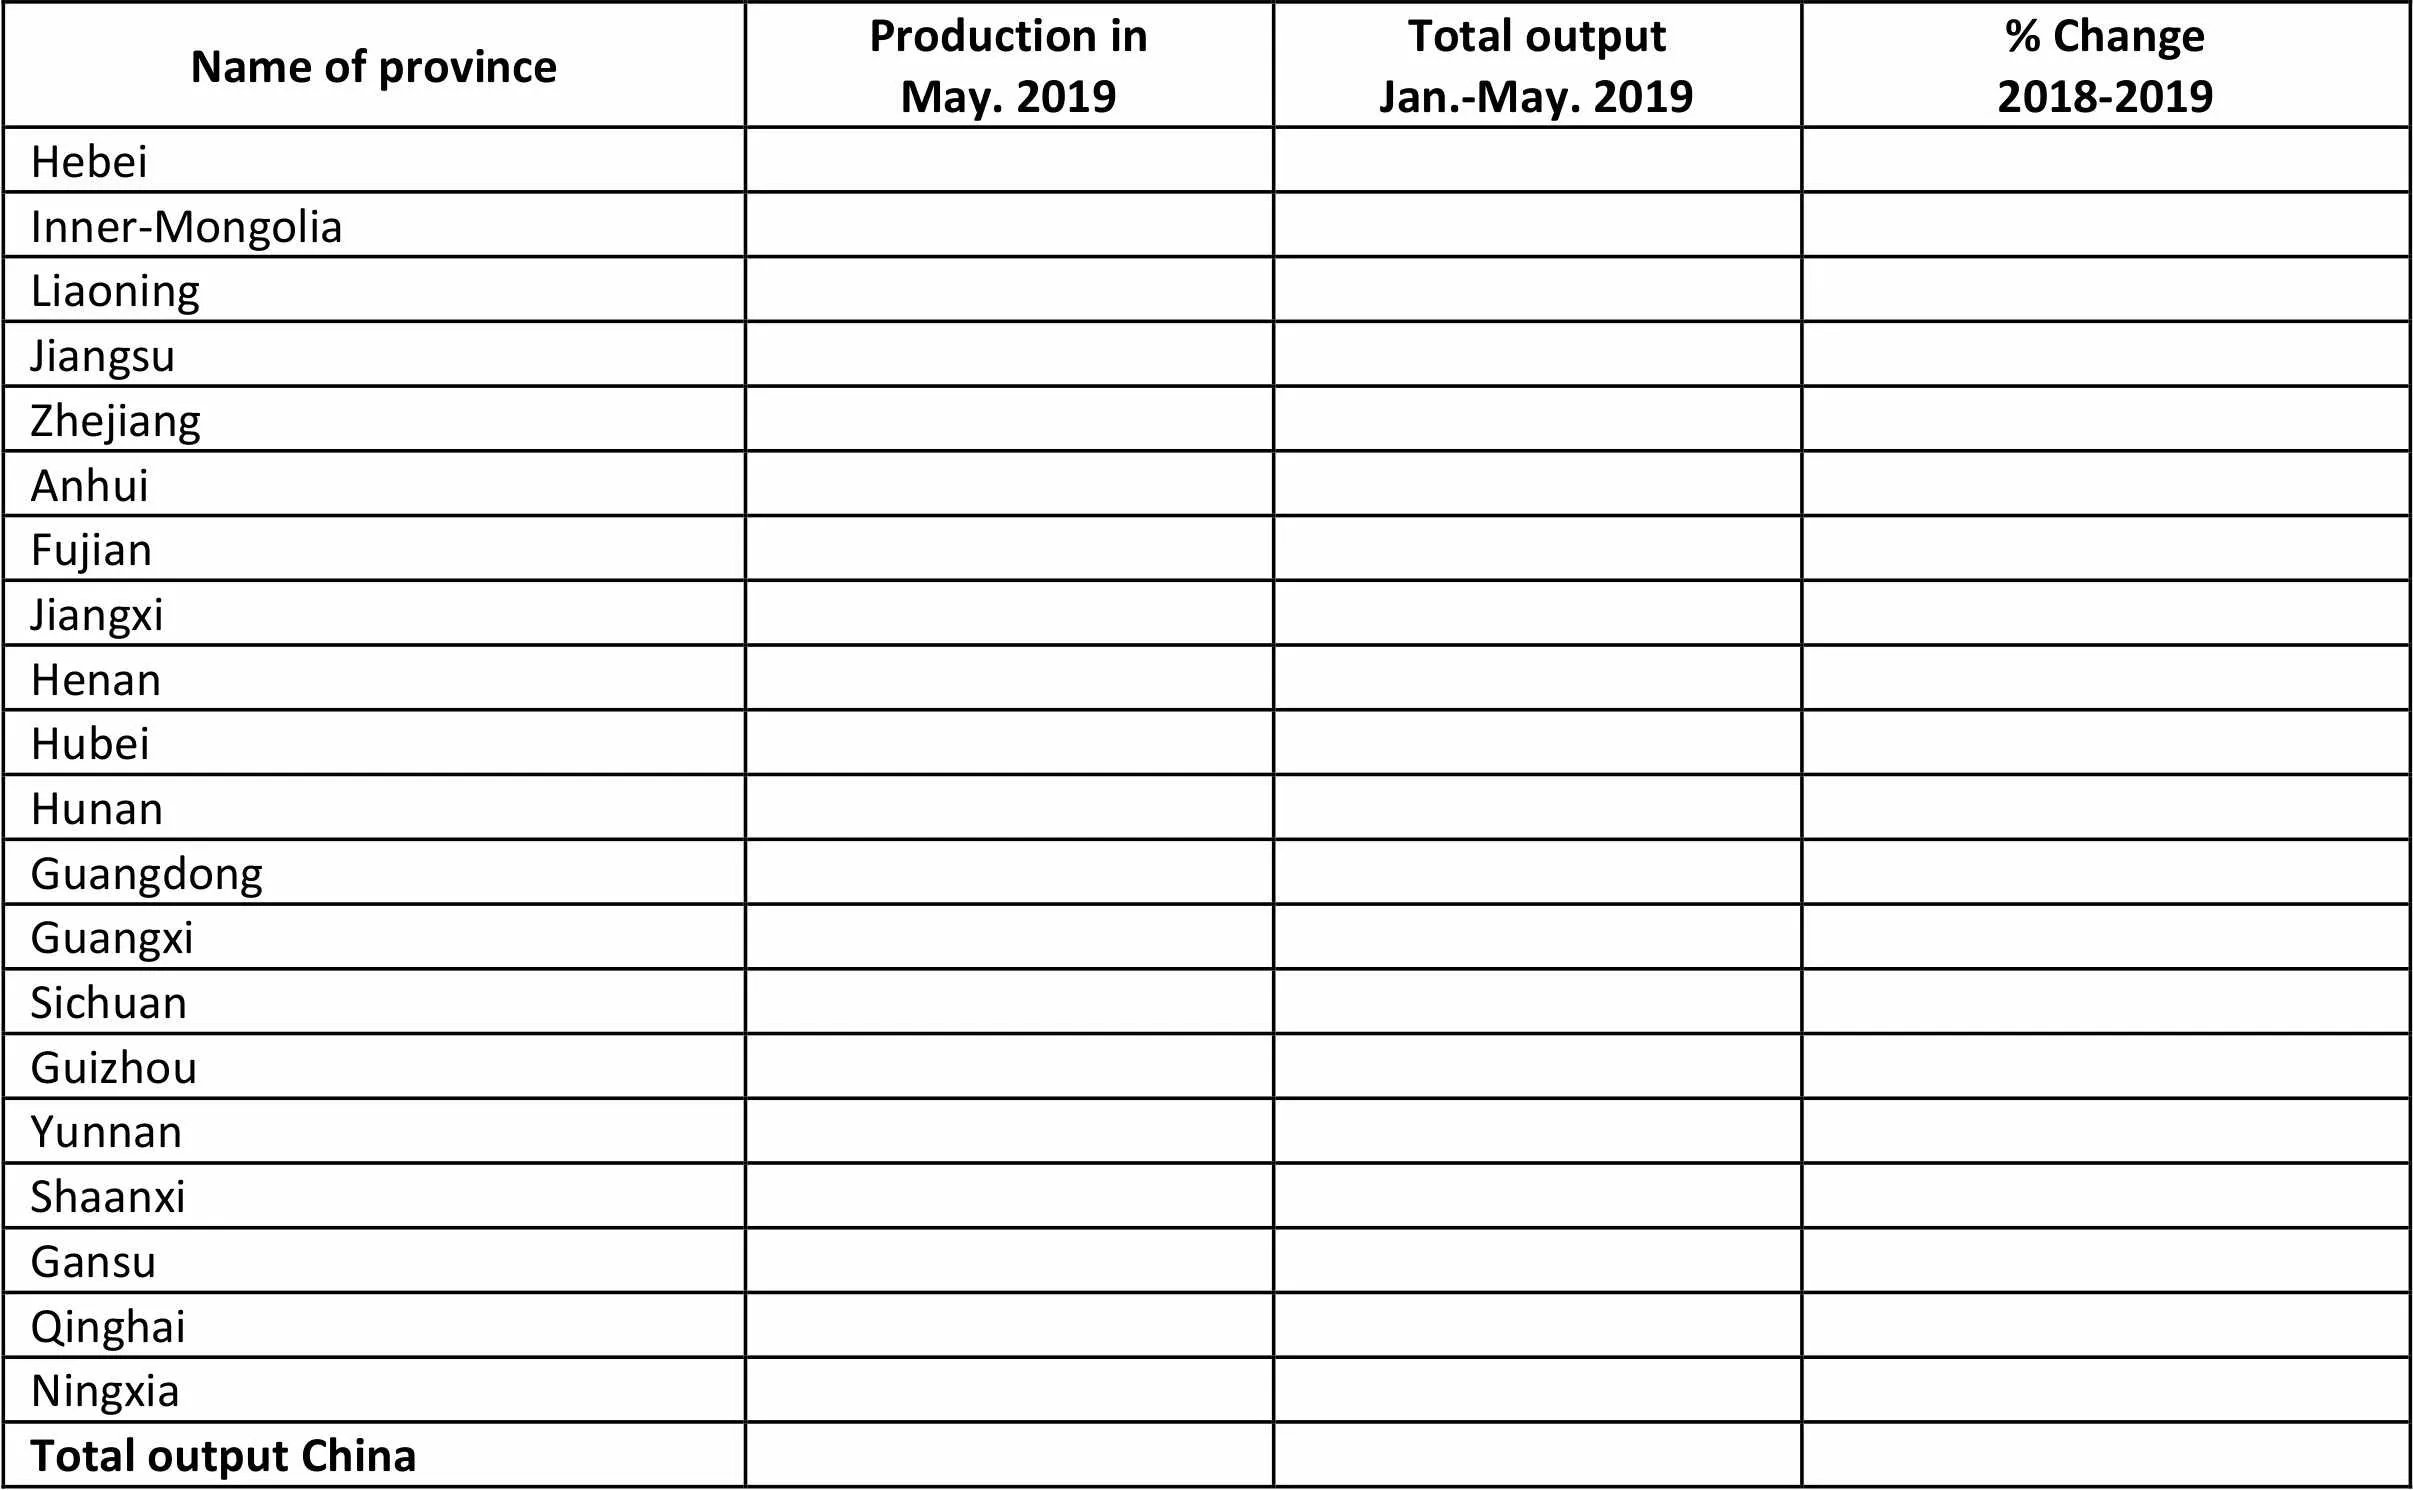
Name of provinceProduction inMay. 2019Total output Jan.-May. 2019% Change2018-2019 Hebei Inner-Mongolia Liaoning Jiangsu Zhejiang Anhui Fujian Jiangxi Henan Hubei Hunan Guangdong Guangxi Sichuan Guizhou Yunnan Shaanxi Gansu Qinghai Ningxia Total output China

