Latest Progress of the Chinese Meteorological Satellite Program and Core Data Processing Technologies
Peng ZHANG,Qifeng LU,Xiuqing HU,Songyan GU,Lei YANG,Min MIN,Lin CHEN,Na XU,Ling Sun,Wenguang BAI,Gang MA,and Di XIAN
Key Laboratory of Radiometric Calibration and Validation for Environmental Satellites,National Satellite Meteorological Center,China Meteorological Administration,Beijing 100081,China
ABSTRACT In this paper,the latest progress,major achievements and future plans of Chinese meteorological satellites and the core data processing techniques are discussed. First,the latest three FengYun(FY)meteorological satellites(FY-2H,FY-3D,and FY-4A)and their primary objectives are introduced. Second,the core image navigation techniques and accuracies of the FY meteorological satellites are elaborated, including the latest geostationary (FY-2/4) and polar-orbit (FY-3) satellites. Third,the radiometric calibration techniques and accuracies of reflective solar bands,thermal infrared bands,and passive microwave bands for FY meteorological satellites are discussed. It also illustrates the latest progress of real-time calibration with the onboard calibration system and validation with different methods, including the vicarious China radiance calibration site calibration, pseudo invariant calibration site calibration, deep convective clouds calibration, and lunar calibration. Fourth,recent progress of meteorological satellite data assimilation applications and quantitative science produce are summarized at length. The main progress is in meteorological satellite data assimilation by using microwave and hyper-spectral infrared sensors in global and regional numerical weather prediction models.Lastly,the latest progress in radiative transfer,absorption and scattering calculations for satellite remote sensing is summarized, and some important research using a new radiative transfer model are illustrated.
Key words: meteorological satellite, geolocation, calibration and validation, satellite data assimilation, radiative transfer model
1. Introduction
The Chinese meteorological satellite program was first proposed and developed in the 1960s (Zhang et al., 2009;Yang et al., 2012b). Chinese meteorological satellites are named“FengYun”(FY),which means wind and cloud in Chinese. To acquire the measurements on the global and hightemporal scales, FY series satellites maintain both a polar sun-synchronous orbit (polar hereafter) and a geostationary orbit(GEO)in space.The first polar satellite was successfully launched in 1988 and named FY-1A.The first GEO satellite was successfully launched in 1997 and named FY-2A. The names of FY series satellites are composed of an Arabic numeral and a letter,in which the numeral denotes the satellite series and the letter the sequence of the satellites within the series. In addition, odd and even numerals represent the FY polar(low earth orbit,LEO)and the GEO series satellites respectively.To date,17 FY meteorological satellites have been launched(see Table 1 and Fig.1). Currently, eight satellites are in operation/orbit.
The FY series satellite program has gone through four stages. The first stage primarily focused on research and development (R&D) of satellite technology. As a result, the lifetime of the satellites failed to meet the requirements.FY-1A operated for 39 days and FY-1B for 158 days.Meanwhile,FY-2A operated for about six months and FY-2B for about eight months. In the second stage, the R&D satellites were transformed to operational ones. Since FY-1C in 1999 and FY-2C in 2004, FY satellites have been stable in orbit and capable of supporting continuous measurements in an operational manner.In the third stage,the first-generation satellites were transformed to second-generation satellites.During the past decade,the new-generation FY polar and GEO satellites,FY-3A in 2008 and FY-4A in 2016, have been in operation.Multiple types of advanced instruments have been mounted on the platform of the new-generation FY satellites, including multiband optical imaging, atmospheric sounding, microwave imaging,hyperspectral trace gas detection,and fullband radiation budget measuring. The new epoch for comprehensive earth observations has begun. The latest and current stage focus on the accuracy and precision of satellite measurements. High performance in image navigation and radiometric calibration is essential to support various quantitative data applications,such as quantitative remote sensing and satellite data assimilation. With the associated open data policy, as well as the stable and accurate measurements, FY satellites are becoming an important component of the international space-based global observing system.
The remainder of this paper proceeds as follows: The three latest FY series meteorological satellites since 2016 are introduced in section 2. In sections 3, 4, 5 and 6, the latest progress in image navigation, radiometric calibration, satellite data assimilation, radiative transfer, and absorption and scattering calculations for satellite-based quantitative remote sensing is summarized.Finally,section 7 elucidates the main progress and our vision for future FY satellites.
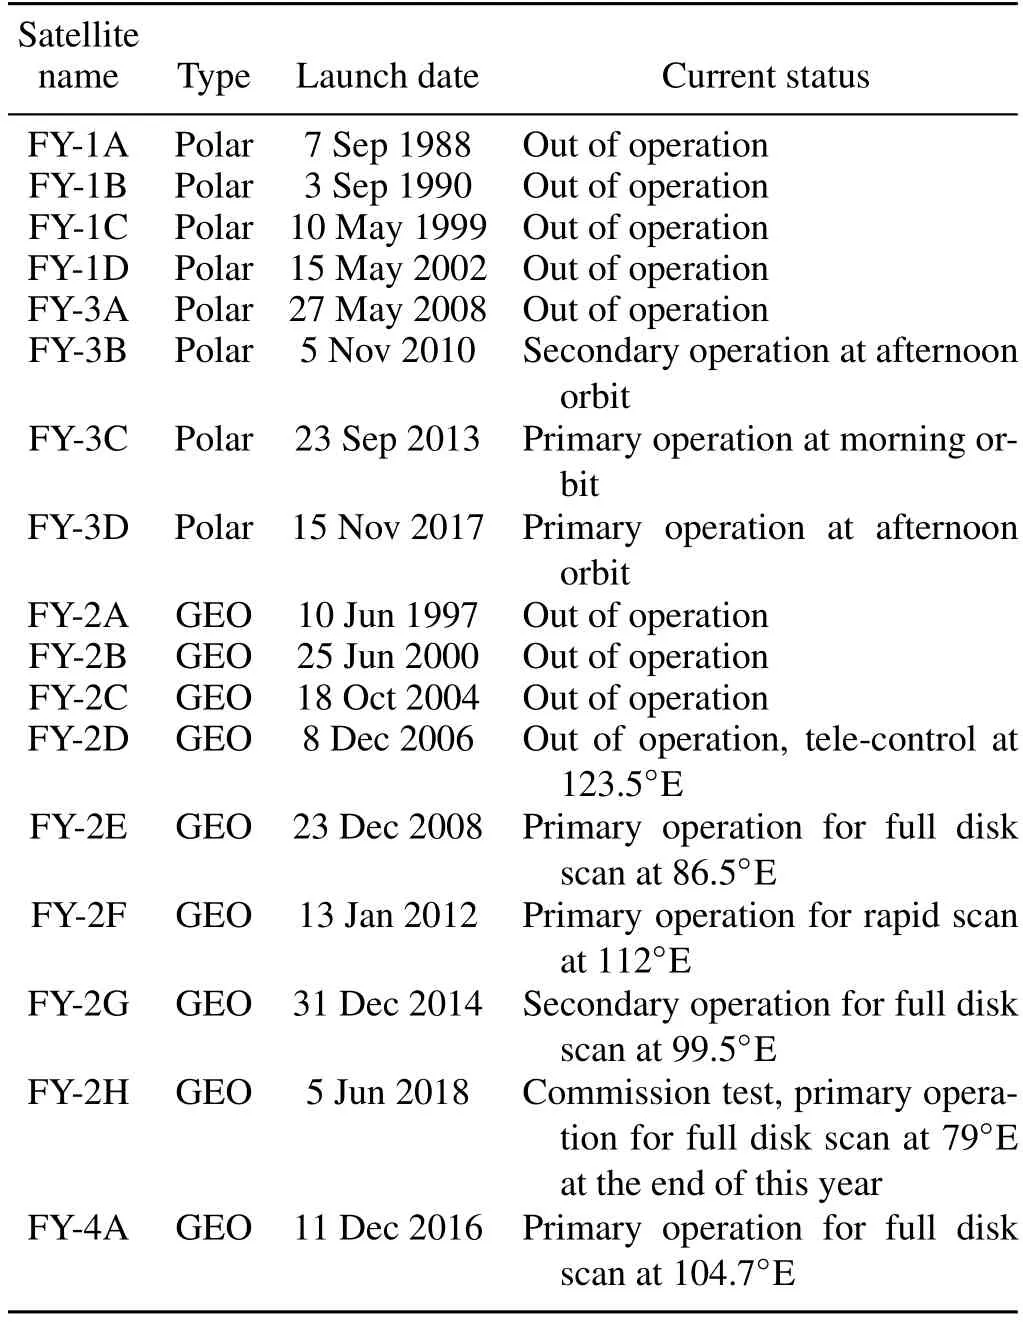
Table 1.List of launched Chinese meteorological satellites and their current status.
2. Latest Chinese FY meteorological satellites
2.1. FY-4A
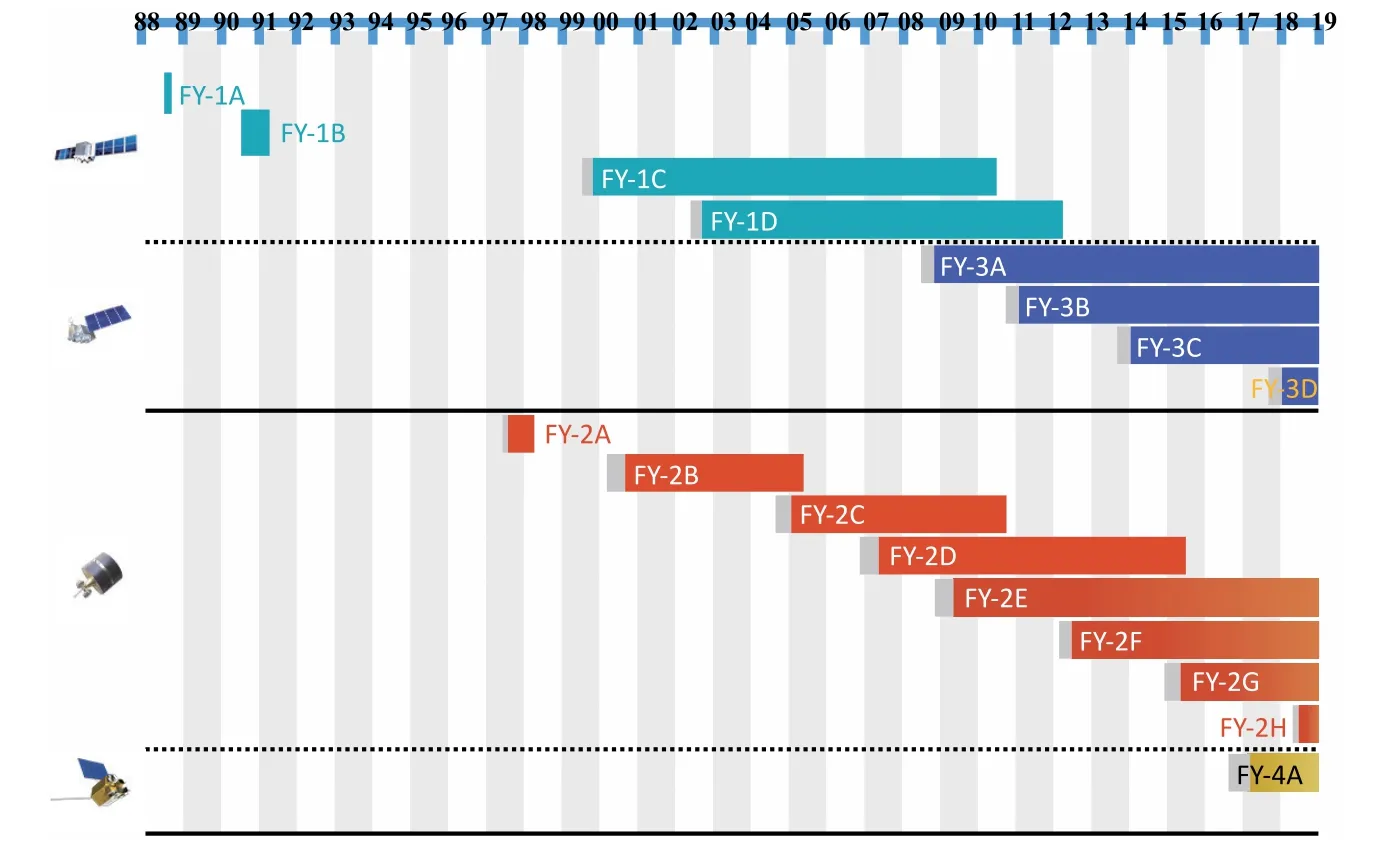
Fig.1.Gantt chart for the development of current FY series satellites.
As the new-generation GEO meteorological satellite and successor of the FY-2 series, FY-4A, the first satellite of the FY-4 series, was successfully launched on 11 December 2016 (Yang et al., 2017). FY-4A is three-axis stabilized and centered around 104.7?E with four sensors, including the Advanced Geosynchronous Radiation Imager (AGRI),the Geostationary Interferometric Infrared Sounder(GIIRS),the Lightning Mapping Imager (LMI), and Space Environment Monitoring Package(SEP)(Min et al.,2017a; Yang et al., 2017). From Table 2, it can be seen that, different from FY-2, AGRI installs 14 spectral bands with a spatial resolution from 0.5 km[visible(VIS)band at 0.64μm]to 4.0 km[infrared(IR)band]and a full-disk observation frequency of 15 min.To further strengthen the ability to monitor lighting,mesoscale and synoptic-scale weather systems,LMI provides continuous measurements with a resolution of 7.8 km at the sub-satellite point and a full-disk observation with a temporal resolution of ~2 ms. As the first high-spectral-resolution advanced IR sounder mounted on a GEO satellite in the world,GIIRS can retrieve the diurnal cycles of three-dimensional(3D) regional atmospheric temperature and moisture. The SEP instrument on FY-4A, with energetic particle detectors and a magnetometer, is used for in-situ monitoring of the near-earth space environment (Yang et al., 2017). Figure 2 shows the first true color and 14-band observation imageries of FY-4A/AGRI.Besides,Fig.3 shows the spatiotemporally matched hyperspectral brightness temperature (BT) spectra from both FY-4A/GIIRS and FY-3D/HIRAS at 0520 UTC 16 December 2018.
2.2. FY-3D
With the expectation to meet new and higher requirements in modern meteorological services and numerical weather prediction(NWP),FY-3D,the fourth satellite in the second-generation Chinese meteorological polar-orbit satellite system of the FY-3 series, was successfully launched on 15 November 2017 (Min et al., 2016, 2018). Different from the previous FY-3A/B/C satellites, FY-3D is able to provide more multi-spectral observations under all weather conditions with 10 sensors on board (Table 3), particularly the two new IR high-spectral sensors with more than 2000 channels. Besides,the updated MERSI-II sensor contains 25 bands with 1000-m and 250-m nadir spatial resolutions,covering the spectral range from VIS (at 0.41 μm) to longwave IR (LWIR, at 12.2 μm). HIRAS, a Fourier interferometer,can measure IR radiances in 1370 channels with a nadir spatial resolution of 16 km in three spectral bands: the LWIRband from 650 to 1136 cm?1, the middle-wave IR 1 band from 1210 to 1750 cm?1, and the middle-wave IR 2 band from 2155 to 2550 cm?1, with spectral resolutions of 0.625,1.25, 2.5 cm?1, respectively. With four main high-spectral bands around 0.76,1.6,2.0,and 2.3 um,as well as an intelligent mode for detecting sun-glint area over sea,GAS(Greenhouse gases Absorption Spectrometer)can retrieve some important greenhouse gases, such as CO, CH4, and N2O. Figure 4 shows a global composite true-color imagery of FY-3D/MERSI-II on 17 December 2018.
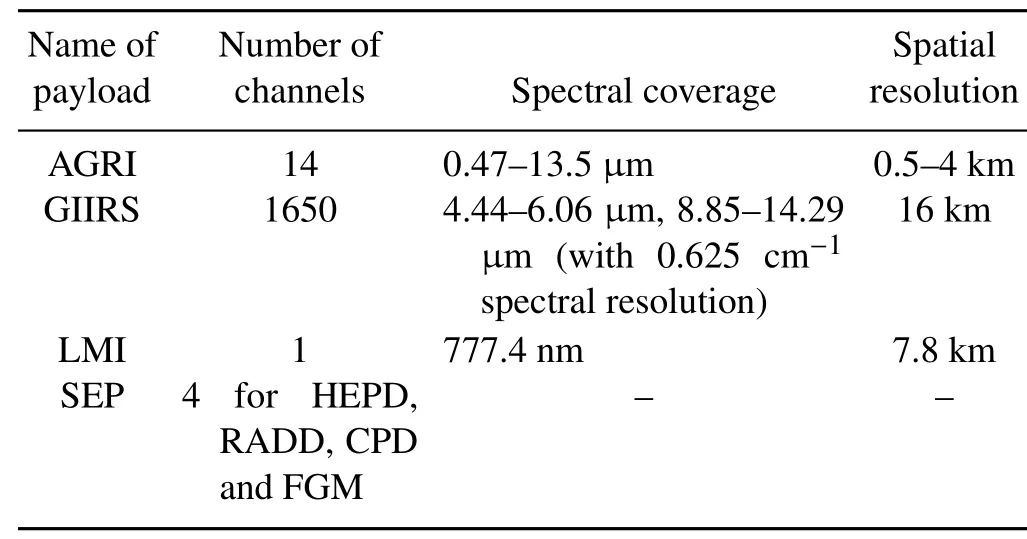
Table 2.Main specifications of the payloads mounted on FY-4A.
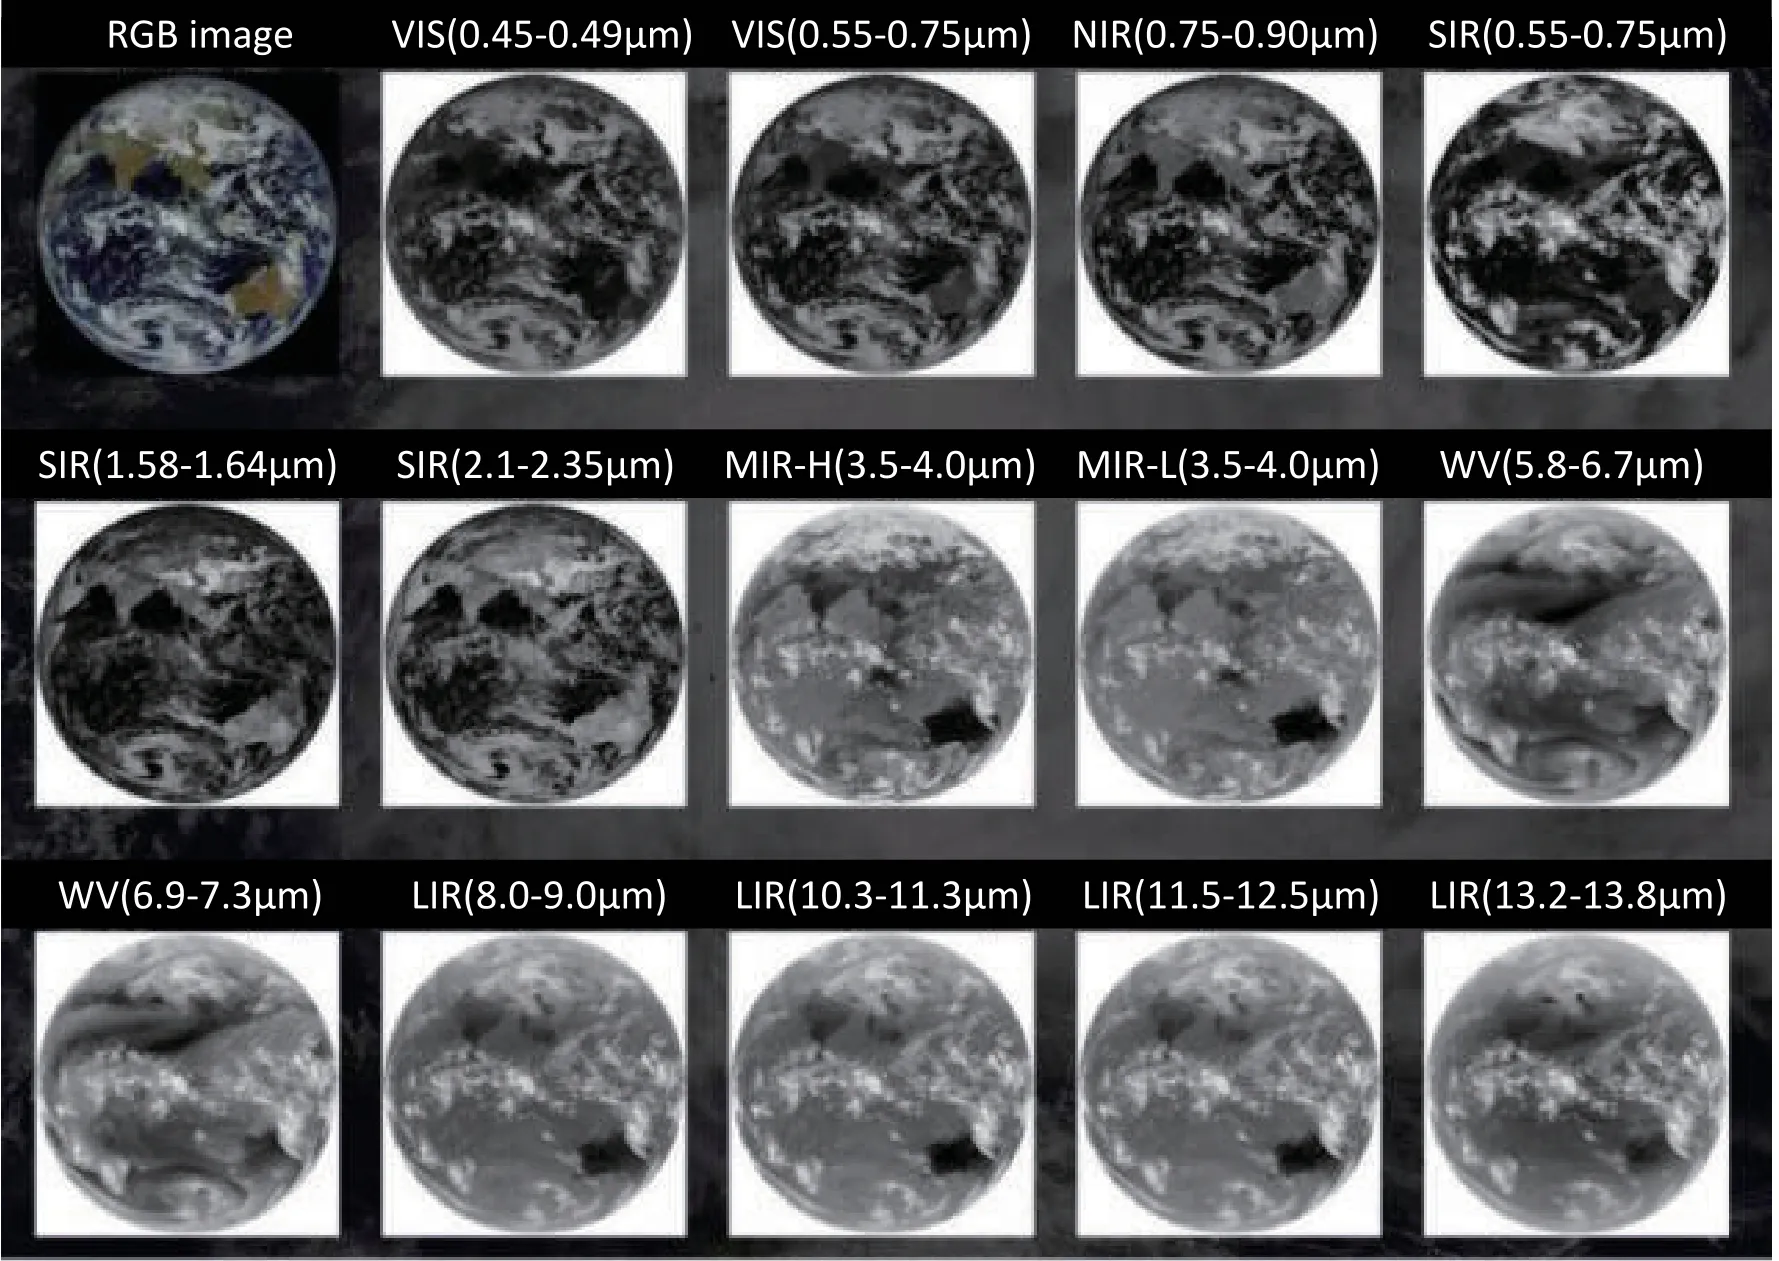
Fig.2.First true color and 14-band observation imageries of FY-4A/AGRI.(Note:RGB=true-color,VIS=Visible Band,NIR=Near Infrared Band,SIR=Shortwave Infrared Band,MIR=Middle Wave Infrared Band,WV=Water Vapor Band,and LIR=Longwave Infrared Band)
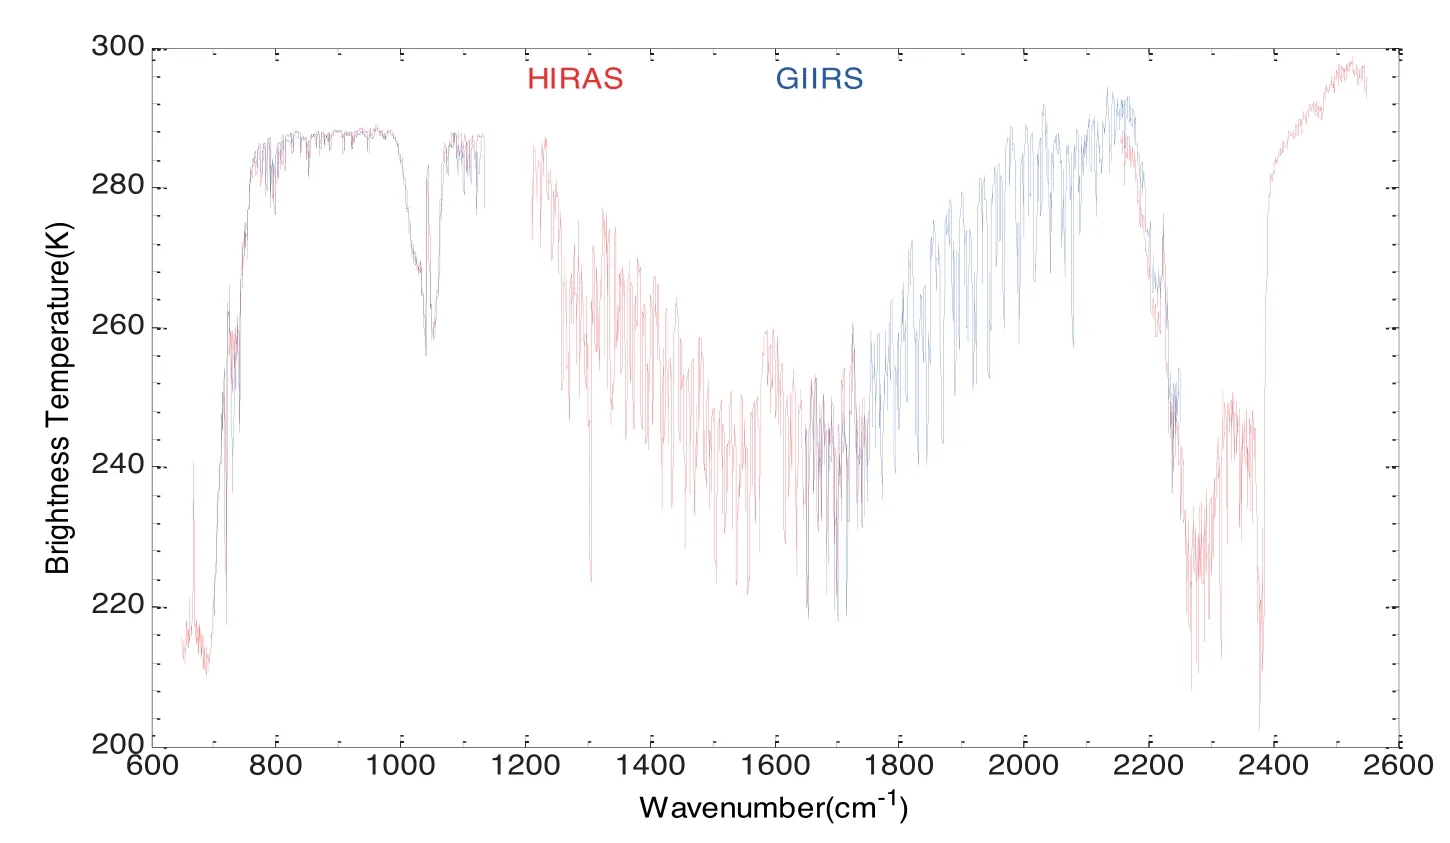
Fig.3.Spatiotemporally matched hyperspectral BT spectra from both FY-4A/GIIRS(blue solid line)and FY-3D/HIRAS(red solid line).(Latitude:12.68?N;Longitude:115.58?E;Time:0520 UTC 16 December 2018).

Table 3.Main specifications of the payloads mounted on FY-3D.
2.3. FY-2H
To better support the China-proposed Belt and Road Initiative, the latest first-generation GEO satellite in the FY-2 series,FY-2H,was successfully launched on 5 June 2018,located at 79?E.The observations of FY-2H mainly cover Central Asia,the west parts of Africa and Europe,and the Indian Ocean. The unique Visible and Infrared Spin-Scan Radiometer (VISSR) aboard FY-2H has five installed channels, from VIS (0.66 μm) to thermal IR (TIR, 12.0 μm) wavelengths(see Table 4), with a spatial resolution of 1.25 km (VIS)or 5.0 km(IR)(Hu et al.,2013).VISSR normally provides a full-disk observation every 60 min,which can be shortened to 30 min during the rainy season from May to September every year.This satellite can monitor mesoscale and synoptic-scale weather systems,such as convective storms,typhoons,heavy rainfall,and even sandstorms.
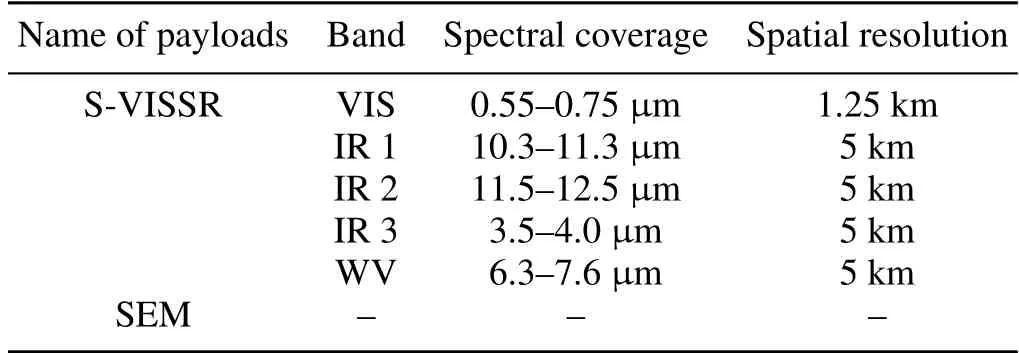
Table 4.Main specifications of the payloads mounted on FY-2H.
3. Image navigation
As a core technology and the first step of satellite data processing,image navigation aims to give an accurate latitude and longitude of each pixel. It is determined by the spacebased payload’s instant location and pointing direction. The orbit height of FY polar orbiting satellites is 830 km,indicating that 1 km over the earth’s surface is equals to 0.069?in the coordinate of the payload.In contrast,the orbit height of FY GEO satellites is 35800 km. Therefore, the same image navigation accuracy for GEO satellites can only be achieved when the measured angle accuracy reaches 0.0017?,which is about 1/43 of that from polar satellites.Nevertheless,with the rapid development of science and technology, to date, more attention has been paid to the determination of the pointing direction parameters in this core technique.
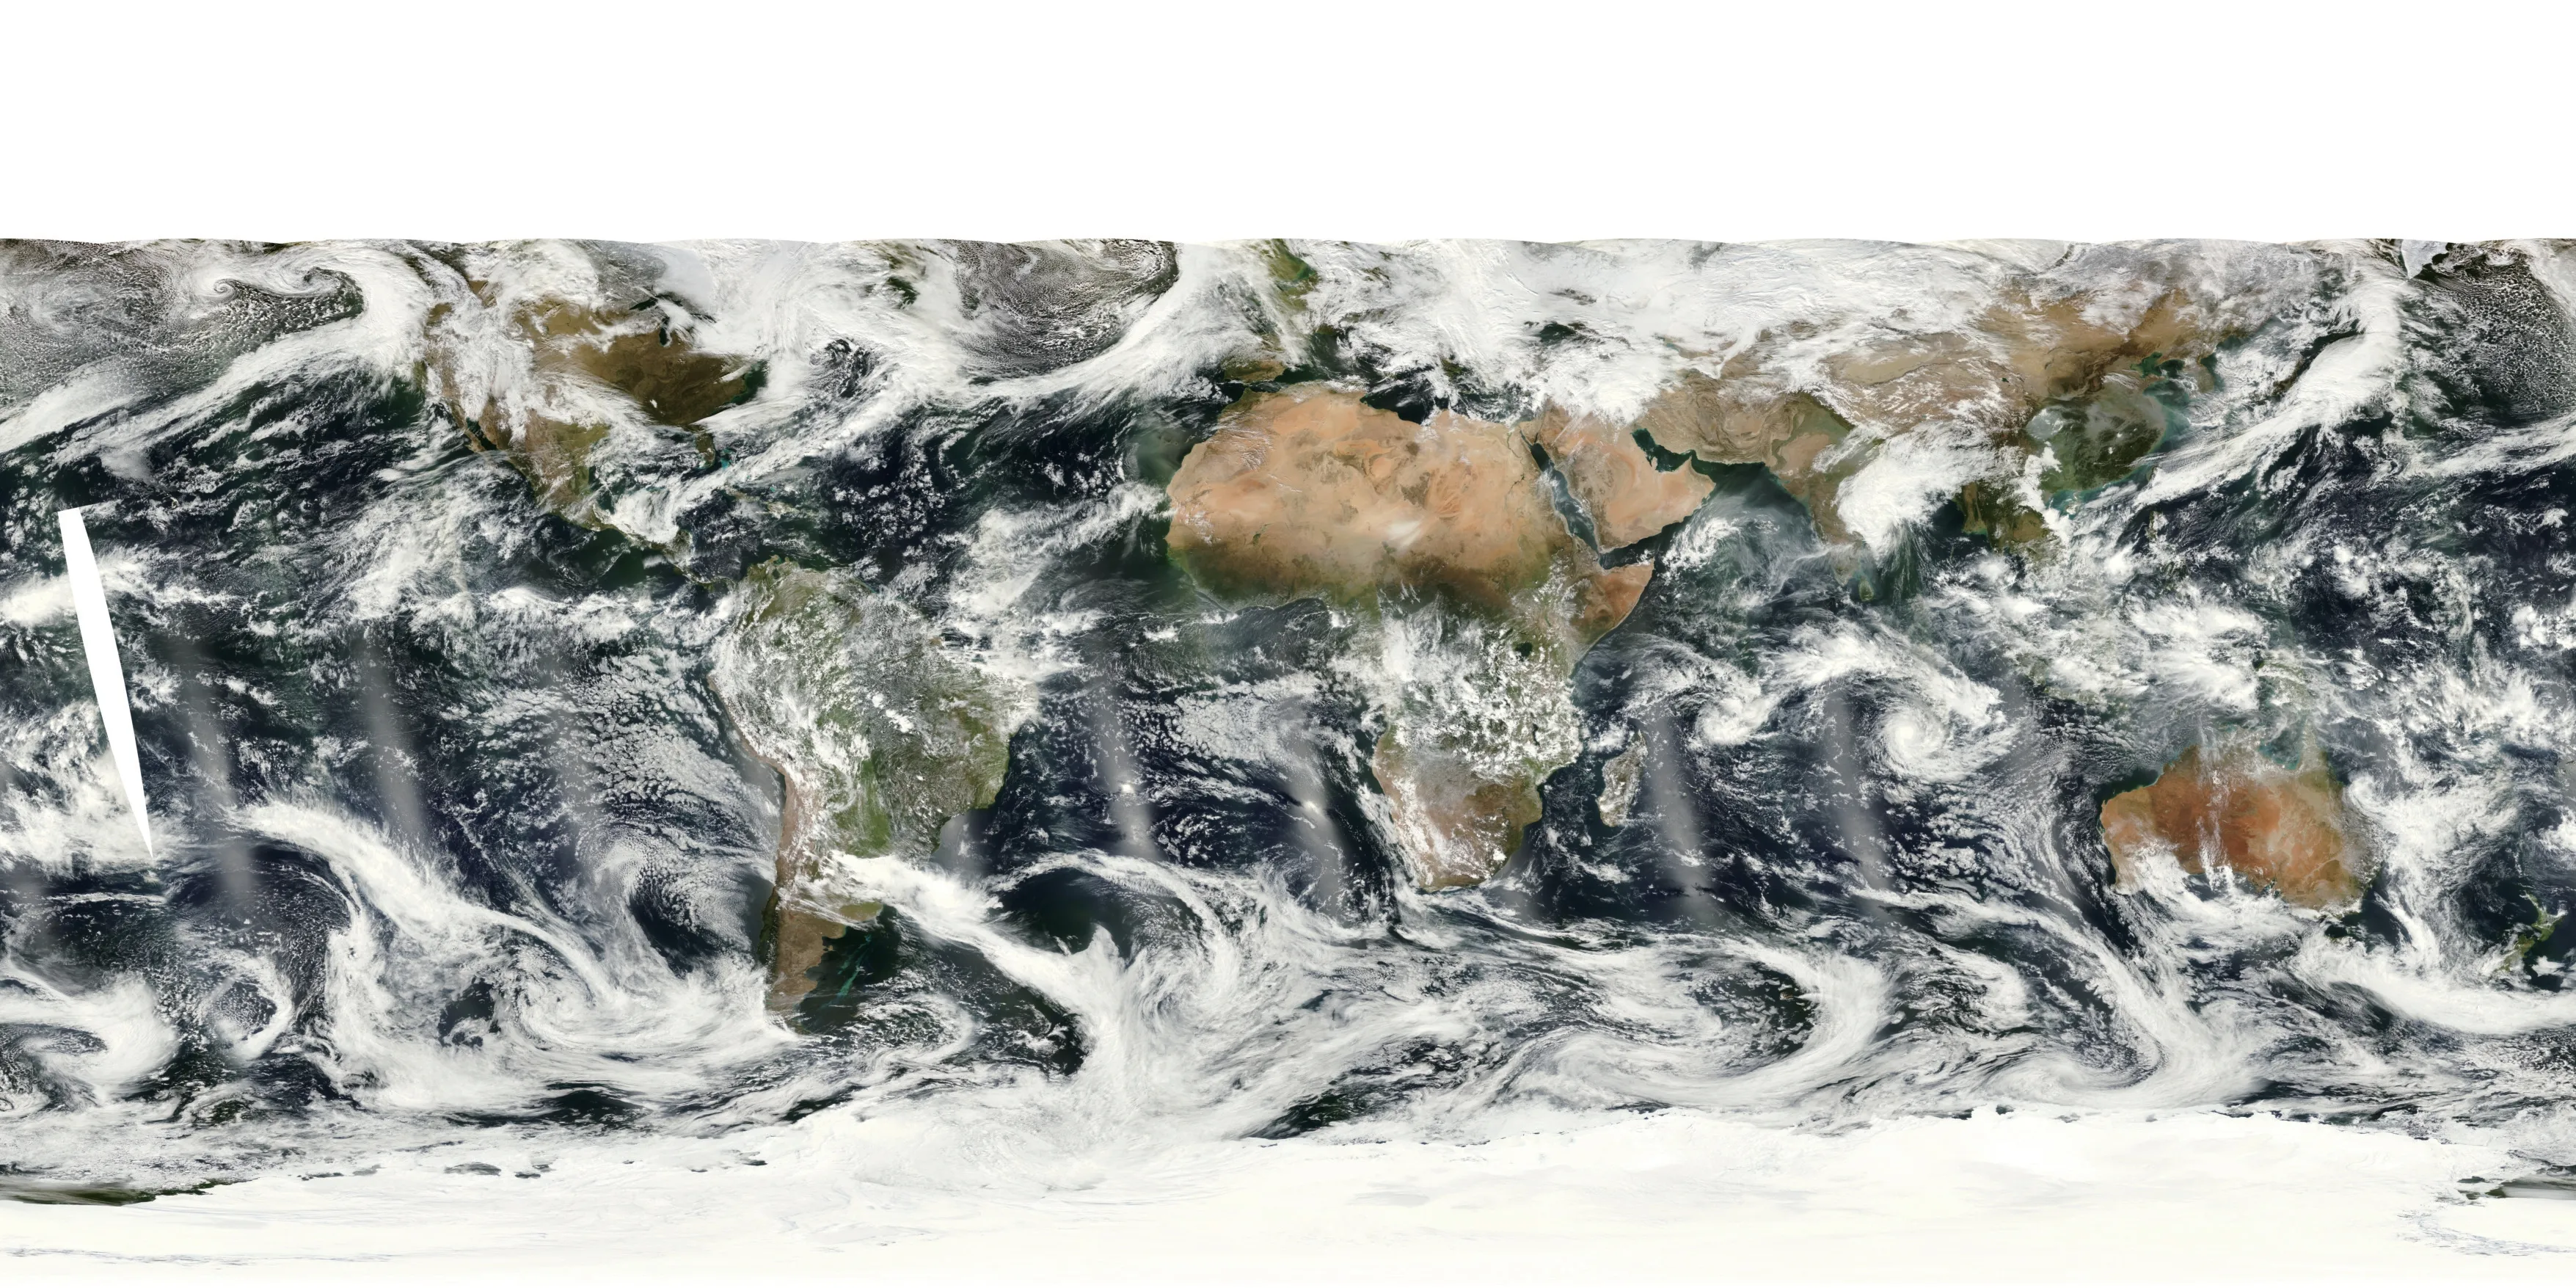
Fig.4.True-color imagery of FY-3D/MERSI-II on 17 December 2018.
3.1. FY-2 image navigation
Lu et al.(2008)developed a fully automatic image navigation procedure for the FY-2 GEO satellite.The three independent ranging stations at Beijing,Urumqi,and Melbourne measure the distances from the station to the GEO satellite eight times per day. With these accurate distance data, the satellite orbital parameters can be precisely diagnosed and predicted every day with an orbital accuracy within 100 m.Besides, FY-2 uses the earth center from the FY-2 full-disk image to derive the south–north pointing direction parameters. The accurate geometry among the earth, sun, and the satellite enables them to obtain the east–west pointing direction parameters and improve the navigation accuracy.Recently, Yang et al. (2014) developed a novel and automated landmark matching method that can detect the FY-2 image navigation on-orbit performance. A 400-day data analysis showed that the uncertainty of the FY-2 image navigation lies on one pixel of the IR band with different hourly, daily, and seasonal characteristics at the sub-satellite point.On the other hand,they pointed out the five main factors affecting the image navigation performance, and further explained why and how the orbit control, integrity of the disk image, satellite viewing zone adjustment, beta angle computation, and moment of sunshine pressure can affect the FY-2 image navigation accuracy.
3.2. FY-3 geolocation
The microwave radiation imager (MWRI) mounted onboard the FY-3 polar satellite provides a considerable amount of critical information for NWP(Lu et al.,2011a).To further improve the accuracy of FY-3/MWRI geolocation, Li et al.(2019) developed a new method for geolocation error estimation and correction,which uses the jump point of the step function to estimate the true coastline point.As a result, the pointing direction misalignment parameters can be derived.Besides, it can characterize the geolocation errors more accurately through this method,and thus the geolocation accuracy can be improved. The final results revealed that an improvement of up to 33.33% in the standard deviation of geolocation errors can be achieved,showing progress from the traditional method. Future work will focus on determining and predicting the geolocation correction parameters through a long-term data analysis.
3.3. FY-4 image navigation
Different from FY-2 with its traditional spin-stabilized platform, the new-generation GEO meteorological satellite,FY-4, adopts a new three-stabilized satellite platform. It can enhance the efficiency of imager viewing and improve the radiometric calibration performance.Besides, it can provide more flexible regional observations and joint observations from both the imager and sounder on the same platform.However, this new space-based observation mechanism also brought great challenges for image navigation and registration.One side of FY-4 always faces the sun, while the other points to the earth, causing a sun exposure issue. The temperature gradient of the two sides can reach up to 400?C.Consequently,the large temperature gradient will directly induce changes in the payload scanning mirror pointing direction,which cannot be well measured in orbit. Therefore,the scanning mirror pointing error caused by the thermal deformation becomes the main source of error in the FY-4 image navigation and registration. Yang and Shang (2011) created a mathematical model and computation method of attitude misalignment parameters based on the observation geometry,which can provide an important theoretical foundation for the GEO image navigation system.The analytic solution for the model was also given. The computation of the attitude misalignment parameters relies on the star observation,which is closely associated with the accurate star centroids in the observed star images.
Besides, Zhang et al. (2017b) also proposed a high precision star centroid detection method. While the star sensors are deliberately defocused with a relatively large star spot,FY-4/AGRI focuses on the purpose of earth observation,making it a challenge to extract accurate star centroids.They used the continuous observation data to improve the star centroiding precision by trajectory fitting and energy response curve fitting.It could accurately extract star centroids with an error of less than 0.3 pixels,laying a solid foundation for FY-4A image navigation.Finally,the FY-4A navigation accuracy was evaluated by the landmarks distributed all over the disk image.The results showed that the accuracy of FY-4A/AGRI navigation reached 112μrad(3σ,within 64.5?of geocentric angle)at the sub-satellite point.
4. Calibration and validation
As another core technology, radiometric calibration(hereafter calibration)can convert the observed digital number into a sensor-dependent data record (SDR). Calibration and validation(C&V)of the SDR comprises the most essential steps for quantitative remote sensing applications. The sensor’s performance in radiance measurement is determined by three necessary procedures; namely, the pre-launch calibration procedure, real-time (RT) calibration procedure (or on-orbit calibration),and offline calibration procedure(or recalibration).The onboard calibration system of the sensor decides the update frequency of RT calibration. The on-orbit performance monitoring system can help us to find the bias in the RT calibration procedure and generate a more consistent and coherent fundamental climate data record for historical archive data by recalibration. Figure 5 shows the satellite calibration procedures in detail.
4.1. Reflective solar bands
4.1.1. RT calibration with onboard calibration system
To overcome the shortage of the FY satellite’s onboard calibration in shortwave bands, a typical VIS calibrator onboard FY-3/MERSI was developed. It is composed of three main optical components: a 6-cm-diameter integrating minisphere, a beam expanding system, and the trap standard detectors (Hu et al., 2012). There are two halogen tungsten lamps in the mini-sphere. The sunlight is congregated and imported into the mini-sphere by an incident light cone.The beam expanding system includes a flat mirror and a parabola,which enable the small beam output from mini-sphere to fill a large entrance aperture of MERSI. The output light from the mini-sphere is reflected by the flat mirror and then collimated by the overfilled parabola to create a quasi-Gaussian beam, which is the MERSI calibration beam. The trap standard detectors stow the edge of the visible onboard calibrator(VOC) exit, including four silicon detectors with the same filter designs as some MERSI bands and one panchromatic detector without a filter. The VOC is mounted on the side of the main instrument,allowing the scanner to view its exit and observe the sun signal when the satellite passes over the terminator area. Based on the onboard calibration data from FY-3A and FY-3B,it has been proven that the FY-3/MERSI degradation is wavelength dependent. During the first two years,the annual degradation rate of short wavelength bands(470–565 nm) in MERSI is more than 10% yr?1, while that of longer wavelength bands is less than 4.0%yr?1(Hu et al.,2012; Shi et al., 2014; Xu et al., 2014a). FY-3D/MERSI-II VOC has been significantly improved by shortening the solar illumination of the inside mini-sphere with a door based on three previous satellite running experiments(Xu et al.,2015b,2018).
4.1.2. C&V with China radiometric calibration sites
Despite the VOC components designed for FY-3 A/B/C MERSI and FY-4A AGRI, no effective solar band onboard calibration has been created, due to some defects. The radiance at the top of the atmosphere (TOA), which uses a radiative transfer model(RTM)and vicarious calibration(VC)method with field measurements conducted at a China radiometric calibration site(CRCS),Dunhuang Gobi-desert,is always used as the main post-launch absolute radiometric calibration method for reflective solar bands(RSBs)(Sun et al.,2012a).VC using CRCSs was mainly dominated by FY satellite sensor solar band calibration via field campaigns during the first 20 years of the FY series satellites.However,with the maturity of new calibration technologies for remote sensors,ground-based VC has gradually become an important validation method for remote sensing radiance-level products.
VC for FY sensors is mainly conducted using simultaneous space-based and ground-based observations at CRCSs.Various surface and atmosphere parameters are collected and input into the RTM to calculate the apparent sensor radiance at the pupil for further calibration coefficient calculation.VC can be divided into reflectance-based,radiance-based and irradiance-based calibrations according to different measurements and data processing procedures.It can improve the FY satellite sensor calibration precision of the baseline method at the first developing stage of quantitative remote sensing.However, its disadvantages should also be considered, such as the high cost,low calibration frequency,and radiance dynamic limitation when using a single calibration site.Gradually developed in recent years, global pseudo invariant calibration site(PICS)selection has become a main operational method of FY satellite inflight calibration(Sun et al.,2012b;Wang et al.,2015,2017b).
4.1.3. C&V with PICSs
As mentioned above, PICS calibration technology is an important extension of the traditional CRCS RSB calibration technology. The traditional calibration method relies greatly on satellite synchronous and ground-based field observations,which are significantly affected by local weather and environmental conditions. Usually, the calibration frequency based on traditional technology is only 1–2 times per year(i.e., Dunhuang site). In contrast, PICS calibration technology introduces multiple uniform and stable target fields(i.e.,Gobi and desert, water etc.), and multi-source data (numerical weather forecast products, climate and satellite datasets etc.),which is independent from the in-situ observation,and can improve the frequency, dynamic range, and stability of calibration.
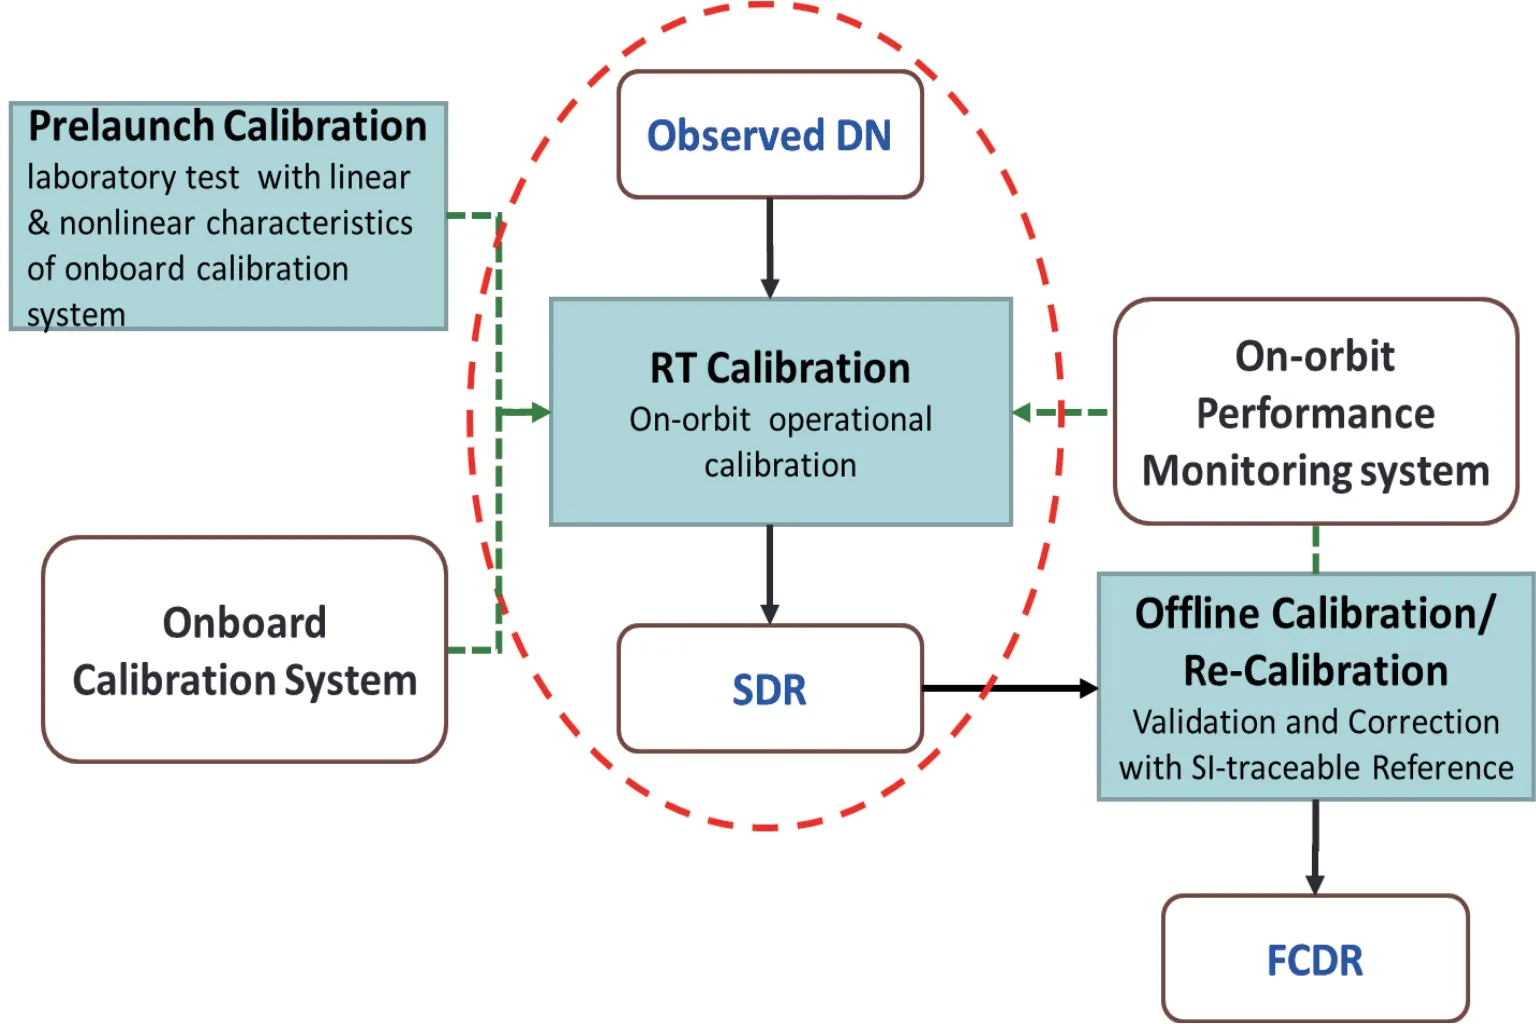
Fig.5.Calibration procedure.
To increase the in-flight calibration frequency, the PICS tracking method was implemented at global stable sites with different brightness without synchronous in-situ measurements (Sun et al., 2012b, 2013; Wang et al., 2015, 2017b).The PICS calibration reference was evaluated against observations of Aqua/MODIS, showing mean relative biases within 5%from 0.4 to 2.1μm(Sun et al.,2012b).The PICS calibration method was also applied to derive the calibration coefficient time series, and reveal the sensor’s in-flight response variation (Shi et al., 2014). In general, bands with short wavelengths, like blue bands, experience large degradation with an average annual degradation rate of approximately 17%for FY-4A/AGRI 0.47 mm band and nearly 10%for FY-3A MERSI 0.412μm band in the early years.The red and near-infrared bands are relatively more stable,and some bands show noticeable response increases(Sun et al.,2012b,2013, 2018; Sun and Li, 2014; Wang et al., 2014c, 2018a).The calibration updating model was built from the temporal trend of the calibration coefficient series,and applied in satellite data reprocessing(Sun and Li,2014;Wang et al.,2018b).Taking the PICS simulation as the reference, the radiometric mean relative bias is mostly within 5%(Sun et al.,2018).Aqua/MODIS is also used as a reference to monitor the recalibrated data quality. A double difference analysis showed that the mean relative biases are almost within 5% over stable deserts (Sun et al., 2012b), and the synchronous nadir observation analysis also showed good agreement(Sun et al.,2012b,2013;Sun and Li,2014).
In addition,by using the PICS calibration method,a new dataset of reflectance calibration coefficients has also been derived for the RSBs of FY-3A/B/C VIRRs (Visible and Infrared Radiometer). It can be used to update the VIRR calibration on a daily basis. The on-orbit radiometric changes of the VIRR onboard the FY-3 series have been comprehensively assessed based on the new dataset of calibration slopes.All the recalibrated VIRR reflectance data over the site of Libya 4, the most frequently used stable earth site, have been compared with those provided by the Level 1B (L1B)product. The results indicated larger radiometric response changes of the two VIRRs onboard FY-3A/3B than those of FY-3C/VIRR, and significant wavelength dependency. The PICS calibration approach can generate consistent VIRR reflectance on different FY-3 satellite platforms. After recalibration,the differences in the TOA reflectance data of VIRRs decrease from 5%–10%to less than 3%during the whole lifetime, indicating good accuracy and lower temporal oscillations.
4.1.4. C&V with deep convective clouds
Compared with desert targets, the characterization of deep convective cloud (DCC) is highly reliable and stable,with little seasonal or spatial variation (Chen et al., 2013,2017).The DCC-based calibration method has already been widely applied to many satellite sensors for evaluating calibration accuracy. DCCs can often extend above the troposphere,and their spectral features are similar to those of reference white board for radiometric calibration.On the RSBs,it can provide high and stable reflectance for calibration. Based on simulations that use an RTM,DCCs could be used as invariant radiometric targets to monitor radiometric calibration change. DCCs are better than ground objects because most are located at the top of the troposphere,which can both minimize the impact of moisture and aerosol in the troposphere and reduce the impact of background stratospheric aerosol.
The long-term change trend of FY3/MERSI RSBs can be well illustrated by the DCC method (Chen et al., 2013).The monitoring results show obvious response degradations in both the blue bands and water-vapor absorption bands.Compared with other calibration approaches, such as intercalibration, the PICS method and CRCS vicarious method,the degradation results from the DCC method are consistent,and the largest degradation difference is less than 2.5%, except for three bands(11,18 and 19)of FY-3A/MERSI.
Besides,the operational FY-2 radiometric calibration bias and the long-term degradation trend have also been evaluated using Aqua/MODIS,which is the baseline of radiometric reference by DCC (Chen et al., 2016).The results were as follows: (1)There are different degradation degrees for FY-2D,FY-2E and FY-2F,among which the biggest degradation appears in FY-2D,due to its longest period. The annual degradation rates of FY-2D and FY-2E are quite similar,at 1.67%and 1.69% respectively, whereas the rate of FY-2F is lower,at 0.81%. (2)During satellite eclipse,which can be detected by the DCC method,the instruments are not stable. (3)There are biases in the operational radiometric calibration between FY-2 and Aqua/MODIS,which is usually treated as the radiometric reference. The radiometric calibration method based on DCC could work well in the radiometric calibration for FY-2.The results will help us to further understand the degradation of instruments and facilitate quantitative usage.
4.1.5. C&V with the lunar target
The lunar irradiance reflected by the sun can be taken as a benchmark for radiometric calibration in VIS and near-IR spectra, due to its high photometric stability. Thus, the lunar target is always selected as both the radiometric standard for earth-orbiting satellite-borne instrument calibration and an earth illumination source in the sky at night(like solar irradiance during daytime)for ground-based and satellite remote sensing at night. However, existing lunar irradiance models are not precise enough in quantitative remote sensing and calibration applications. To improve and validate the current lunar irradiance models, a three-month earth-based observation of lunar target was conducted from December 2015 to February 2016 by the National Satellite Meteorological Center, China Meteorological Administration (Wang et al.,2017c).The lunar hyperspectral irradiance ranging from 399 nm to 1060 nm, was retrieved by an imaging spectrometer in Lijiang,Yunnan Province(Wang et al.,2017d;Zhang et al.,2017c).The ground-based lunar observations and other lunar models(ROLO and MT2009 models)were compared.It was found that the results from the ROLO model were closer to the ground-based observations than those from the MT2009 model.It was also found that the difference between these two models in the shortwave IR region was larger than that in the VIS region. The average relative difference between the ROLO model and ground-based observations was approximately 5.86%.The primary reasons for the difference were also elaborated, providing a theoretical foundation for establishing an accurate lunar irradiance model(Wang et al.,2017d,Zhang et al.,2017c).
The FY-2 imager is capable of capturing moon images.Recently, a new function has been added to both the FY-3C and FY-3D MERSI sensors to monitor the lunar disk in space view and further improve the on-orbit RSB calibration.Wu et al.(2016a)developed a method to obtain the sensor degradation via lunar images. As a reference channel,a dataset from band 11 has also been collected to record lunar measurements since the launch of FY-3C.By using the ratio between the target and reference channels,the effects of the lunar phase angle and the relative distance of the solar–lunar–satellite have been removed from the measured lunar irradiance. The RSBs of FY-3C/MERSI have been calibrated from the lunar measurements. Analysis of the long-term trend of the MERSI RSBs revealed that the annual attenuation rate has increased to 14.55% and 8.42% for bands 8 and 9 respectively. It is only within 1.15%and 4.72%for bands 1,6,10,11,16,and 19. No attenuation is apparent for the remaining bands. The aforementioned results can be used to correct the systematic biases in MERSI RSB calibrations and improve the radiometric calibration accuracy.
Chen et al.(2018)also reported a method whereby the lunar target is used as a stable radiation calibration target and the lunar irradiance model is used to monitor the radiation response degradation of the FY-2 GEO meteorological satellite. The data of the FY-2E scanning radiometer containing the moon target by orbit forecast from January 2010 to October 2014 were collected. Meanwhile,the result based on the lunar calibration method was compared with that based on the DCC radiometric calibration method.The results showed that,being able to effectively monitor the sensor response attenuation, the lunar radiometric calibration tracking method can be used as a radiometric benchmark for VIS band calibration during the whole lifetime of the sensor to improve the radiometric calibration accuracy.
4.1.6. Integrated calibration
Due to the limited dynamic range of each VC target,traditional VC calibrations based on a linear formula are unable to deal with nonlinear calibration.A method for on-orbit wide dynamic integrated vicarious calibration(WD-IVC)has been developed to resolve this problem(Xu et al.,2015b;Wang et al., 2017c). Various VCs covering different dynamic ranges are used here,including the moon,a simultaneous nadir overpass (SNO), PICSs, and DCC. By combing these VC samples, wide dynamic radiometric calibration can be achieved via WD-IVC.Calibration samples from different VCs are integrated by subsection-averaging,and calibration coefficients are calculated based on integrated samples by using weighted nonlinear regression. The prelaunch quadratic term of the calibration equation is used to perform nonlinear correction,and the on-orbit calibration slope and intercept are evaluated.Evaluation results from different VCs show good consistency,and the correlation coefficient of integrated samples can reach 0.99. WD-IVC results for FY-3C MERSI can be applied to the medium-to-high dynamic range with reflectance greater than 10%. The calibration accuracy is higher than 1.5% in high reflective scenes and 3% in medium reflective scenes.The WD-IVC method can be applied to all RSBs, reducing the uncertainty of the two-point calibration and the influence of nonlinear error.
4.2. TIR bands
4.2.1. RT calibration
The onboard blackbody(BB)is usually used for RT TIR radiometric calibration, and the space view provides offset measures for calibration. Except for the FY-2 satellite, all the FY TIR sensors can perform the onboard BB calibration with a full EV (Earth View) optic path. For the FY-2 radiometers, the onboard device cannot produce an absolute calibration because the BB is not directly viewed by the main telescope but through a mirror inserted between the front optics and the cold assembly containing the IR detectors(Hu et al.,2013).Multiple methods are used for FY-2 on-orbit calibration, cross-calibration based on a hyperspectral reference sensor (Xu et al., 2012, 2013a), and the inner BB corrected by lunar emission(Guo et al.,2016).The relative radiometric calibration for TIR bands is also significant.
4.2.2. Validation
The validation of TIR calibration is based on both ground measurements and reference sensors. The ground validation is occasionally conducted by radiative transfer calculation based on the radiance measurements of the CRCS at Qinghai Lake (Min et al., 2012) or the water temperature measurements of global buoys(Min and Zhang,2014a).Different instruments on LEO spacecraft with similar spectral regions can be compared according to their simultaneous measurements over the same location. This approach is called the SNO inter-calibration method. The on-orbit calibration accuracies of these instruments can be evaluated by using a well-calibrated instrument as reference. In recent years, the China Meteorological Administration(CMA)has established the GSICS (Global Space-based Inter-Calibration System)GEO-LEO and LEO-LEO IR intercomparisons for the FY radiometers with hyperspectral reference IR sounders,AIRS,IASI,and CrIS.The baseline algorithm was developed by the GSICS Research Working Group, except for some specific collocation criteria. Now it has become the main validation method to monitor the on-orbit calibration performance. It also provides a flexible technique to evaluate and correct onorbit calibration bias. It is used to evaluate the on-orbit calibration accuracies of FY-3A&B TIR bands, including their scene temperature-dependence and seasonal variation characteristics. According to the collocated samples, the new nonlinear correction coefficients were re-evaluated to reduce calibration bias (Xu et al., 2014a, b). Long-term monitoring and correction of FY-2 IR channel calibration was conducted based on AIRS and IASI data, where the diurnal variation,seasonal variation and stray light influences were investigated(Hu et al.,2013).
4.2.3. Solar contamination of TIR calibration
The TIR calibration systems are intruded by solar radiation when the polar orbit satellites cross the terminator.This can induce solar contamination and errors in calibration results of FY-3 MERSI/VIRR data(Niu et al.,2015;Xu et al.,2015a).These studies analyzed the temporal and spatial characteristics of solar contamination based on the mid-IR band of FY-3C/VIRR,and also proposed elementary identification and modification methods for solar contamination.Based on these methods,the effects of solar contamination on the calibration coefficient and BB temperature were further evaluated quantitatively. The solar contamination in the Northern Hemisphere always appears between the solar zenith angles from 85?to 118?.The daily mean absolute error of BB temperature reaches 4.5 K, and the maximum absolute error in a day reaches 15 K. According to these studies, this considerable impact on IR band calibration has received much attention and a new baffle has already been designed for FY-3D/MERSI-II.
4.3. C&V for passive microwave instruments
Three passive microwave (PMW) radiometers—namely,the Microwave Temperature Sounder (MWTS), Microwave Humidity Sounder (MWHS),and MWRI—are mounted onboard the FY-3 A/B/C/D satellites. The main tasks of these PMW instruments are to obtain 3D global all-weather temperature and moisture profiles, as well as surface parameters, and to provide initial field information for NWP. The radiance-level data of the FY-3 PMW radiometer is well calibrated in RT by the onboard calibration technology, which has been strictly verified using SNO cross-comparison or ground-based observations (Yang and Shang, 2011; Yang et al.,2012a;You et al.,2013).
4.3.1. RT calibration
A classical two-point calibration system onboard three FY-3 PMW sensors is set up,which is the main on-orbit RT operational calibration method. It includes the processes to convert original counts into microwave radiance by nonlinearity calibration, and antenna correction. It has been noted that the calibration techniques of MWTS and MWHS are almost the same as that of AMSU.However, getting the basic calibration data of the cold space and warm target (onboard BB) views by two reflectors separately, the calibration system of MWRI is prominently different from that of SSM/I or AMSR-E.The nonlinear parameters for FY-3 PMW sensors have been achieved by T/V(thermal-vacuum)testing before launch. In the calibration processes, the variations among space view and warm-target view in the interval of scan lines are generally within the threshold of counts.
The operational on-orbit RT radiometric calibration algorithm of FY-3A/MWHS is already in practice.The real variations between space view and warm-target view in the interval of scan lines are generally within 20 counts.The temperature fluctuation of warm targets is within 0.5 K along a single track.The radiance calibration results of FY-3 MWHS also agree well with those from NOAA-17/AMSU-B. Some previous studies (Gu et al., 2012, 2013) have demonstrated that the BT differences between FY-3/MWHS and NOAA-17/AMSU-B at the same cross overpass points are less than 1.5 K.
In the operational calibration system of FY-3/MWHS,space bias correction has been achieved using cross calibration with NOAA-17/AMSU-B. As a radiance reference,the best-fitted global SNO samples from NOAA-17/AMSUB can be transmitted to FY-3/MWHS,and then a space bias correction can be conducted(Gu et al.,2015a).After the successful launch of FY-3C on 23 December 2013, MWHS-II began its operational application, using a cross-track scanning instrument with 15 channels at frequencies ranging from 89 to 191 GHz.Eight temperature sounding channels have a center frequency at the 118.75 GHz oxygen absorption line,five humidity sounding channels having a center frequency at the 183.31 GHz water vapor absorption line,and there are two window channels at 89 and 150 GHz respectively (Guo et al.,2014a, b).The MWHS-II post-launch instrument performance has been evaluated by monitoring calibration data.Except for band 14, the results show that the BT difference of every channel is less than 1.3 K. The BTs observed by MWHT-II and ATMS have also compared to further demonstrate the largest mean bias of band 14,and the standard deviations of five humidity sounding channels are less than 1 K. Furthermore, the differences between MWHS-II (Zhang et al.,2012)observations and forward RTM simulations, referred to as “O-B”, suggest that the standard deviations of O-B differences for channels 2 to 6 (near the center of the 118.75 GHz oxygen absorption line)are less than 0.5 K.Fortunately, the performances of other channels are similar to those of corresponding ATMS channels. Nevertheless, the scan-dependent biases of MWHS-II channels 1,7–13 and 15 indicate a noticeable temperature dependence of scan biases(Guo et al.,2015).
Meanwhile, FY-3/MWTS has almost the same RT calibration system, but suffers from high-order nonlinearity of FY-3C/MWTS, which cannot be properly calibrated with a traditional method (An et al., 2016). In that paper, a novel method for combining the two-point linear calibration with the cubic equation nonlinear correction was proposed to calibrate the antenna temperature deviation.
4.3.2. Lunar contamination of PMW calibration
The PMW calibration system is intruded by lunar radiation when the polar orbit satellites cross the terminator.This could directly induce lunar contamination and some errors in the calibration systems of MWHS/MWTS. Gu et al.(2015b) analyzed in detail the temporal and spatial characteristics of lunar contamination based on the PMW radiometer of FY-3A/MWHS, and proposed corresponding elementary identification and modification methods.Based on these methods,the effects of lunar contamination on the calibration coefficient and BB temperature were further evaluated quantitatively. As the moon is able to periodically pass through MWHS’s space view in one year, moon-glint events are detectable through the degradation based on the NWP model statistics (Lu et al., 2011a). For example, on 4 July 2010,it was found that more than 1000 abnormal jumps of digital number were induced by a sudden moon-glint event,and a 20 K degradation of BT at the sub-points line of the FY-3A/MWHS 183.31±1 GHz channel was detected. Therefore,a robust correction algorithm was designed based on an approximation scheme of a polynomial model to correct the moon-glint effect(Gu et al.,2015b).
4.3.3. Ascending–descending bias correction for MWRI
FY-3C/MWRI is a total-power radiometer observing the earth surface and atmosphere at 10.65,18.7,23.8,36.5 and 89 GHz with dual polarization. MWRI’s performance is stable during its on-orbit work (Du et al., 2014; Liu et al., 2014a;Wu and Chen, 2016b). Space-based cross calibration in the north/south polar areas,land and sea between FY-3C MWRI and FY-3B MWRI, SSMIS or TMI is performed during onorbit testing, which shows a largest bias of 3.4 K between FY-3C and SSMIS in the sea surface area. However,most of the other biases are within 1 to 2 K.
In 2017, the United Kingdom Meteorological Office(UKMO) reported a slight difference between the ascending and descending orbit of MWRI. Based on the physical temperature measurements of the hot reflector and analyzing the O-B difference results,the effective emissivity of the hot reflector was corrected(Xie et al.,2018).The calibration bias differences induced by calibration anomalies between the ascending and descending passes exist for all channels of MWRI,which seriously affects the data assimilation in the NWP and reanalysis systems. This study (Xie et al., 2018)proposed a physical-based correction algorithm for MWRI calibration based on a five-month observation. The relationship between the observed BT and the physical temperature of the hot load reflector was established to mitigate the intrusion of the emissive hot reflector for all channels in which it was not accurately estimated in the previous calibration process. Before- and after-correction comparisons showed that the ascending and descending bias was effectively removed,i.e., from 2 K before correction to less than 0.1 K after correction,when the emissivity of the hot reflector in the calibration equation was rectified.The change in the mean values of MWRI radiance was negligible.
4.3.4. Validation
Validation and verification of the operational calibration results of the FY-3 PMW sensors has focused on the following aspects: (1) SNO cross-comparisons against the same channels of SNPP/ATMS or GPM/GMI;(2)O-B verification via the RTTOV and CRTM models; and (3) PMW radiance correction field test technology. The FY-3 PMW radiance correction field is located at a rainforest of Puer in Yunnan Province, China. The microwave emissions from this place constitute the ideal BB.Its BT seasonal change is subtle,and the stability near the 1 K microwave high-end calibration target can only be obtained by sliding average processing,coupled with synchronous sounding data for BT correction.The microwave radiance correction on all PMW sensors of FY-3 satellites has been achieved from ascending to descending orbit. It has been confirmed that the FY-3 PMW C&V system is successful, and performs well for FY-3 operational applications from ascending to descending orbit.
5. Retrieval products and data assimilation
After data geolocation and calibration procedures, the level-2 products (the geophysical parameters, i.e., cloud mask, cloud top height, land surface temperature etc.) can be produced from the satellite-observed radiances based on an advanced algorithm. The retrieved level-2 products are widely applied in the fields of disaster monitoring, weather forecasting,nowcasting,data assimilation,global climate and environment change, agriculture and forestry, and so forth(Zhang et al., 2009; Yang et al., 2012b, 2017; Min et al.,2017a).
Besides, it is also well known that direct assimilation of satellite observation radiance data has significantly improved the accuracy of global NWP,especially in the Southern Hemisphere. After the successful launch of FY-3A (the first one of the second-generation FY polar orbit meteorological satellites)in 2008, the NWP community had the opportunity to assimilate the directly observed radiances from the FY-3 satellite program into NWP models to further improve their forecast skill. Five instruments onboard FY-3 are of particular interest to the NWP community—namely,MWTS,MWHS, the High spectral Infrared Atmospheric Sounder(from IRAS to HIRAS), GNOS and MWRI (Wang et al.,2012a;Wang and Zhou,2012).
The close collaboration among the CMA,European Centre for Medium-Range Weather Forecasts (ECMWF) and UKMO advanced the FY-3C data into operational assimilation almost at the same time. Operational assimilations of MWHS-2 with 183 GHz channels globally and GNOS in CMA/GRAPES (Global/Regional Assimilation and Prediction System)were activated in April 2016. FY-3C MWHS-2 was operationally assimilated and monitored in the UKMO global model on 15 March 2016, and in the ECMWF Integrated Forecast System on 4 April 2016.GNOS has also been operationally assimilated by the ECMWF since March 2018(Lu et al.,2011a,b,c,2012;Lu and Bell,2014).
The CMA, ECMWF and UKMO have already operationally assimilated FY-3’s data,proving that they are of good quality for NWP.Besides, the three new instruments on FY-4A,i.e., GIIRS,AGRI and LMI,are of particular interest to the NWP community. Evaluation of the quality of these instruments and their potential to improve forecasts is under way.
5.1. Primary science algorithm of FY retrieval products
We are unable to discuss recent progress with respect to all the science products and algorithms of the FY series satellites in this paper.Instead,we summarize the main geophysical products of the latest three satellites, i.e., FY-2H,FY-3D, and FY-4A. Table 5 lists all the level-2 products of FY-2H/FY-3D/FY-4A.These products can be mainly divided into three categories, including atmospheric, oceanic, and terrestrial products. More than 100 level-2/3 scientific products are routinely generated by the NSMC/CMA operational processing system every day, which can be freely downloaded from the FY meteorological satellite official website (http://satellite.nsmc.org.cn/PortalSite/Default.aspx). In addition, the related progress has already been summarized in several previous review papers (Zhang et al., 2009; Yang et al.,2012b,2017;Min et al.,2017a).Interested readers can find more information on the level-2/3 satellite products from these papers and from the FY meteorological satellite official website.
5.2. Microwave data in global models
Microwave temperature sounders have become the most important instruments for satellite data assimilation because they can penetrate cloud. Assimilation of such data can significantly improve the prediction of temperature and geopotential height profiles. Therefore, investigations into the assimilation of FY-3 satellite data firstly began with the data of FY-3 MWTS.The MWTS instrument has evolved over time to provide more information and more accurate temperature profiles. Starting from MWTS-1 with 4 channels, similar to NOAA/MSU, it has since been upgraded to MWTS-2 with 13 channels,similar to NPP/ATMS.
After correcting the biases from passband shift and nonlinearity, the MWTS instrument has, through evaluation,demonstrated a good level of quality in operational assimilation.After the assimilation of MWTS,it was reported that the forecasts of the CMA GRAPES, ECMWF IFS and UKMO UM systems were improved(Lu et al.,2015;Li et al.,2016).Unfortunately, the MWTS from FY-3A/B/C failed to work subsequently, which prevented it from operational assimilation. However,at present,the FY-3D MWTS is working well and initial evaluation indicates that it is of good quality, and the NWP community is expecting its contributions to operational assimilation.
Microwave humidity sounders can provide information on water vapor and cloud profiles, and thus help to improve the forecasting of humidity profiles and wind vectors over the equator. The MWHS has been much improved too.Starting with the 5-channel MWHS-1, similar to MHS, it was then upgraded to the 15-channel MWHS-2,with eight channels at 118 GHz,which makes this instrument currently the first and only instrument in space of its type.
Using a similar bias correction algorithm as MWTS,MWHS has been well characterized. After long-term monitoring,the FY-3B MWHS-1 was operationally assimilated in September 2014 by the ECMWF (Chen et al., 2015). Since FY-3C,the CMA,ECMWF and UKMO have been close collaborators(Lu et al.,2015;Li et al.,2016),and after a year’s monitoring the MWHS-2 was subsequently assimilated by the CMA,ECMWF and UKMO in 2016.
Occultation detection data have become an anchor of assimilation systems, for almost no observing system error is detected. FY-3 GNOS can simultaneously receive GPS and China Beidou signals, enriching the observational information. By quality control of the level-2 unreasonable information, the GNOS data quality can meet the assimilation requirements. In 2016, CMA GRAPES started assimilating the GNOS-retrieved temperature and humidity proflies operationally,and ECMWF started assimilating the GNOS bending angle operationally in 2018.
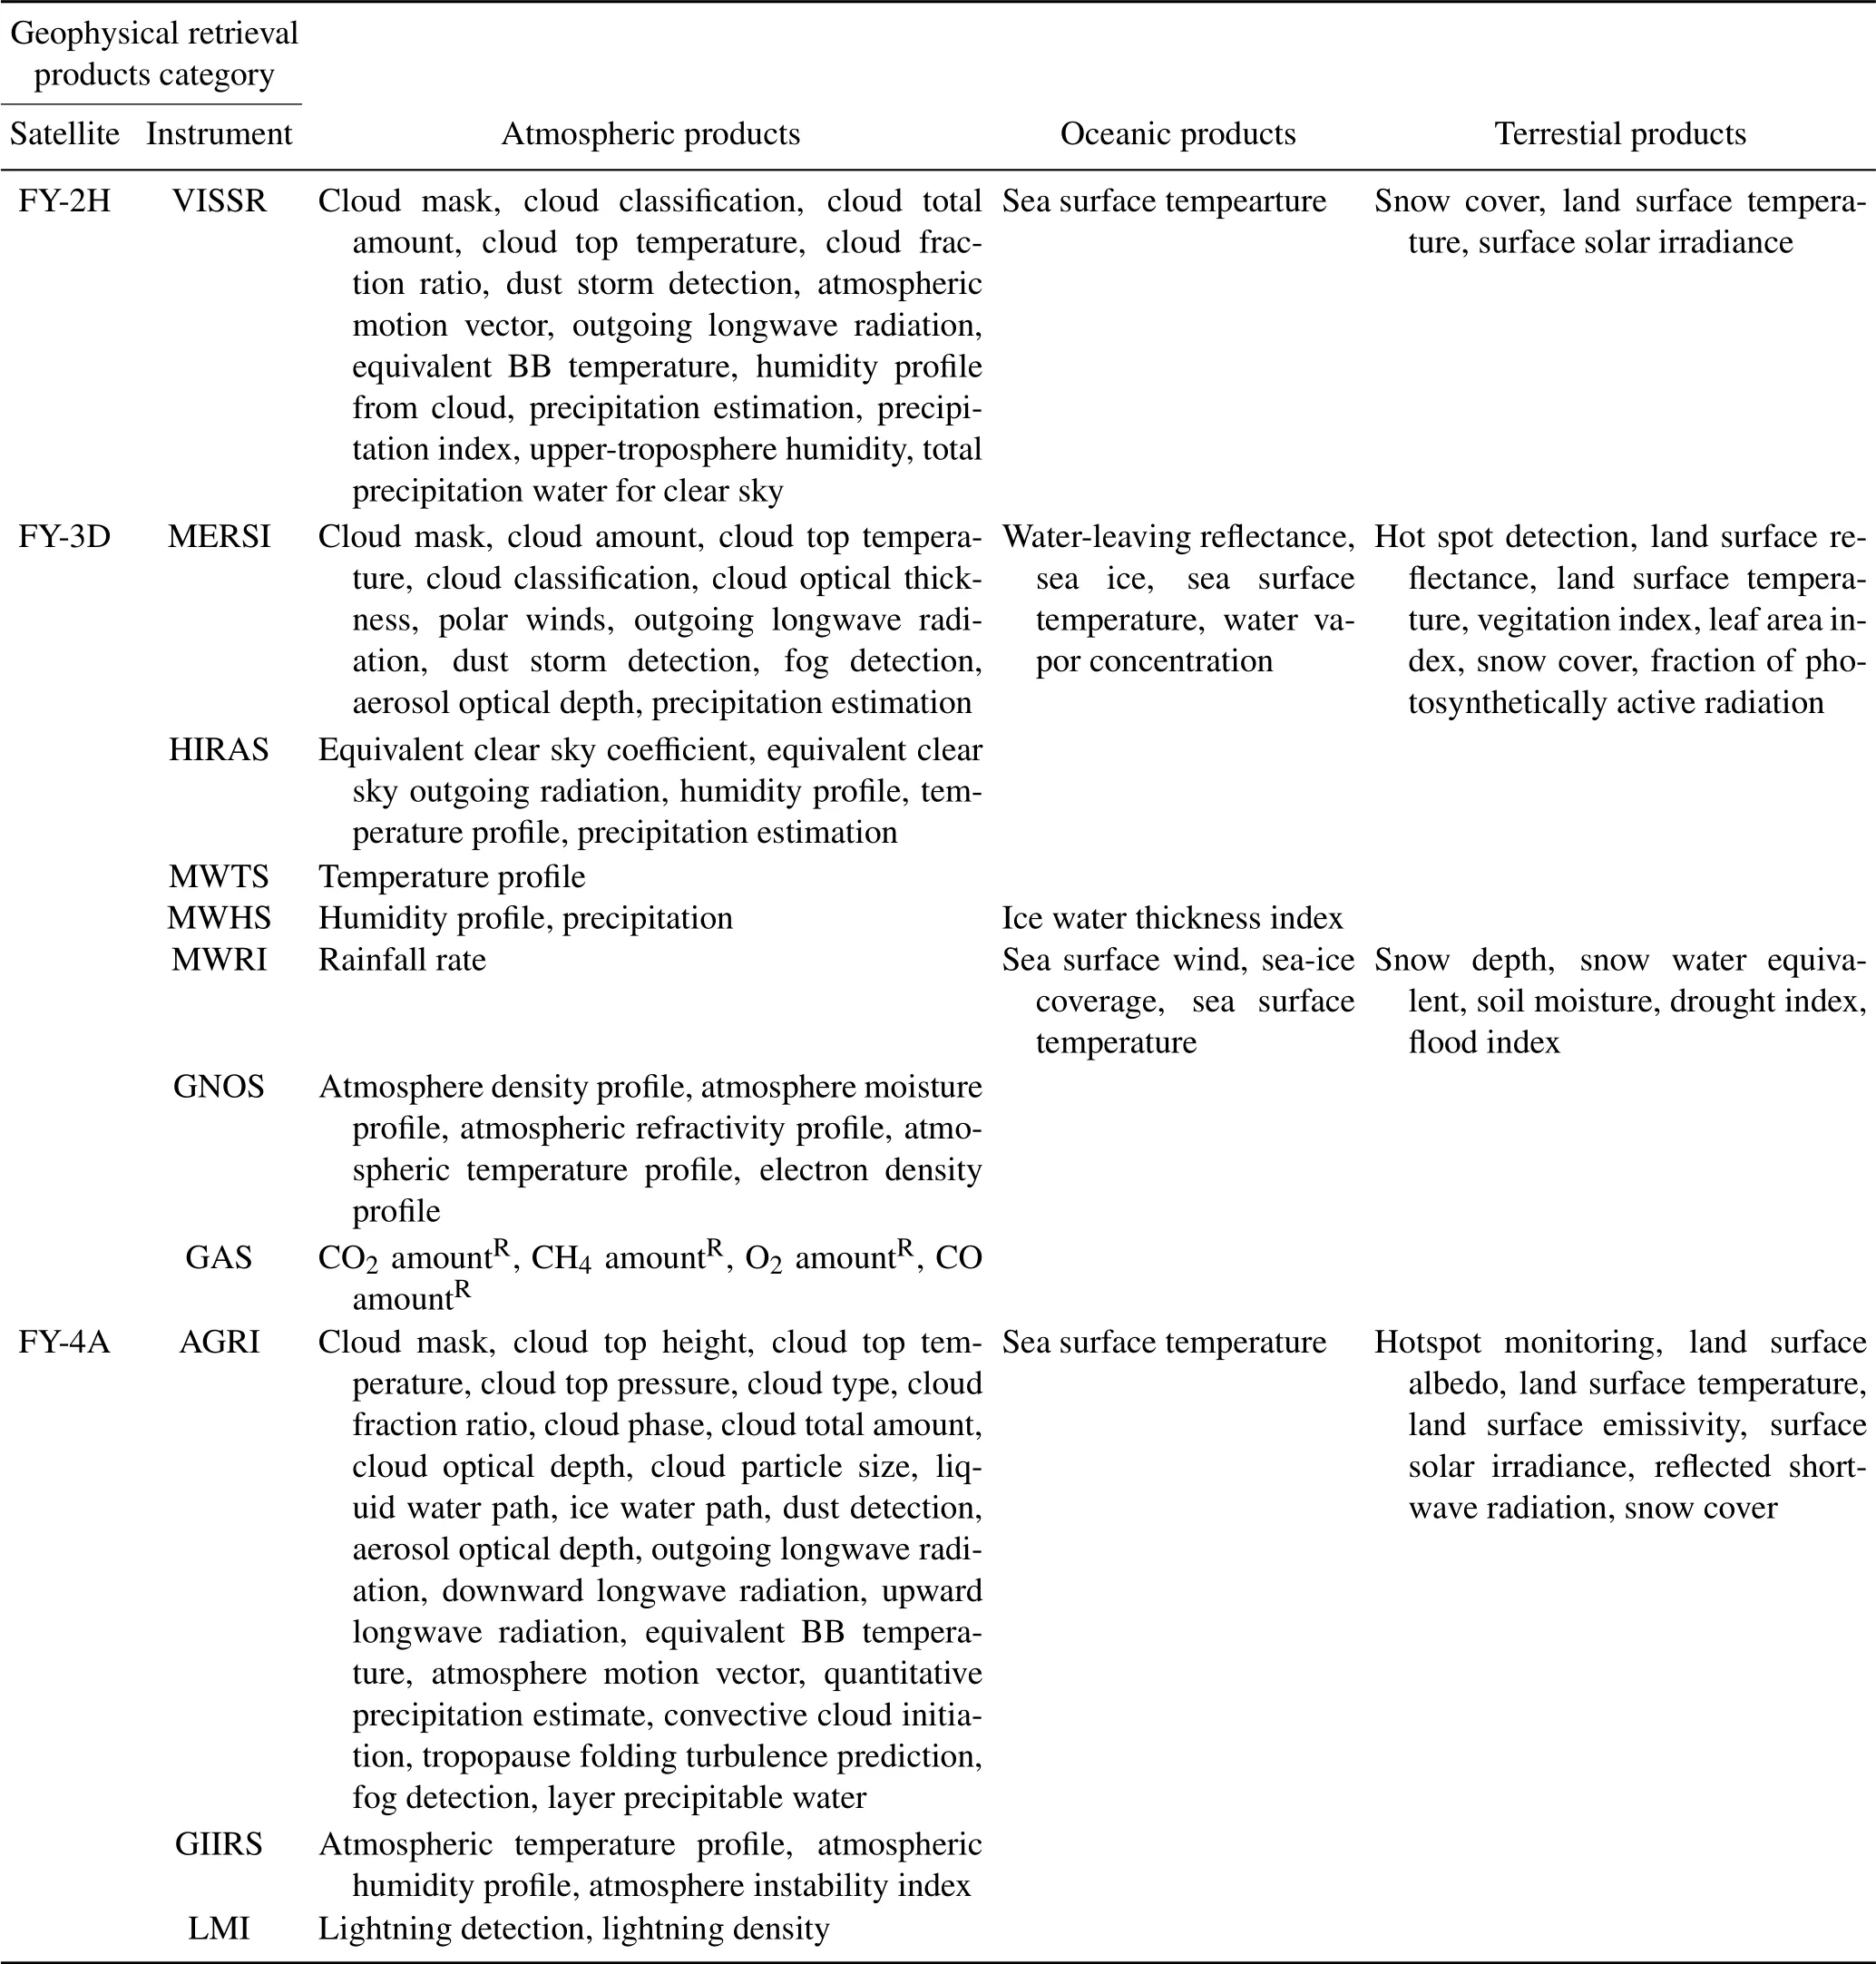
Table 5.Main science products of FY-2H/FY-3D/FY-4A.
5.3. Hyperspectral IR data in global models
Different kinds of international IR sounder data, such as IASI,AIRS,CrIS and HIRS,have been assimilated into NWP systems like those of the UKMO, ECMWF and NCEP, and significant improvements in forecast skill have been demonstrated.
FY-3A/B/C IRAS is operating successfully, and the instrument has been much improved into HIRAS since FY-3D.The IRAS data were evaluated in the CMA GRAPES and ECMWF IFS systems(Lu,2011,Wang et al.,2014a),and the data quality met the assimilation requirements. Ultimately,however,due to the emergence of IR hyperspectral sounders,the IRAS data were not moved into operational assimilation.Nonetheless,they are still important in reanalysis research.
FY-3D HIRAS is the frist IR hyperspectral sounder carried by an FY polar orbit meteorological satellite.It was successfully launched in December 2017.After on-orbit testing,which lasted more than half a year, the spectral and radiometric calibration accuracies of the data reached the assimilation requirement. Currently, the CMA, ECMWF, UKMO are jointly evaluating the data quality.
Successfully launched in December 2016,FY-4A GIIRS is the first IR hyperspectral sounder onboard an FY geostationary meteorological satellite.Preliminary results in the CMA GRAPES global system indicate that the assimilation of GIIRS temperature channels improves the forecasting of temperature and wind profiles over East Asia(Han,2018).
5.4. Imaging data
Microwave imager data,with a strong penetrating ability,is a good indicator of severe weather hydrometers,which can improve the wind vectors over the equatorial region. Similar to AMSR-E,FY-3 MWRI,with 10 channels at 5 frequencies,can provide useful structural information on typhoon and rainstorm systems. FY-3C, the CMA, ECMWF and UKMO jointly evaluated MWRI and agreed that the data are of good accuracy and stability, but the different bias pattern (i.e., OB)from ascending and descending orbits prevented its operational assimilation.In 2017,this bias was systematically investigated.It was found that the reflector emissivity between on-orbit and pre-launch periods could change slightly,which led to the difference between ascending and descending OB.This correction was implemented in the FY-3 MWRI operation preprocessing system. The corrected data are being evaluated by the CMA,ECMWF and UKMO systems.
The high temporal variations of geostationary satellite data reveal the dynamics of weather systems. The assimilation of satellite atmospheric motion vectors (AMVs) retrieved from IR imagers is beneficial to the forecasting skill of NWP models. FY-2 satellite wind data have been evaluated in the CMA, ECMWF and UKMO systems, revealing the data quality of FY-2 AMVs to be comparable to that from Japan’s MTSAT. The assimilation of FY-2E AMVs in the CMA GRAPES model shows that assimilating IR channel AMVs can significantly improve the wind vector analysis at high levels over the Northern Hemisphere,especially over East Asia,and the forecast anomaly correlation coefficient of the 500 hPa height field(Wan et al.,2017).Assimilating water vapor channel AMVs can also improve the forecast(Wan et al.,2017).
The update of GRAPES 4DVAR provides the opportunity to directly assimilate the clear-sky radiance from geostationary satellite water vapor channels with high spatial and temporal resolution. Preliminary assimilation results show that the radiance assimilation from the FY-2G water vapor channel can improve the water vapor analysis over the lowerlatitude ocean area and the tropical wind vector analysis(Wang et al.,2017c).
5.5. Assimilation for regional models
Assimilation of FY-3 microwave data in regional models has improved the initial conditions of typhoon simulations,especially in the absence of conventional observations.It can improve the forecasting of typhoon circulation,the central location and environmental field,and finally the typhoon track(Yang et al., 2013). Cloudy radiance assimilation with the particle scattering effect contributes a more accurate typhoon cloud structure(Dong et al.,2014).
The fusion of FY geostationary satellite data and other observations can produce improved 3D cloud and rain profiles to initiate regional models. The improvement for GRAPES precipitation forecasts by using the improved cloud/rain initial values after data fusion is good (Liu et al.,2014a).The results indicated that the improved initialization with FY geostationary satellite data significantly improved the 0–6 h precipitation forecast and reduced the spin-up in the 0–6 h forecast.
6. RTM for satellite-based quantitative remote sensing
The radiation transfer calculation includes the RTM solver,atmospheric gases absorption calculation,aerosol and cloud particle absorption and scattering calculation, and the parameterization of surface properties.It bridges the link between the earth’s geophysical parameters and the radiance measured by the satellite,which is also very crucial for quantitative remote sensing and climate studies(Min et al.,2014b;Yao et al., 2018). The radiative transfer calculation for FY satellites is very important because the sensor-dependent simulation is the basis of satellite data assimilation and satellitebased quantitative remote sensing(Fig.6).
6.1. RTM solver
The theory of radiative transfer, which studies the physical interactions of solar and terrestrial radiation with molecules,aerosols and cloud particles in the atmosphere,as well as with the surface, is one of the most important tools for satellite remote sensing. In most cases, there is no analytical solution for the radiative transfer equation, and thus some numerical calculation methods must be used.
Recently, to improve the accuracy of radiative transfer parameterization, some new four-stream adding methods were proposed to calculate solar/IR radiative transfer through a vertically inhomogeneous atmosphere with multiple layers (Zhang et al., 2013, 2016). The advantage of the adding method is that it has very high accuracy (with error <1%) as well as computation efficiency. The variation iteration method and double-delta function adjustment have also been applied to deal with IR radiative transfer in an inhomogeneous scattering medium (Zhang et al., 2017a). Besides, a novel linearization RTM enables the calculation of the Jacobians of radiance and polarization with respect to aerosol/cloud/gas/surface parameters of interest.The fast calculation capability of the linearization RTM is very useful for retrieving atmospheric and surface parameters (Wang et al.,2012c,2014b;Xu et al.,2013b).
Both solar reflection and atmospheric emission should be considered when calculating radiative transfer in the middleto-shortwave IR band, which is different from that in the IR band.A new RTM based on the doubling and adding method has been presented to solve the problems in the radiative transfer calculation (Bai et al., 2018). The new model uses approximate calculations of direct solar reflection, multiple scattering, and thermal emissions for a finitely thin atmospheric layer and considers both the solar and thermal sources of radiation.Validation results show that the absolute deviation between the new model and the DISORT model is less than 2×10?6K,with the exception of a few channels.For the same calculation, the computation speed of this new model was approximately two to three times faster than that of the DISORT model.This model is expected to be useful in dealing with the upcoming FY-3 HIRAS data.
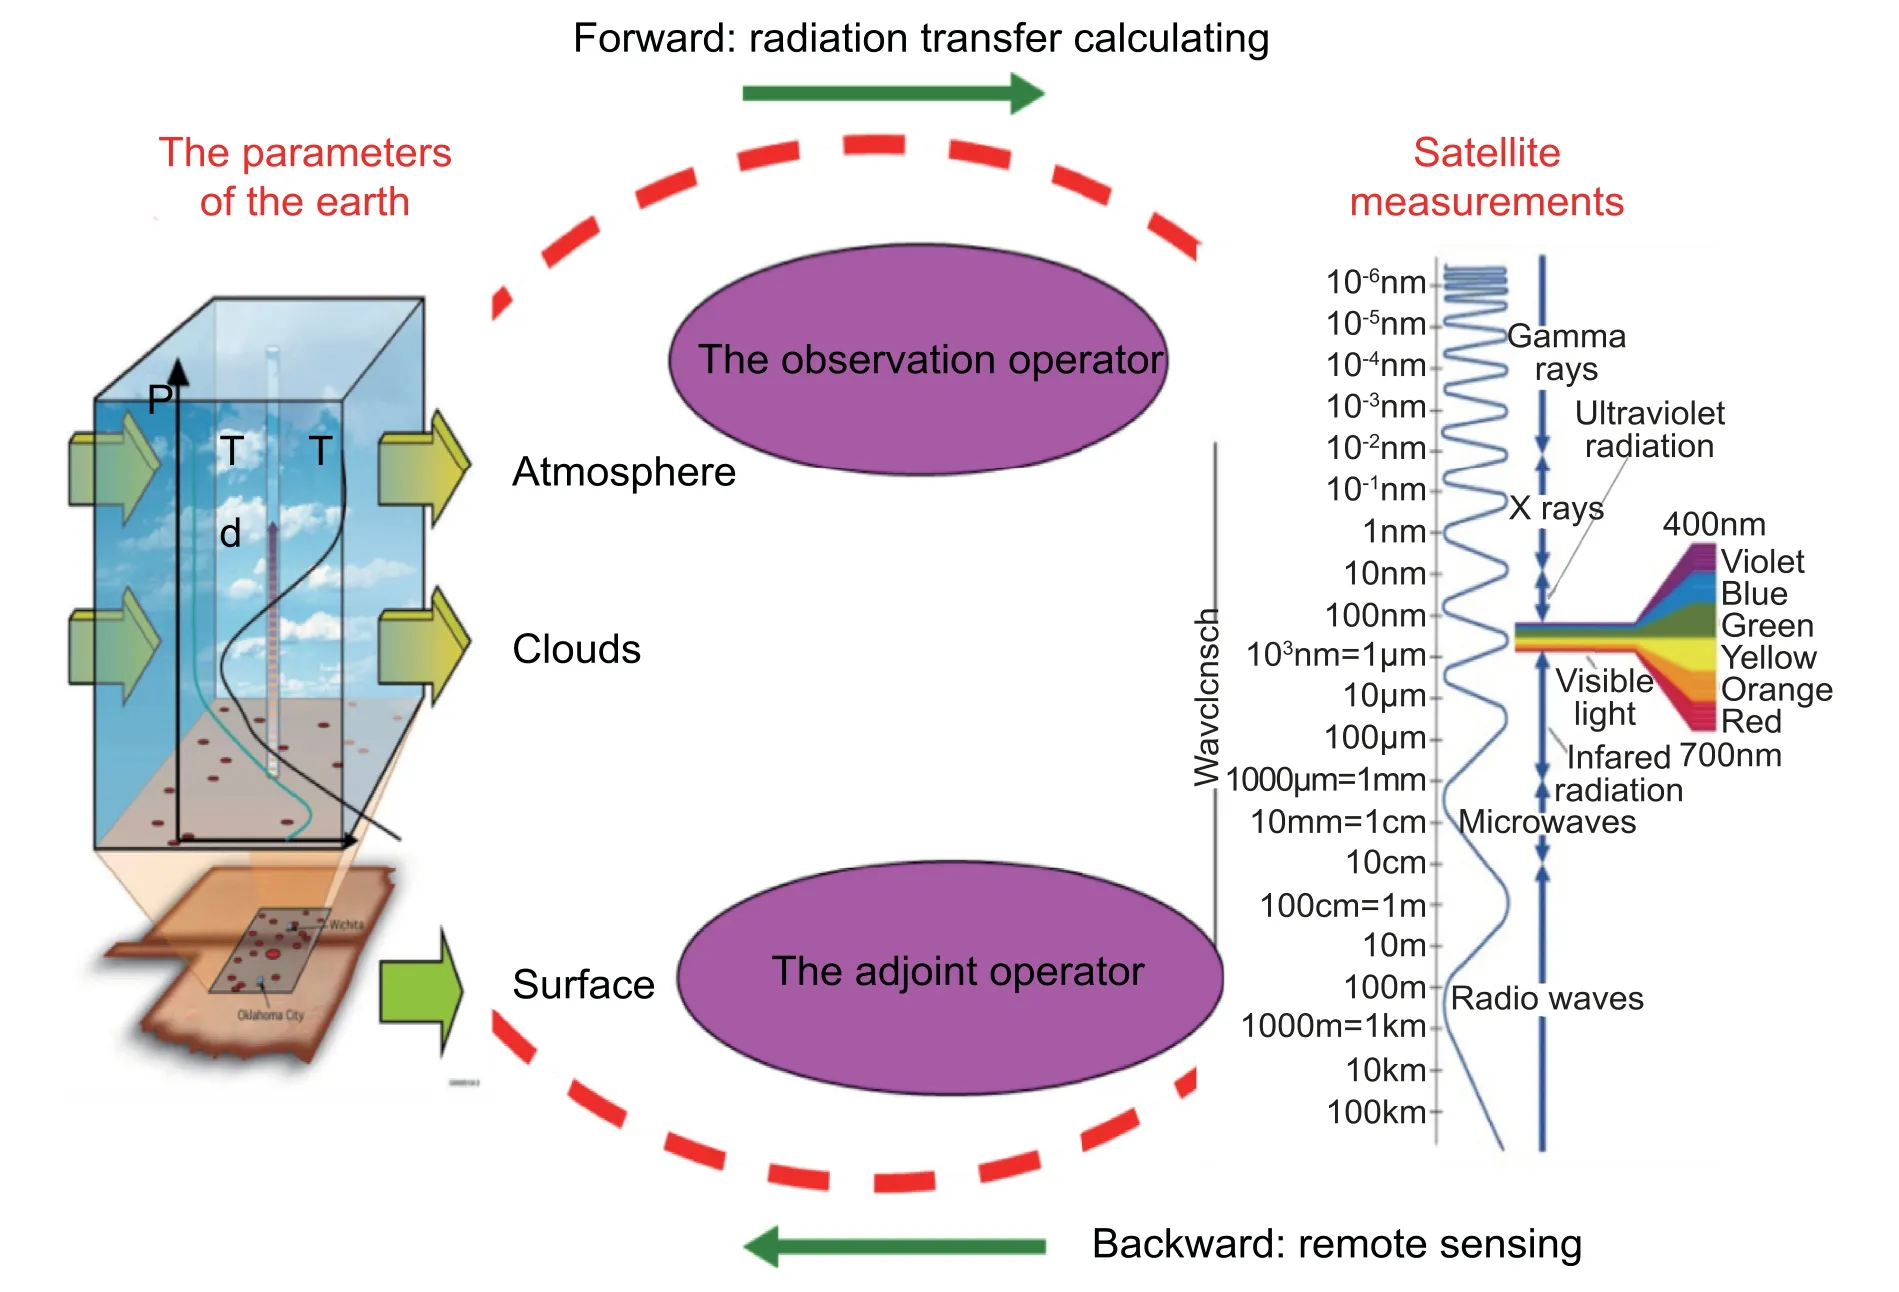
Fig.6.Link between earth’s geophysical parameters and satellite-observed radiance.
The two radiative transfer calculation methods mentioned above are applicable only in a plane parallel atmosphere. There is an ongoing debate about whether this onedimensional approximation is sufficient in radiance simulation, especially in the VIS and near IR bands. A new 3D model, MCRT, based on the Monte Carlo method, has been developed to compute the radiance of a cloudy atmosphere over the sea surface in the VIS and near IR bands (Wang et al.,2012b).Comparison between validation results and other codes shows that this new 3D model can achieve accurate radiance simulation for different sea surface types with a high computing efficiency. This MCRT model is a useful tool to study various 3D radiative effects in complex cloud atmospheres over sea surfaces.
6.2. Gas absorption calculation
The exact line-by-line integration method is accurate in obtaining the gas transmittance spectrum. However, this method is too time-consuming to meet the demands of satellite data RT processing. Using a regression-based transmittance mode for IR and microwave narrow bands is a very effective method that has been applied for over 30 years and has achieved the required computation efficiency.In this method,the band layer transmittance is defined as a convolution of monochromatic transmittance with the sensor’s spectral response function, and it is parameterized and predicted in terms of layer-mean temperature,absorber amount,pressure and viewing angle.The band transmittance is then used in a classical monochromatic radiance transfer equation to simulate the satellite band radiance, thus greatly improving the computational efficiency. Both of the widely used fast radiation transfer models,CRTM and RTTOV(Liu et al.,2013),are based on such a method. They make direct assimilation satellite measurements in NWP models possible. However,the variable spectral effect on path integration in these two models may lead to errors. A new Planck weighted method has been proposed to correct the polychromatic effect(Ma et al.,2014).The validation results show that the standard deviations of BT between line-by-line calculation and fast computation decrease by 25%after applying the Planck weighted correction.
Another widely used fast transmittance calculation method is K-Distribution. For a homogeneous atmosphere,the transmittance within a spectral interval is independent of the value ordering of k (absorption coefficient) with respect to wavenumber, and depends solely on the interval fraction that is closely associated with a particular k value.Hence, wavenumber integration can be replaced by integration of k space,and the channel spectrum transmittance may be derived from an analytic expression. The K-Distribution method stands out in that it can be readily incorporated into scattering models.At present,the K-Distribution method has been successfully used in climate prediction model research.However, for nonhomogeneous atmospheres, correlated approximation must be used,which may lead to large deviations computed by a line-by-line method. It limits the application of this method in satellite remote sensing research.
6.3. Particle scattering calculation
Atmospheric media,such as aerosols and cloud,are able to scatter sunlight directly. This is often used to retrieve the properties of these media from satellite observations. Accurate forward simulation of the optical scattering properties of atmospheric media is essential for quantitative retrieval.Unlike the constant solar spectral irradiance used in traditional satellite remote sensing techniques,lunar spectral irradiances have significant periodicity changes. Min et al. (2017b) revealed a minor effect of cloud bulk scattering properties induced by lunar periodicity changes on satellite day/night band forward simulation.
The polarized optical properties of cloud and aerosol particles play a fundamental role in vector atmospheric radiative transfer and polarized remote sensing studies.It is widely believed that the non-sphericity of aerosols particles can better represent their scattering properties. Furthermore, multiple new models have been developed for different aerosols.Recently, two new irregular concave particles have been developed for dust and bio-aerosols (Liu and Yin, 2016). Numerical models for black carbon aerosols have also been systematically improved,by taking the aggregation structure and internal mixing into account (Liu et al., 2017, 2018). Besides, significant progress has been achieved in developing the T-matrix method with new computational capabilities to investigate the single-scattering properties of non-spherical particles (Bi and Yang, 2014; Bi et al., 2018a, b). With the latest development of the T-matrix method, a new modeling approach based on super-spheroidal aerosol models has been extensively studied to characterize the non-sphericity and inhomogeneity of atmospheric particles for remote sensing applications. For example, Bi et al. (2018a) systematically investigated the depolarization ratios with respect to refractive index and morphology variation in a super-ellipsoidal shape space, which has important implications in polarized LiDAR remote sensing. Bi et al.(2018b)found that the nonsphericity and inhomogeneity of sea salt particles could significantly affect their polarized optical properties,making the accurate representation of sea salt optical properties a necessity in remote sensing applications,particularly for the atmosphere over coastal waters.
7. Conclusion
To date, Chinese FY meteorological satellites have already transited from the first generation to the second generation in both their polar and GEO series.Different from the first-generation satellites,the current FY-3 satellites and FY-4 satellites are loaded with multiple advanced instruments to produce more comprehensive observations of the earth. The spectrum covers the ultraviolet, VIS, near IR, IR, and microwave wavelengths. The instruments cover optical imaging, atmospheric sounding, microwave imaging, hyperspectral trace-gas detection, full-band radiation budget monitoring,and space weather monitoring.
Image navigation can provide each pixel’s latitude and longitude on the earth,which is determined by the payload’s instant location and instant pointing direction. Current FY image navigation can restrict the geolocation accuracy within 1 pixel.It can also reach the angle accuracies of 0.069?for the FY polar satellites at 830 km and 0.00170?for the FY GEO satellites at 35 800 km.
To generate a reliable FY SDR for user communities,extra works on the FY C&V activities should be carried out.These activities should span the whole calibration procedure,including the pre-launch calibration,on-orbit RT calibration,and offline recalibration. Since the radiometric calibration transfer chain is broken after the launch of the satellite, it is hard to make the satellite measurements SI (source irradiance) traceable. The aggregation from different methods,such as CRCS calibration, MS (multisite) calibration, DCC calibration,lunar calibration,and reference instrument intercalibration, can reduce the uncertainty of the satellite measurements effectively. Currently, the average accuracies of the calibrated FY satellite data are about 7%,0.5 K and 1 K for RSBs, TIR bands and PMW sensors respectively. Compared with the FY SDR,the retrospective recalibration of historical satellite data to generate the FY fundamental climate data record is still limited.
The microwave and IR sounding data of the FY satellites have been assimilated operationally into the ECMWF,UKMO NWP and Chinese GRAPES models. The hyperspectral IR sounding data and imaging data of the FY satellites have also been investigated. FY RTM is indispensable for supporting satellite data assimilation and satellite-based quantitative remote sensing, since simulations for satellite observations are sensor-dependent.Further activities and development on FY RTM should be encouraged in the future.
China has become one of few countries that maintain polar and GEO meteorological satellites operationally.With the associated open data policy and stable and accurate measurements, the FY satellites are becoming an important component of the space-based global observing system. FY satellite data delivery services support direct broadcasting users,CMACAST users, and web portal users. Web portal users can obtain the data through an FTP push service, FTP pull service, or manual service. Users can access the data online(http://satellite.nsmc.org.cn/portalsite/default.aspx) after a quick and free-of-charge registration process.
Acknowledgements.The authors sincerely appreciate the efforts of all of the contributors to this investigation and the cordial invitation from Profs.Daren LU and Jianchun BIAN.The authors also thank Chengli QI,Chunqiang WU,Yang GUO and Zhiwei WANG for their efforts with providing high-quality figures. This work was funded by the National Key R&D Program of China (Grant Nos.2018YFB0504900 and 2015AA123700). Last but not least, we would also like to thank the two anonymous reviewers and editor for their thoughtful and constructive suggestions and comments.
 Advances in Atmospheric Sciences2019年9期
- Advances in Atmospheric Sciences的其它文章
- Recent Progress of Aerosol Light-scattering Enhancement Factor Studies in China
- A Review of Atmospheric Electricity Research in China from 2011 to 2018
- Interannual and Decadal Changes in Tropospheric Ozone in China and the Associated Chemistry–Climate Interactions: A Review
- Recent Progress in Dual-Polarization Radar Research and Applications in China
- Recent Progress in Numerical Atmospheric Modeling in China
- Progress in Semi-arid Climate Change Studies in China
