The Effect of Compressibility in Computing Noise Which Induced at a Cavitating Device
Amir.Bashirzad eh Tabrizi Bin-x in Wu
(Research Center of Fluid Machinery Engineering and Technology,Jiangsu University,China)
Abstract:Noise prediction can be simplified by application of hybrid approach.The computational fluid dynamics calculation can be accomplished by solving either compressible or incompressible Navier- Stokes equations to determine the flow-field variables of the noise source.The proper assumption depends on both the physical situation and the Mach number.Although,in cavitating devices such as a cavitating orifice usually we are dealing with low Mach number flow but cavitation is an acoustic phenomenon and can be affected by compressibility.In this study,the role of compressibility in computing noise generated at a cavitating single-hole orifice was investigated using large eddy simulation(LES)and Ffowcs Williams-Hawkings(FW-H)formulation.The results of this work demonstrate that the compressibility has a significant role in terms of computing noise generated at a cavitating orifice and cannot be ignored,especially when the noise generated by developed cavitation regimes at low frequencies is investigated.
Key Words:Orifice,LES,Compressible Simulation,Noise,Developed Cavitation,Super Cavitation
Nomenclature
c0Sound propagation speed,far-field sound speed,m/s
p Pressure,Pa
ρDensity,kg/m3
uiFluid velocity component in xidirection,m/s
unFluid velocity component normal to the surface,m/s
viSurface velocity component in xidirection,m/s
vnSurface velocity component normal to the surface,m/s
δ(f)Dirac delta function,dimensionless
H(f)Heaviside function,dimensionless
p'Sound pressure at the far field,Pa
niUnit normal vector pointing toward the exterior region(f>0),dimensionless
TijLighthill stress tensor,Pa
pijCompressive stress tensor,Pa
σCavitation Number,dimensionless
f Frequency,Hz
d Diameter of the single-hole orifice,m
t Orifice thickness,m
D Pipe diameter,m
tpPipe wall thickness,m
y+Dimensionless wall distance,dimensionless
1 Introduction
Computational methods for flow-generated sound can be divided into two broad categories: direct computation and hybrid computation. In the first case the noise is defined together with the fluid dynamic field by solving the flow equations directly and the numerical scheme is dictated by the required assessment of the different flow scales. In the direct approach, the sound together with its fluid dynamic source field is computed by solving the compressible flow equations. Theoretically, a direct numerical simulation (DNS)which resolves all flow scales would be the best choice, but the present computational resources do not allow deploying such a simulation for every case. Large Eddy Simulation(LES), which resolves only the dynamically important flow scales while modelling the effects of smaller scales, can be applied. It is also possible to use unsteady Reynolds-averaged Navier-Stokes (RANS) methods to compute the noise generated by the largest flow features“Ianniello et al.(2013)[1],”“Wang et al.(2006)[2],”. The development and the application range of these alternative methods such as LES and RANS still represent a research issue“Ianniello et al. (2013)[1]”.Applying the direct approach in terms of sound computation requires the solution of the compressible flow equations;sound is determined as a pressure fluctuation propagating in a medium at a finite speed and as it is under the isentropic flow hypothesis, and sound propagation speed c0is specified by (c0=d p/dρ).As a result, the incompressibility assumption(dρ=0)prevents any propagation phenomena(c0becomes infinite) and is not physically compatible with any acoustic analysis“Ianniello et al.(2013)[1]”.
In the hybrid approach, the computation of sound is decoupled from the computation of flow.The far-field sound is calculated by integral or numerical solutions of acoustic analogy equations applying computed source field data“Ffowcs Williams and Hawkings (1969)[3]”,“Wang et al. (2006)[2]”.The one-way coupling of flow and sound is a principal assumption of acoustic analogy-based prediction i.e., the unsteady flow induces sound and modifies its propagation, but the sound waves do not affect the flow in any significant way“Ianniello et al.(2013)[1]”.
The noise prediction can be simplified by applying the hybrid approach. The Computational Fluid Dynamics (CFD)calculation can be accomplished by solving either compressible or incompressible Navier-Stokes equations. The proper assumption depends on both the physical situation and the Mach number. Specially, an incompressible simulation can be adequate to provide the solver with all the requested input data if no compressibility affects the acoustic phenomena.For example in air, the incidence of a shock wave related to a transonic/supersonic range of the blade speed is the only compressibility effect that can affect the noise generated by a propeller. Therefore, at a low rotational Mach number, the prediction of the fundamental loading noise component is successfully performed by using the unsteady air load distributions provided by an incompressible aerodynamic code“Ianniello et al. (2013)[1]”“Liu (2012)[4]”. At low Mach numbers, incompressible flow solutions can be suitable for computing acoustic source terms“Wang et al. (2006)[2]”.Layton and Novotny have mentioned that the direct approach are often costly, unstable, inefficient and unreliable for flows in the low Mach number regimes (below 0.3 according to Wilcox)“Layton and Novotny (2010)[5]”“Wilcox(2007)[6]”.At low Mach numbers,using incompressible models is an efficient way to improve the simulation. Wang et al. derived that incompressible flow solutions are sometimes adequate at low Mach numbers but there is no agreed Mach number threshold for CFD solutions in terms of identifying aero-acoustic sources“Wang et al.(2006)[2]”.
For all cases where the incompressible Navier-Stokes equations were used for the source-flow simulations by previous researchers, the Mach numbers are low.Also, since water practically behaves as an incompressible fluid, it is worth pointing out that for a hydrodynamic simulation of marine and/or maritime problems always incompressibility assumption is applied and the assumption[dρ=0]results in a notable simplification of both the governing equations and the corresponding numerical schemes“Ianniello et al. (2013)[1]”. In cavitating devices such as a cavitating orifice usually we are dealing with a low Mach number flow but cavitation is an acoustic phenomenon and can be affected by compressibility.An example of this effect is the collapse of vapour bubbles in a cavitating flow. In addition, cavitation behaves acoustically as a monopole and it is mentioned by some researchers that an incompressible solution is sufficient to study the dipole sources. However, in order to study the monopole (and quadrupole)sources a compressible solution may be required“Bistafa et al.(1989)[7]”“Ianniello et al.(2013)[1]”“Olivares(2009)[8]”.source and radiates sound equally in all directions.In aeroacoustics,monopoles are normally generated by a pulsating flow“Liu (2012)[4]”. Therefore, an incompressibility assumption in terms of source-flow simulation for hybrid computation of generated sound by a cavitating flow is doubtful. Although an incompressibility assumption results in a notable simplification of both the governing equations and the corresponding numerical schemes, the effect of this assumption on the accuracy of the predicted noise by the hybrid computation method for cavitating flow cases should be investigated further. Several researchers applied compressible CFD simulations to study cavitating flow or noise generated by cavitating flow with a hybrid aero-acoustic computation.
In this study, the role of compressibility in computing of generated noise at a cavitating single-hole orifice has been investigated by using CFD and FW-H formulation.The fluid zone downstream of the orifice where the cavitation occurs is evaluated as the acoustic source which generates sound.Time-accurate solutions of the flow-field variables, such as pressure and velocity components on source surfaces,are obtained from both compressible and incompressible LES.Two cases of cavitation are investigated and the sound pressure signals far downstream of the orifice are computed by applying the FW-H formulation.Then the sound pressure levels far downstream of the orifice are presented. For each case, the acoustic results predicted by FW-H formulation based on both compressible and incompressible simulations for source-flow are compared to investigate the effect of compressibility in computing the generated noise.
2 Theory
The FW-H formulation extracts the most general form of Lighthill’s acoustic analogy, and is able to predict sound generated by equivalent acoustic sources like monopoles, dipoles, and quadrupoles“Ffowcs Williams and Hawkings(1969)[3]”. The FW-H equation that can be derived by manipulating the continuity equation and the Navier- Stokes equations is an inhomogeneous wave equation. The FW-H equation can be written in the following format“ANSYSFLUENT (2017) [9]”“Ffowcs Williams and Hawkings(1969)[3]”:

p' represents the sound pressure at the far field( p'=p-p0). The surface ( f=0) corresponds to the source(emission) surface which can be a body (impermeable) surface or a permeable surface off the body surface. Tijis the Lighthill stress tensor and determined as:

Pijis the compressive stress tensor and for a Stokesian fluid can be defined given by

By assuming a free-space flow and the absence of obstacles between the sound sources and the receivers,Equation 1 can be integrated analytically and the complete solution includes both surface integrals and volume integrals.While the surface integrals indicate contributions from monopole, dipole and partially quadrupole acoustic sources, the volume integrals represent quadrupole sources from the region outside the source surface.
3 Model Geometry and Water Characteristics
In this study a single-hole orifice that was previously investigated experimentally by Testud et al(2017)[10].in terms of noise generated by cavitating flow, has been modelled”Testud et al.(2007)[10]”.The flow characteristics of the transient regime downstream of the orifice as the sound source were computed by using CFD and far-field noise prediction based on the FW-H formulation. The geometry characteristics of the orifice are as follows:
It is a single-hole, circular, centered orifice, with right angles and sharp edges.Its thickness(t)is 0.014m and its diameter (d) is 0.022m. The orifice is located inside of a hydraulically smooth steel pipe of 0.074m inner diameter (D)and 0.008m wall thickness(tp).Since,the orifice is defined as a“thin”orifice.
The length of the pipe is included in the CFD model to find time-accurate solutions of the flow-field variables on source surfaces (fluid zone downstream of the orifices). The pipe length is 5D upstream of the orifices and 15D downstream of the orifices. The water characteristics applied in this study are shown in Table 1:
4 Numerical Procedures
4.1 Mathematical Models,Mesh and Unsteady Simulation Parameters
Three-dimensional, Navier-Stokes equations are solved for compressible and incompressible flow. The LES approach is applied to simulate the unsteady large scale structures and separation zones. In LES, large eddies are solved directly,and small eddies are simulated with a sub-grid scale model.A main function of the small eddies is to dissipate the turbulent energy which is transferred from the larger scales to the smaller scales by the energy cascade“ANSYS-FLUENT (2017)[9]”. In the LES method, low-pass spatial filtering of the governing equations is deployed to achieve the separation between the resolved and unresolved scales.The subgrid-scale stresses which result from the filtering operation are uncertain, and need to be modelled“Meneveau and Katz(2000)[11]”.LES is the most appropriate approach for acoustic applications. The approach is a compromise solution between DNS and RANS.All scales are numerically solved in DNS, while in RANS, all scales are modelled. In LES, the transport equations are filtered, only larger eddies are resolved, and the smaller eddies modelled. Therefore, LES is an efficient method of achieving good results in turbulent flows ”Chung (2002)[12]”.As LES requires that only larger eddies resolve,coarser mesh and a larger time step can be applied compared to DNS, but still a much finer mesh is needed compared to other turbulent models. LES has to run for a long flow-time to obtain statistics so the flow can be modelled and achieve good results. As a result, computational costs in terms of RAM and CPU are higher than RANS models and high-performance computing is required ”O(jiān)livares(2009)[8]”.
In this case, Adapting Local Eddy-Viscosity (WALE)model is used. 0.5 is the published value for the WALE constant(Cw) but validation during a European Union research project has presented consistently superior results in ANSYS Fluent with Cw=0.325,and therefore this value is used as the default setting. The WALE model is designed to provide the correct wall asymptotic behaviour for wall bounded flows.In addition, the WALE model provides a zero turbulent viscosity for laminar shear flows and allows the correct treatment of laminar zones in the domain“ANSYS-FLUENT(2017)[9]”.
Schnerr and Sauer model is utilized to include cavitation effects in two-phase flows while the mixture model is applied“Sauer and Schnerr (2001)[13]”“Schnerr and Sauer(2001)[14]”. Water-liquid and water-vapour are used as primary phase material and secondary phase material, respectively. In compressible simulation, the ideal gas equation of state is applied for the vapor domain and Tait’s equation of state is deployed for the liquid domain”Hickel(2015)[15]”.
The frequency domain approach of FW-H formulation which is applicable to the computed domain is used as the governing equation for the noise prediction far downstream of the orifices.
The ANSYS-FLUENT software with parallel processing, version 16.1, is utilized to solve the filtered governing equations that are discretized by the finite volume method.The“SIMPLE”scheme is used for pressure-velocity coupling. For the momentum spatial discretization,“Bounded Central Differencing”scheme is applied and“Least Squares Cell Based” scheme, “PRESTO!” scheme, “QUICK”scheme and“Second Order Upwind”scheme are used for gradient spatial discretization, pressure spatial discretization,volume fraction and density spatial discretization,respectively. The“Bounded Second Order Implicit”formulation is deployed for the temporal discretization“ANSYS-FLUENT(2017)[9]”.
When meshing the computational domain, the multiblock structured hexahedral mesh created by ANSYS Meshing tools is used. The mesh is refined at the walls to capture the boundary layer. The grid is concentrated near the walls and the measured y+ is around 1.As the grid moves further away from the walls, it is enlarged by an expansion ratio of 1.2:1. The initial instability of the shear layer controls the aero-acoustic interaction,therefore the resolution close to the edge can be a crucial parameter and the mesh is refined around the orifice“Hofmans et al. (2001)[16]”. In the radial direction, the grid size is refined as well at the orifice wall and in the area of the jet downstream of the orifice. Table 2 shows the features of the computational grids.This choice of the grid size guaranteed grid-independent simulations.
High grid resolution with enough small time steps is ap-plied to resolve the relevant fluctuations.The unsteady calculations are performed with a time-step size of 5×10⁻⁵s. This time-step is sufficient to keep the Courant number less than one for the majority of computational cells and accurately resolve pressure spectra within human hearing range. Unsteady simulation parameters are listed in Table 3.The simulations are run by using 30 cores(Intel?Xeon?Processor E5-2640). At each case, the transient solution is run for 1000 time steps before enabling the acoustics model to obtain a statistically steady-state solution. After the unsteady flow field under consideration has become fully developed, the FW-H acoustics model is enabled and acoustic source data is exported for 0.05s flow time(1 000 time steps).

Tab.2 Features of the Computational Grids
4.2 Boundary and Initial Conditions
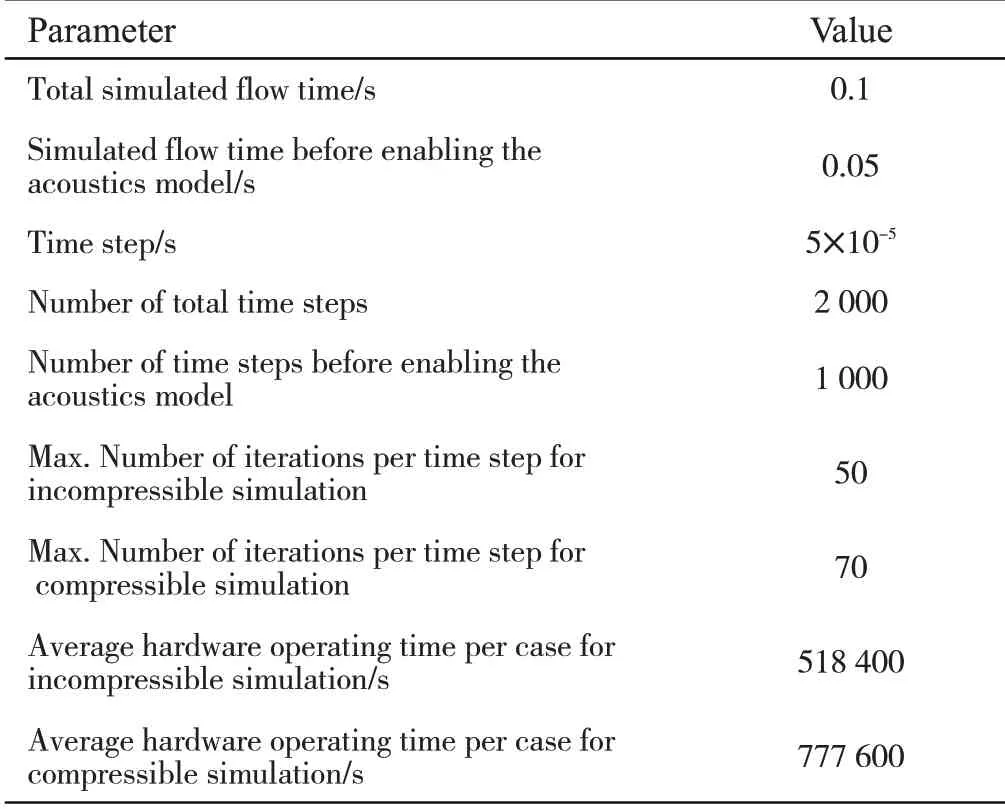
Tab.3 Unsteady Simulation Parameters
The mass flow inlet boundary condition with pressure is employed at the inlet of the pipe and a pressure outlet boundary condition is applied at the domain outlet. To simulate different cavitation cases,values of the inlet mass flow rate and outlet pressure at different cases was calculated based on the values presented by Testud et al. resulting from their experiments for different cavitation numbers“Testud et al. (2007)[10]”. The converged steady-state results are applied as initial conditions for unsteady simulation.
5 Results and Discussion
In this section the simulated results for the developed cavitation conditions(σ=0.41)and the super cavitation condition(σ=0.15)for both compressible and incompressible simulations are presented and analysed.
Figure 1 and 2,show visualization of the developed and super cavitation regimes respectively for a single-hole orifice from other experiments at EDF R&D“Archer et al. (2002)[17]”. For the developed cavitation regime white bubble clouds are observed around the jet which formed at the orifice. In the super cavitation condition, vapor pockets are formed in the jet region and expand downstream of the orifice.
Figure 3 shows the vapor volume fraction at different flow times downstream of the single-hole orifice for the developed cavitation condition (σ=0.41) from both compressible and incompressible simulations. The results of both methods show that similar to the experimental visualization(Figure 1), the bubbles are formed around the jet at the orifice. However, the incompressible simulation shows lots of vapor pockets downstream of the orifice while the compressible simulation shows that just a few bubbles form downstream of the orifice.Compared to the visualization of the developed cavitation regime from the experiment (Figure 1), it appears that the incompressible simulation over estimates the quantity of bubbles which form downstream of the orifice and the compressible simulation provides more similarity to the visualizations.
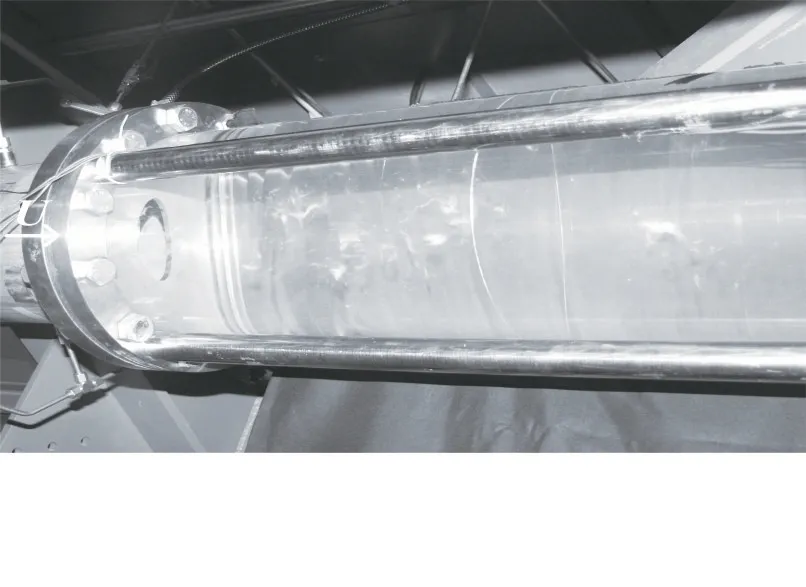
Fig.1 Visualization of the developed cavitation regime for a single-hole orifice (d/D=0.30, t/d=0.10, D=2.66×10- 1m) with σ=0.49 and u=1.5 m/s (ΔP=3.1×10⁵Pa, P1=4.6×10⁵Pa) from other experiments at EDF R&D“Archer et al.(2002)[17]”

Fig.2 Visualization of the super cavitation regime for a singlehole orifice from other experiments at edf r&d "archer et al.(2002)[17]"
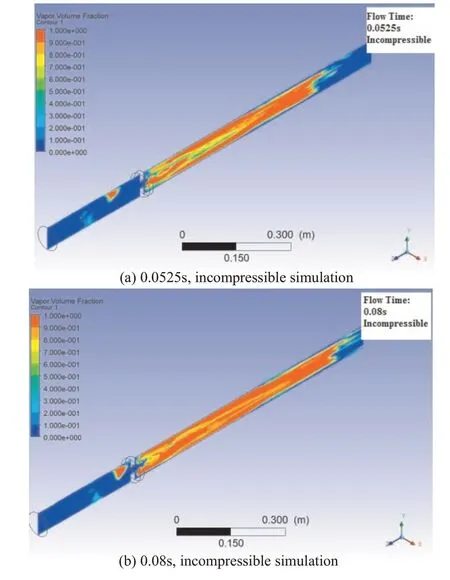
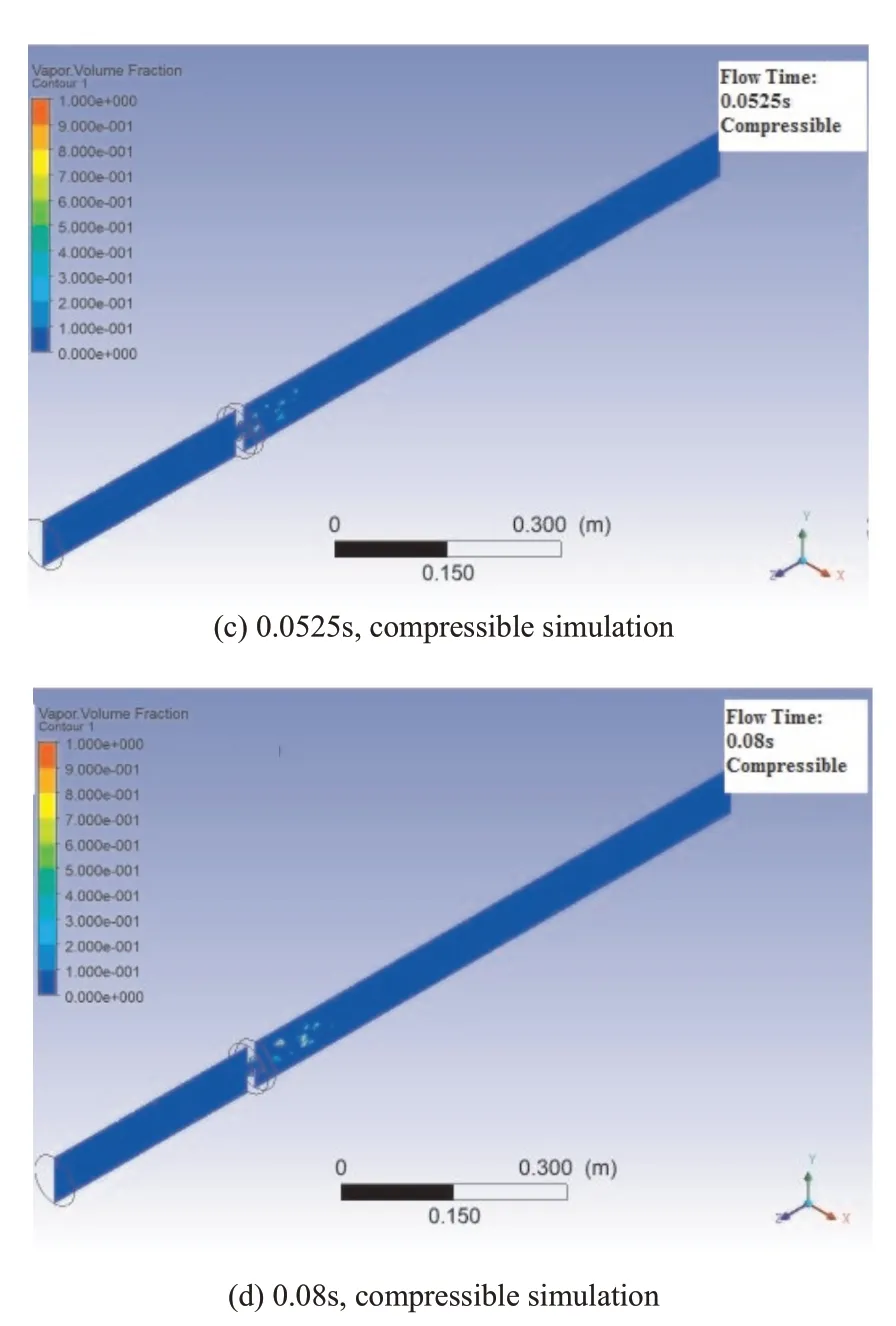
Fig.3 Vapor volume fraction at different flow times downstream of the single- hole orifice for developed cavitation condition(σ=0.41)

Fig.4 close up view showing vapor volume fraction at 0.08s flow time downstream of the single-hole orifice for developed cavitation condition (σ=0.41) resulting from compressible simulation
Figure 5 shows the vapor volume fraction at different flow times downstream of the single-hole orifice for the super cavitation condition (σ=0.15) from both compressible and incompressible simulations. The results of both methods show that the vapor pockets mainly form in the jet region and expand downstream of the orifice. For the incompressible simulation the vapor volume fraction is around 1 in the majority of areas downstream of the orifice while the compressible simulation predicts fewer bubbles downstream of the orifice. However, comparison between Figure 2 and 5 clarifies that the predicted results by the compressible simulation are more similar to the visualization of the super cavitation regime captured in the experiment.
Figure 6 shows the sound pressure levels at 28D and 280D downstream of the single-hole orifice for both compressible and incompressible simulations for the developed cavitation regime with σ=0.41.The graphs of the sound pressure levels from different simulation methods have a totally different trend for both distances downstream of the orifice.The average values of the sound pressure level computed by compressible simulation are fairly steady at a frequency range between 400~2 500Hz and starts to decrease at frequencies greater than 2 500Hz. The compressible simulation shows that at 384 Hz the sound pressure level has it’s maximum value.The computed results by the incompressible simulation show that the values of the sound pressure level increase from a low frequency to meet it’s maximum value at a frequency range between 2 000~2 150Hz and then the average value of the sound pressure level almost is fairly constant.
At low frequencies there is a large discrepancy between the computed values of sound pressure level from compressible and incompressible simulations.Although,the computed values of both simulation methods are not close for all frequencies less than 7 kHz, there is a big difference between the values from both methods at frequencies less than 2 kHz.This discrepancy is around 55 dB at 400 Hz.At a frequency range greater than 7 kHz, both simulation methods provide almost the same values for sound pressure levels. It is notable that the results of the different simulation methods are different in the frequency range which human hearing is more sensitive to sound(2~4 kHz).
Figure 7 shows the sound pressure levels at 28D and 280D downstream of the single-hole orifice for both compressible and incompressible simulations for the super cavitation regime with σ=0.15.The graphs from both compressible and incompressible simulations show the same trend at both distances downstream of the orifice. In low frequencies (below 700 Hz) there are few peaks and troughs and generally the sound pressure levels increases very slowly. The values of sound pressure level start to increase rapidly around 700 Hz and reach their maximum peak around 2 500Hz. More peaks and troughs can be observed at this range (1 kHz to 2.5 kHz). After meeting their maximum values around 2.5 kHz, the sound pressure levels decrease. However, for both distances downstream of the orifice the compressible simulation shows the maximum sound pressure level at 2 470Hz while the maximum sound pressure level is at 2 360Hz for the incompressible simulation.
It can be concluded from the graphs that in low frequencies less than 1 000Hz, the discrepancy between calculated sound pressure levels, by using compressible and incompressible simulations is almost 1.5 times compared to the discrepancy between calculated values at frequencies greater than 1 000Hz. While for the low frequencies, the discrepancy between resulted values from compressible and incompressible simulations is around 15 dB,this discrepancy is decreased to almost 10 dB in higher frequencies. This may be due to a lower ability of the incompressible simulation to predict the bubbles which create and collapse at lower frequencies. It is notable that in the range which human hearing is more sensitive to sounds, the calculated sound pressure levels by using compressible and incompressible simulations have less of a discrepancy and both methods provide similar results.
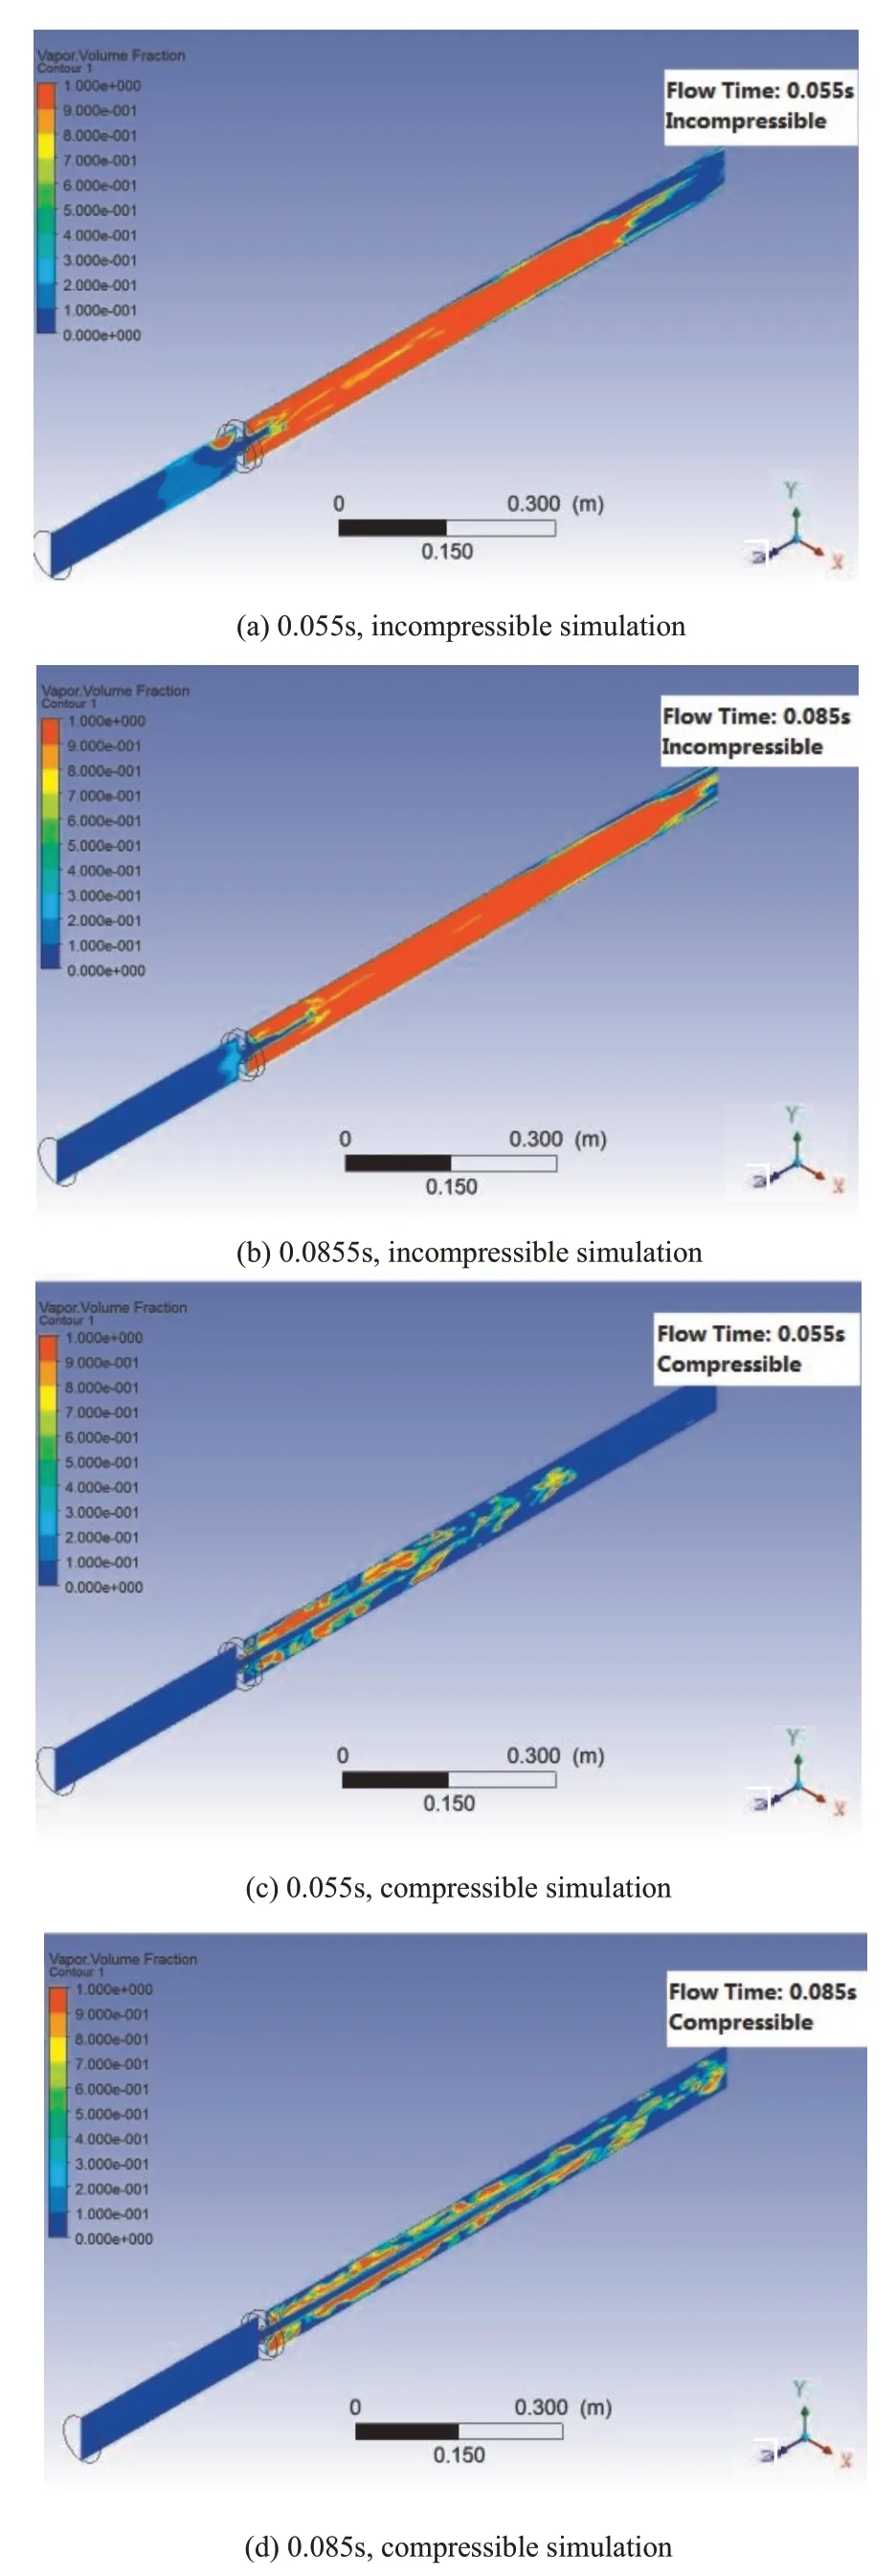
Fig.5 Vapor volume fraction at different flow times downstream of the single-hole orifice for the super cavitation condition(σ=0.15)
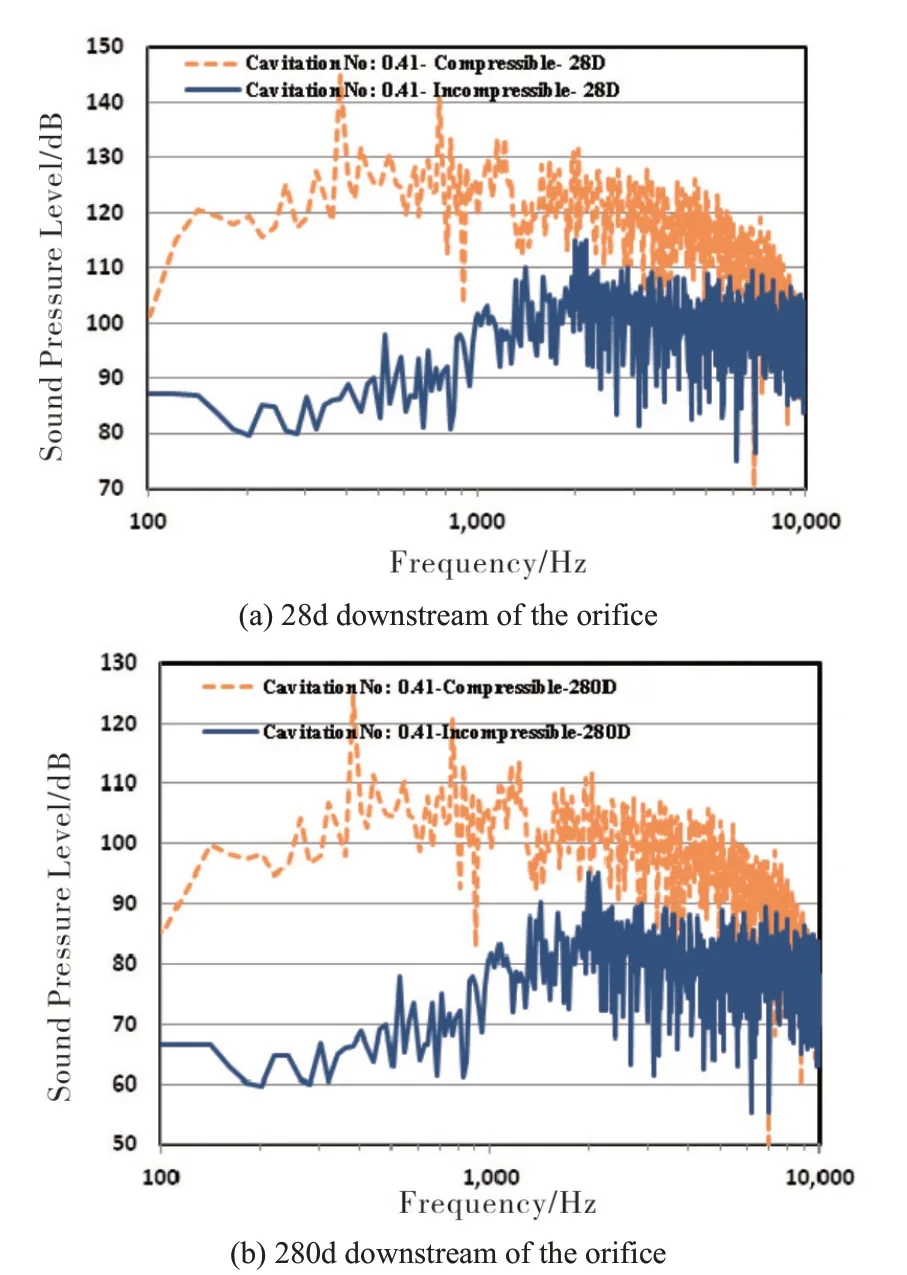
Fig.6 Sound pressure levels downstream of the single-hole orifice for both compressible and incompressible simulations for a developed cavitation regimewithσ=0.41.

Fig.7 Sound pressure levels downstream of the single-hole orifice for both compressible and incompressible simulations for a super cavitation regime withσ=0.15.
Comparison between Figure 6 and Figure 7 clearly show that for a developed cavitation regime,applying the incompressible simulation to find time-accurate solutions of the flow-field variables can result in underestimated values of sound pressure levels induced by a cavitating orifice.While for a super cavitation regime, both compressible and incompressible simulations provide similar values for sound pressure levels at frequencies greater than 2 kHz (including the frequency range which human hearing is more sensitive to sounds), there is a big discrepancy between computed sound pressure values from compressible and incompressible simulations for a developed cavitation regime in wide frequency ranges.
Although the FW-H formulation adopts the most general form of Lighthill’s acoustic analogy,there are some limitations with the FW-H method“ANSYS-FLUENT(2017)[9]”“Olivares (2009)[8]”. This method does not account for the walls and reflection in the pipe. The pipe geometry affects traveling waves which are influenced by dispersions and other factors. Also, this method focuses on the sound sources rather than the environment, in which reflection and scattering dispersion are not included and heterogeneity and the flow effect are ignored“Olivares(2009)[9]”.
6 Conclusions
In this work, the role of compressibility in computing noise generated at a cavitating single-hole orifice was investigated. The fluid zone downstream of the orifice where the cavitation occurs was evaluated as the acoustic source which generates sound. Time-accurate solutions of the flow-field variables, such as pressure and velocity components on source surfaces, were obtained from both compressible and incompressible simulations. Two cases of cavitation were investigated and the sound pressure signals far downstream of the orifice were computed by applying FW-H formulation.For each case,the acoustic results predicted by FW-H formulation based on both compressible and incompressible simulations for source-flow were compared to investigate the effect of compressibility in computing noise generated at a cavitating orifice.
The results confirm that the computed values of sound pressure levels generated by a cavitation orifice totally have been influenced by the methods applied in terms of finding time-accurate solutions of the flow-field variables of the noise source. For a developed cavitation regime, at low frequencies there is a large discrepancy between computed values of sound pressure level from compressible and incompressible simulations and at higher frequencies greater than 6 kHz, both simulation methods provide similar values for sound pressure levels. For a super cavitation regime, both compressible and incompressible simulations provide similar values for sound pressure levels at frequency greater than 2 kHz and compared to a developed cavitation regime, at low frequencies there is less discrepancy between computed values of sound pressure levels generated from both simulation methods. This discrepancy is around 55 dB at 400 Hz for a developed cavitation regime while for a super cavitation regime, the discrepancy is about 25 dB at 350 Hz. Unlike to the super cavitation regime with σ=0.15, for the developed cavitation regime with σ=0.41, the results of the compressible and incompressible simulation methods are not close in the frequency range which human hearing is more sensitive to sound. The results of this work demonstrate that the compressibility has a significant role in terms of computing noise generated at a cavitating orifice and cannot be ignored, especially when the noise generated by developed cavitation regimes at low frequencies is investigated. In this work the sound pressure signals far downstream of the orifice are computed by applying the FW-H formulation. There are some limitations with the FW-H method. This method focuses on the sound sources rather than the environment, in which reflection and scattering dispersion are not included and heterogeneity and the flow effect are ignored. Further research should be performed to apply other acoustic analogies to include reflection and scattering dispersion.
- 風(fēng)機技術(shù)的其它文章
- Multi-objective Optimization of a Fan Airfoil Adaptive for the Inlet Distortion*
- Tip Profile Optimization in a Low Aspect Ratio CAES Radial Expander Based on Orthogonal Design*
- Investigation on the Helium-foil of Highly Loaded Helium Compressor*
- Gurney襟翼在離心壓縮機葉輪上的數(shù)值研究*
- 吸油煙機多葉離心風(fēng)機的優(yōu)化與改進
- Effects of S-shaped Duct on Fan Blade Vibration

