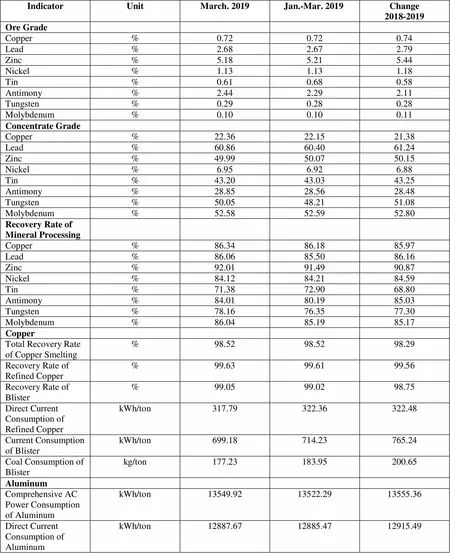
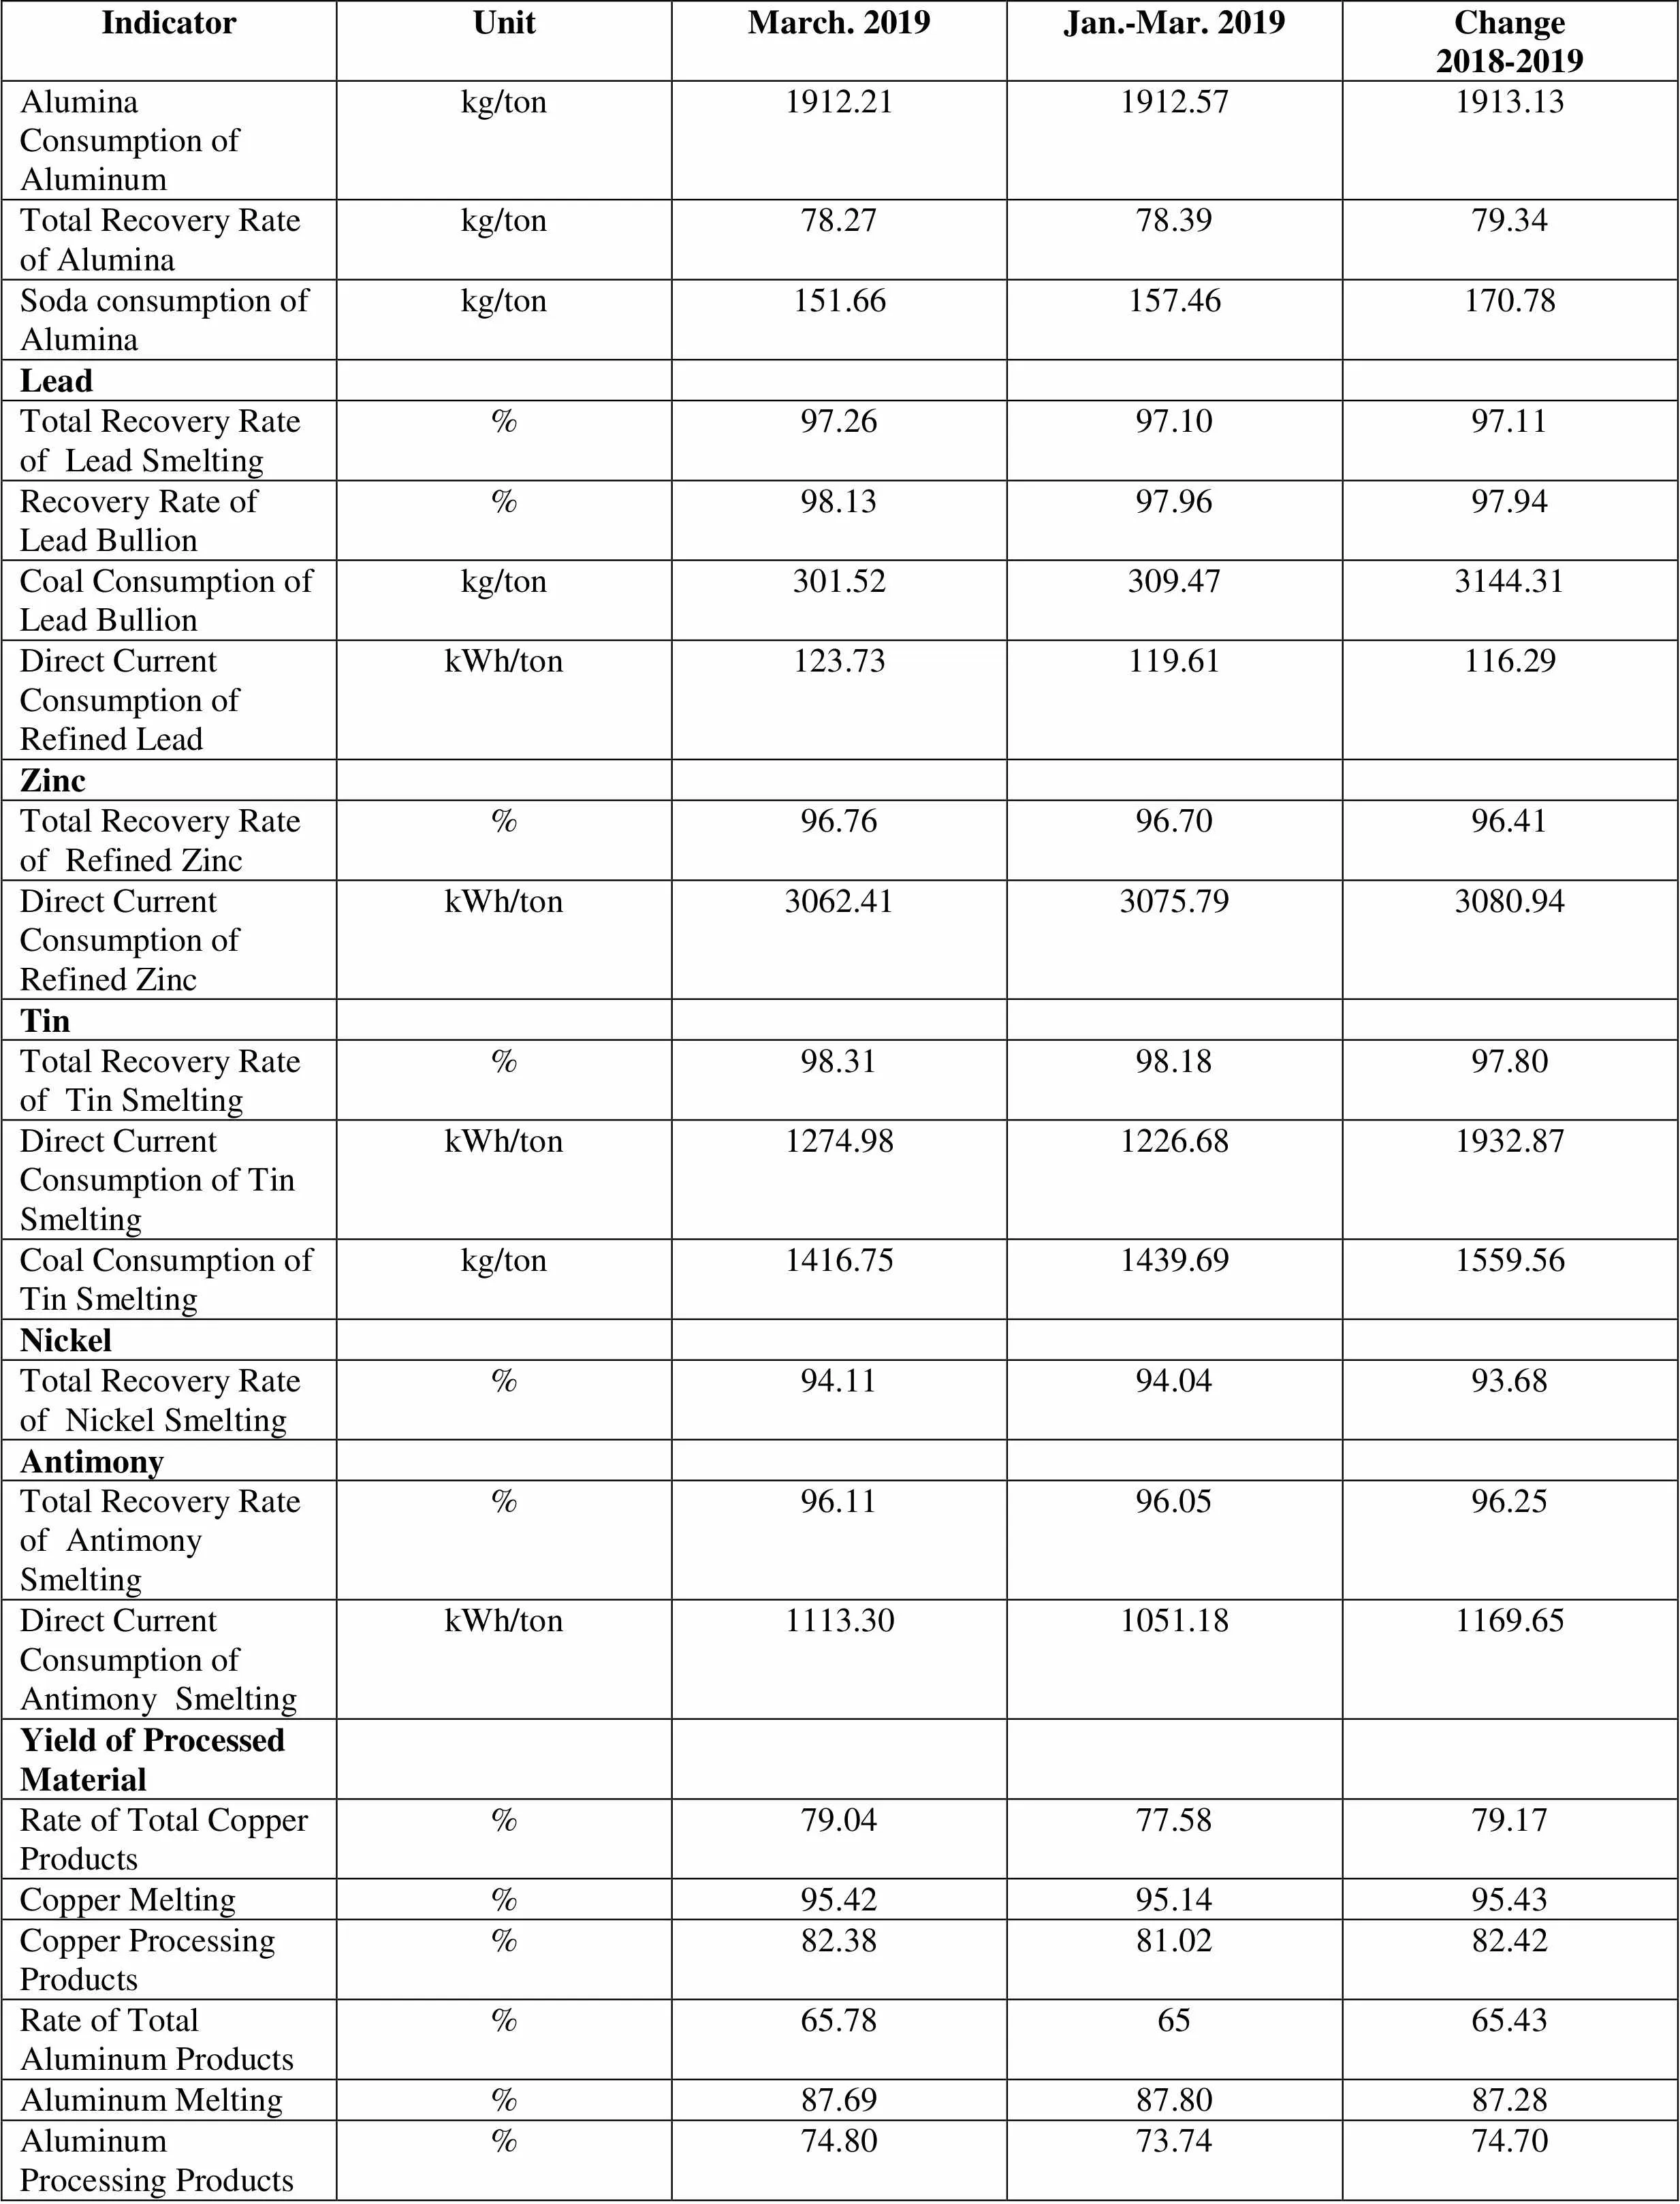
Technical and Economic Indicators of Major Enterprise

IndicatorUnitMarch. 2019Jan.-Mar. 2019Change2018-2019 Ore Grade Copper%0.720.720.74 Lead%2.682.672.79 Zinc%5.185.215.44 Nickel%1.131.131.18 Tin%0.610.680.58 Antimony%2.442.292.11 Tungsten%0.290.280.28 Molybdenum%0.100.100.11 Concentrate Grade Copper%22.3622.1521.38 Lead%60.8660.4061.24 Zinc%49.9950.0750.15 Nickel%6.956.926.88 Tin%43.2043.0343.25 Antimony%28.8528.5628.48 Tungsten%50.0548.2151.08 Molybdenum%52.5852.5952.80 Recovery Rate of Mineral Processing Copper%86.3486.1885.97 Lead%86.0685.5086.16 Zinc%92.0191.4990.87 Nickel%84.1284.2184.59 Tin%71.3872.9068.80 Antimony%84.0180.1985.03 Tungsten%78.1676.3577.30 Molybdenum%86.0485.1985.17 Copper Total Recovery Rate of Copper Smelting%98.5298.5298.29 Recovery Rate of Refined Copper%99.6399.6199.56 Recovery Rate of Blister%99.0599.0298.75 Direct Current Consumption of Refined CopperkWh/ton317.79322.36322.48 Current Consumption of BlisterkWh/ton699.18714.23765.24 Coal Consumption of Blisterkg/ton177.23183.95200.65 Aluminum Comprehensive AC Power Consumption of AluminumkWh/ton13549.9213522.2913555.36 Direct Current Consumption of AluminumkWh/ton12887.6712885.4712915.49

IndicatorUnitMarch. 2019Jan.-Mar. 2019Change2018-2019 Alumina Consumption of Aluminumkg/ton1912.211912.571913.13 Total Recovery Rate of Aluminakg/ton78.2778.3979.34 Soda consumption of Aluminakg/ton151.66157.46170.78 Lead Total Recovery Rate of Lead Smelting%97.2697.1097.11 Recovery Rate of Lead Bullion%98.1397.9697.94 Coal Consumption of Lead Bullionkg/ton301.52309.473144.31 Direct Current Consumption of Refined LeadkWh/ton123.73119.61116.29 Zinc Total Recovery Rate of Refined Zinc%96.7696.7096.41 Direct Current Consumption of Refined ZinckWh/ton3062.413075.793080.94 Tin Total Recovery Rate of Tin Smelting%98.3198.1897.80 Direct Current Consumption of Tin SmeltingkWh/ton1274.981226.681932.87 Coal Consumption of Tin Smeltingkg/ton1416.751439.691559.56 Nickel Total Recovery Rate of Nickel Smelting%94.1194.0493.68 Antimony Total Recovery Rate of Antimony Smelting%96.1196.0596.25 Direct Current Consumption of Antimony SmeltingkWh/ton1113.301051.181169.65 Yield of Processed Material Rate of Total Copper Products%79.0477.5879.17 Copper Melting %95.4295.1495.43 Copper Processing Products%82.3881.0282.42 Rate of Total Aluminum Products%65.786565.43 Aluminum Melting%87.6987.8087.28 Aluminum Processing Products%74.8073.7474.70
 China Nonferrous Metals Monthly2019年5期
- China Nonferrous Metals Monthly的其它文章
- Zinc Production by Province in 2019
- Copper Mine Production by Province or City in 2019
- Lead Production by Province or City in 2019
- Fabricated Copper Production by Province or City in 2019
- Production of the Ten Major Nonferrous Metals in 2019
- Nickel Production by Province or City in 2019
