Fullwave Doppler reflectometry simulations for density turbulence spectra in ASDEX Upgrade using GENE and IPF-FD3D
C LECHTE ,G D CONWAY,T G?RLER ,T HAPPEL and the ASDEX Upgrade Team
1 Institute of Interfacial Process Engineering and Plasma Technology IGVP,Universit?t Stuttgart,D-70569 Stuttgart, Germany
2 Max-Planck-Institute for Plasma Physics, D-85748 Garching, Germany
Abstract Doppler reflectometry is an important microwave diagnostic for turbulent fusion plasmas.A microwave beam is scattered off density fluctuations,with wavenumbers according to incident frequency and relative direction.This way,a density fluctuation spectrum is measured.However,the correspondence between fluctuation power and scattered microwave power is strongly nonlinear. Studying these processes numerically therefore requires fullwave simulations
Keywords: plasma diagnostics, Doppler reflectometry, simulation, microwaves(Some figures may appear in colour only in the online journal)
1. Introduction
Magnetically confined fusion plasmas are usually plagued by instabilities which result in turbulent fluctuations of important plasma parameters. Turbulence is a driver of particle and energy transport out of the magnetic confinement. Reflectometry methods are widely used to measure density fluctuations inside the plasma, which can have temperatures of several keV.
Doppler reflectometry (or Doppler backscattering) is an important microwave diagnostic for turbulent fusion plasmas.A microwave beam is reflected at the cut-off and scattered off density fluctuations,with wavenumbers according to incident frequency and relative direction. The direct (0th order)reflection is ignored, and usually the -1st Bragg order is the desired signal. It propagates backwards through the same plasma region as the incident beam,illustrated in figure 1.For a monostatic antenna configuration the Bragg condition for the received scattered radiation is:


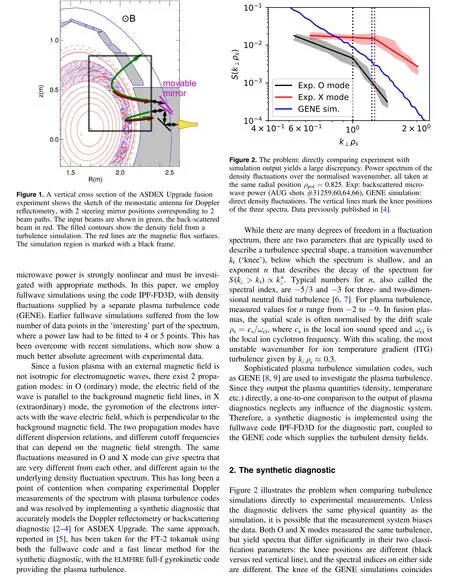
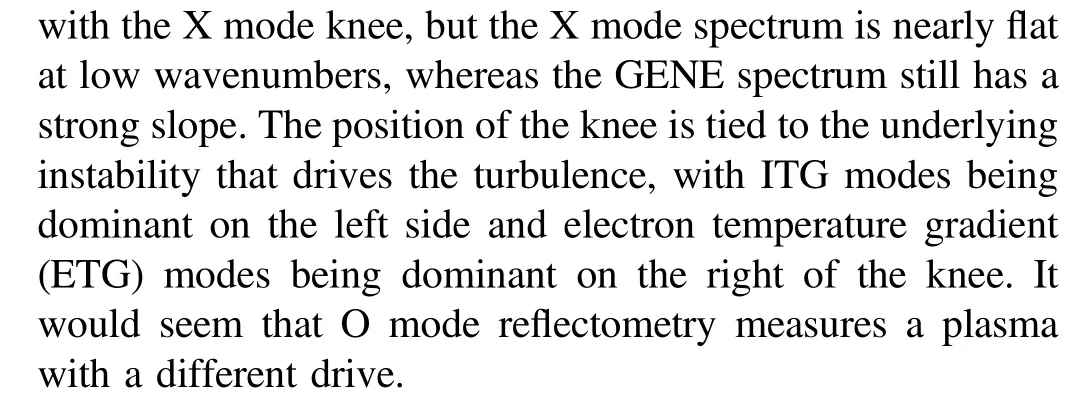
It is therefore necessary to also simulate the plasma diagnostic and then compare like with like. This synthetic diagnostic takes into account both the physical system(turbulence code) and the plasma diagnostic (fullwave code),which takes the turbulence simulations as input and calculates the signal seen by the experimental Doppler reflectometer.We expect a good agreement between exerimental and synthetic signals for O and X modes, respectively. The significant difference of both experimental and synthetic spectra to the GENE spectrum are then explained by the characteristic instrument function of the Doppler diagnostic. One can then speculate how to recover the true fluctuation spectrum from measurements without the turbulence and fullwave simulations. If experimental and fullwave spectra agree, this also validates the turbulence code [3].
A considerable part of the effort for this synthetic diagnostic has been dedicated to generating the physically consistent turbulence fields for its input. The code used was the gyrokinetic plasma turbulence code GENE [8, 9] which is a physically comprehensive, hyperscalable Vlasov code that supports both local (flux-tube) and global (full-torus) calculations. However, as the latter can be quite computationally demanding, a local flux tube around the toroidal flux radius probed in experiment was simulated, with physics inputs being interpolated from the measured background profiles.The same profiles were used for the fullwave code IPF-FD3D,with the added turbulence from GENE.In order to ensure the relevance of the turbulence simulations, the global heat flux of the simulation was matched to the flux measured in the experimental discharges that were modelled. This measurement is independent of the Doppler reflectometry diagnostic.The temperature profiles were then adjusted within the experimental uncertainty until the experimental flux was matched by the simulations. The procedure is described in more detail in [2, 4].
3. The fullwave code IPF-FD3D
The reflectometry simulations were performed with the IPFFD3D code [10, 11] using a two-dimensional Cartesian grid.The wave propagation is simulated from the launching antenna, to the plasma cutoff, and back to the coherent receiver, yielding the instantaneous reflectometer amplitude and phase.IPF-FD3D is a finite-difference time domain code[12] that simulates the propagation of electromagnetic waves in cold plasmas[13,14]in two or three-dimensions. Its main feature is the capability of simulating wave propagation in a given inhomogeneous, anisotropic (i.e. magnetised) plasma by integrating the equation of motion of the electrons and the Maxwell equations:
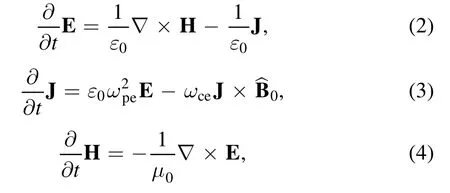
where E and H are the electric and magnetic field vectors of the wave, and J denotes the vector for the plasma current caused by the wave.Furthermore,︿B0is the unity vector in the direction of the background magnetic field B0, ωcethe electron cyclotron frequency, and ωpethe plasma frequency. All these quantities can be time and space dependent.
The 3 differential equations are converted to finite difference equations on a staggered Yee grid in space and leapfrogging of E, H, and J in time [15]. This allows the use of central differences with second order accuracy. Equation (3)presents a problem with the choice of the time grid because it contains both J and its time derivative. This is overcome by interpolating the required values of J between the available time points with a Crank–Nicolson like formulation, which,however,does not give unconditional stability like it does for parabolic problems.
The plasma setup is given by spatial arrays of plasma density and the three background field components Br(radial),Bt(toroidal), and Bp(poloidal). They are taken from the ASDEX Upgrade reconstructed equilibria (prepared) by CLISTE[16]for each experimental shot that is considered in the simulations. The density fluctuations from the GENE simulations are added on top of the equilibrium density profile, with an optional scaling factor to artificially increase or decrease the fluctuation amplitude. Typical amplitudes were on the order of 1%–3% of the background density. All simulations reported here were done in 2D,i.e.in the poloidal R–z plane.
The reflectometer launching and receiving antennas are synthetic apertures at the edge of the simulation grid. The beams are fundamental Gaussians that can be modified by higher order Hermite modes so that the experimental beam geometry can be accurately modelled.In this paper,the beams were modelled as pure Gaussian beams with a beam waist corresponding to the experimental beam widths.The receiver samples the field at the same position and convolves it with the complex beam pattern of the receiving antenna, which is usually the same as the launching antenna. Figure 3 shows a simulation grid which covers the upper right portion of the poloidal plasma cross section of ASDEX Upgrade. Overlaid on the density contour plot is the electric wave field,which is injected in the upper right edge. Many backscattered waves are seen in the lower half. The code uses a total/scattered field format to discriminate the weak scattered signal from the input wave.
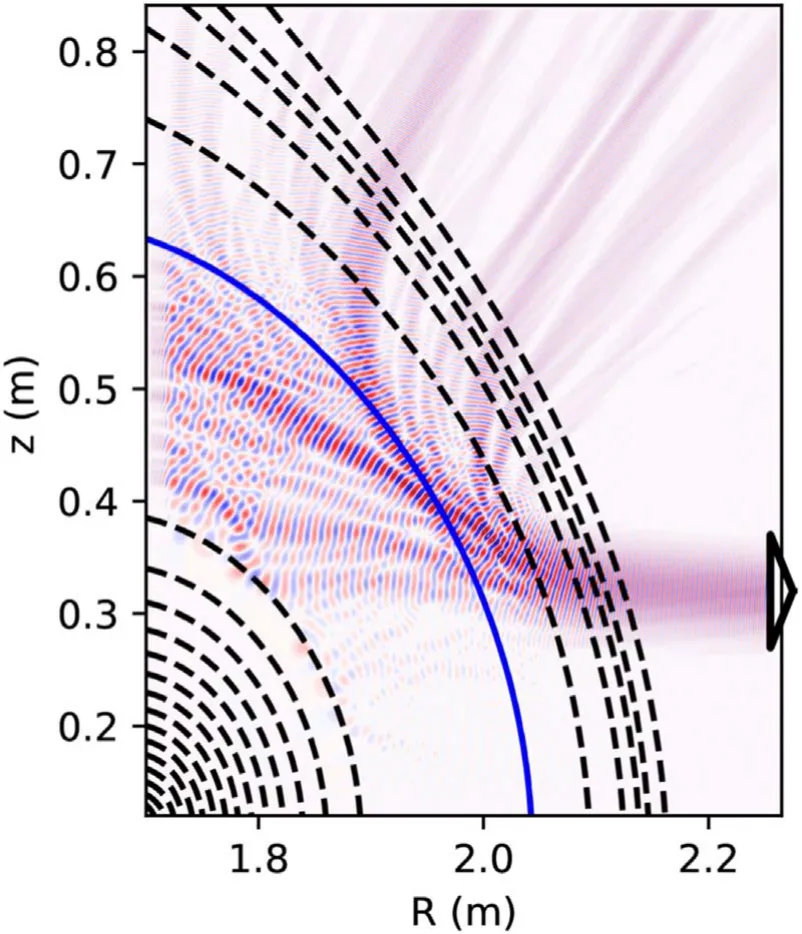
Figure 3. Setup of the simulation grid for ASDEX Upgrade. The electric wave field of a single beam is shown as filled contours overlaid by the dashed line contour plot of the background density profile with the cutoff position at ρpol=0.825 as solid blue line.The virtual sending and receiving antenna is indicated at the lower right edge.
For the Doppler reflectometry investigation a radial position ρpolis chosen, which is based on the poloidal magnetic flux. The beam tracing code TORBEAM [17] is used to find the corresponding launch frequencies and their probed wavenumbers k⊥for a range of antenna tilt angles.All beams are launched into the simulation grid simultaneously.They are discriminated by their different frequencies,with the relative cross talk between beams below 10-10. While all beams have slightly different propagation angles, it is not possible to discriminate by that, since the wavenumber spectra of the beams overlap significantly. This receiver part of the code was recently speeded up by a factor of 80,which allows an increase of simultaneously launched beams from less than 20 to 160–240. An animation illustrating the Doppler backscattering process is available [18].
4. Results of the Doppler reflectometry simulations
4.1. Previous results
Previous results for ASDEX Upgrade are discussed in [2]and, with more recent experimental data in both O and X mode, in [4]. The new results concern only the measurement campaign in the latter publication (AUG shots #31259,60,64,66). The main result was that in X mode, the spectrum saturates at low wavenumbers (where the spectral power is highest). The overall relative fluctuation strength was 0.9%,which is given by the GENE simulations. It is the value that reproduces the experimentally observed (electron) heat flux.This saturation changes the apparent location of the knee,where the spectrum goes from very shallow to the steep power law region at large wavenumbers. The power law exponent (spectral index) is also modified, the spectrum is more shallow (n≈-2.3 instead of n≈-3.6 and n≈-6.3 at high wavenumbers).This is an effect both of the nonlinear compression of the spectrum, and nonlinear enhancement at intermediate fluctuation amplitudes first observed in [19].Figure 4(b) illustrates the significant difference between a spectrum measured at nonlinear versus linear conditions(compare only the solid curves labelled ‘fine’).
When the density fluctuation amplitude is decreased to 1/2, the nonlinear compression effect is reduced and the spectrum steepens again. With this factor, the spectrum from fullwave simulations of GENE data, and the ones from experimental data,are in better agreement.The scaling factor was justified by the significant uncertainty in the ion temperature profiles that were used as input to GENE, which are the drivers of the turbulence. In O mode probing, the degree of nonlinearity was much lower, and the fullwave and experimental spectra were more similar.
This situation was not satisfactory, especially the power law fits to only 4 or 5 points, with significant differences in spectral index between the two, albeit with their respective uncertainties, which were large (>25%). One cannot justify from the data alone which fit is the correct one.This is shown in figure 5(a). Therefore, 2 improvements were made. Only the results of these improvements and comparison with experimental data from AUG shots #31259,60,64,66 and GENE results will be discussed in the rest of the paper:
(i) The GENE turbulent density fields were re-exported from GENE with an 8 times finer interpolation grid in the direction along B0, and
(ii) the number of points in the spectrum, previously the exact same ones that were measured experimentally,was increased to 160 for X mode and 220 for O mode.This was only feasible because of the optimisations described in section 3.
Regarding point(i)The GENE turbulence code works in coordinates that are aligned to the magnetic background field.When the plasma density is exported to IPF-FD3D,it must be interpolated onto the Cartesian grid used in IPF-FD3D.It was discovered that the interpolation along the magnetic field direction was using too few points. This had the effect of suppressing certain wavenumbers in the perpendicular direction,which the Doppler reflectometry is measuring.This was not immediately obvious, because of the nonlinear effect of higher order scattering, where the high amplitude, low wavenumbers cause Doppler scattering at twice their wavenumber, filling the gap in the spectrum. At full density fluctuation amplitude, there is only a small difference in the Doppler spectrum between the old coarse and the new,much finer interpolation (see figure 4(a). While the spectral index does change by more than 20%, this is still within the uncertainty ranges.The change is going in the direction of the experimental value of n=-3.6. In figure 4(b), the density
fluctuation amplitude has been scaled by 1/1000 before running the fullwave code. This linearised case shows the significant loss of spectral power in the coarse interpolation compared to the fine one.
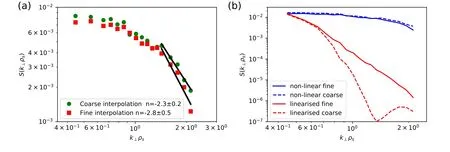
Figure 4.Comparing fine and coarse resolution of the interpolation grid for the turbulence data in X mode. (a) Power law fits, the spectral index changes but only within its large error bars.(b)Loss of spectral power at large wavenumbers due to coarse interpolation is masked in the nonlinear case.This becomes apparent at 1/1000 of the density fluctuation amplitude,where nonlinear effects vanish.‘Coarse’data taken from [2].

Figure 5.(a)Different power law fits to the very few points in the Doppler spectrum from previous fullwave simulations[4].(b)New highresolution simulated Doppler spectrum with obvious knee position and robust fit to power law.
Regarding point (ii) The new fullwave simulations used the fine interpolation of the turbulence data and increased the number of probed wavenumbers, which is not feasible in experiment. In X mode simulations, for example, the launched frequencies ranged from 98.3 to 106.1 GHz on a fixed raster of 50 MHz. The resulting simulated Doppler spectrum is shown in figure 5(b). The knee position in the spectrum is now very clearly identified, and the power law fit to 114 points produces a robust result of n=-3.7±0.1 with a low error estimate. We are now confident that the match with the experimental spectral index is not accidental.No scaling factors for the turbulence strength are necessary to achieve the same spectral index n as in experiment, which is caused by underlying fluctuations with n≈-6.3.
4.2. Results for X mode
Figure 6 overlays the X mode spectra from simulation and the envelope of two different measurements.The solid black lines are fits to the measured data points. The fullwave simulation covers a larger wavenumber range than possible in the experiment. Since there is no absolute power calibration, the experimental spectrum has been scaled to fit all fullwave points into the envelope. The spectral index now coincides with one of the measurements, and is still similar to the other measurement.The position of the knee is still at lower wavenumbers in the measurements. This can partially be explained by uncertainties in the determination of the wavenumber using beamtracing [20]. Overall, a good agreement has now been reached between experiment and simulation.
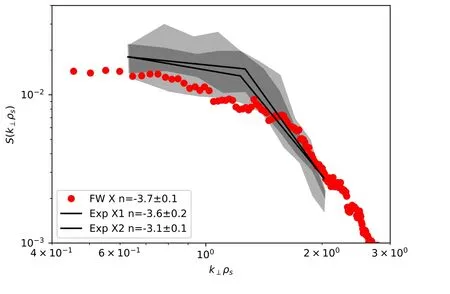
Figure 6.New fullwave simulation X mode Doppler spectra (‘FW’,red circles)and overlaid envelope of experimental results from AUG shots #31259,60,64,66. Experimental results were already reported in [4]. The spectral power in arbitrary units was scaled to achieve maximum overlap between experiment and simulation.
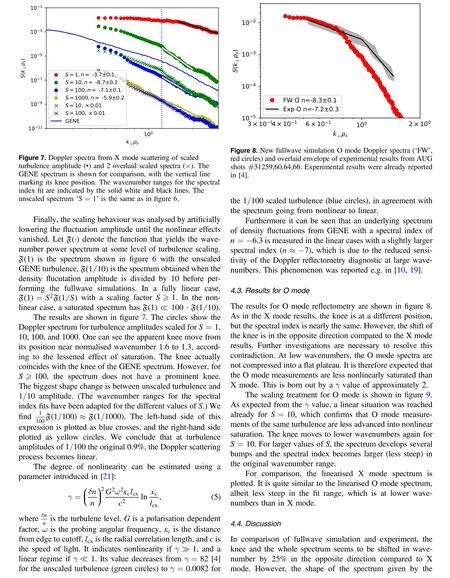

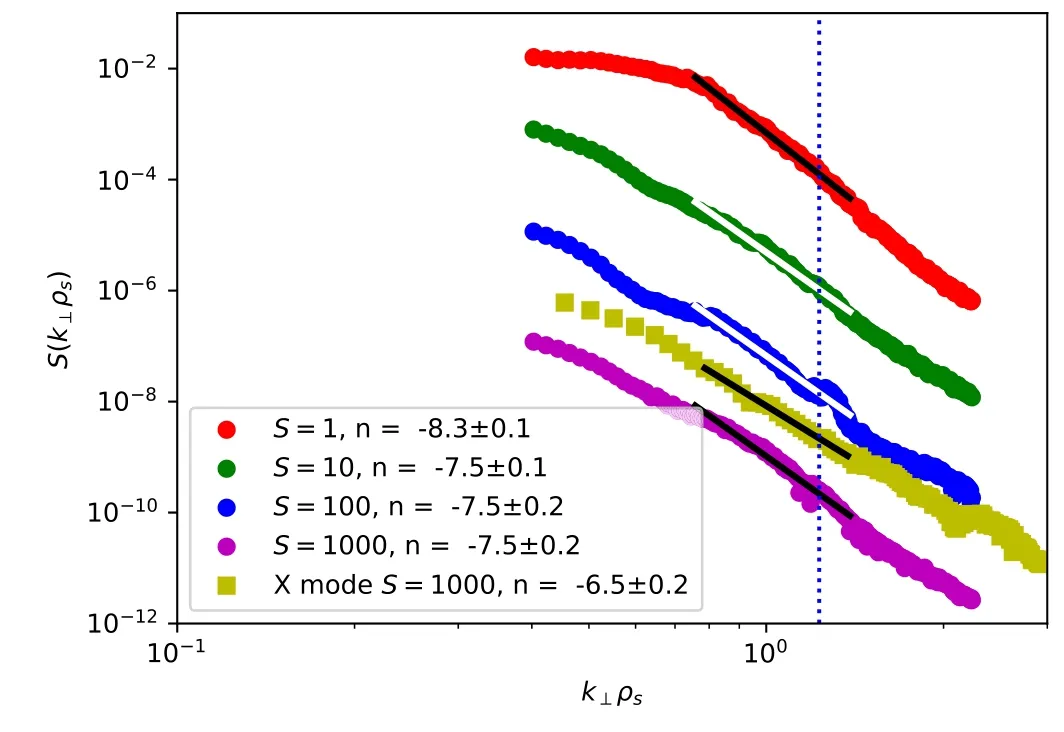
Figure 9. Doppler spectra from O mode scattering of scaledturbulence amplitude(?)and linearised X mode for comparison.The wavenumber ranges for the spectral index fit are indicated by the solid white and black lines. The unscaled spectrum ‘S=1’ is the same as in figure 8. The GENE spectrum knee position is marked with the vertical line.
Possible errors in determining the probed wavenumber from beam or raytracing are investigated in [20]. An additional cause for discrepancies is the 3D nature of the experiment and TORBEAM, which is not fully modelled in the 2D fullwave simulations. It is therefore planned to run additional fullwave simulations with marker peaks in the spectrum to determine the actual probed wavenumbers in the 2D scenario modelled in the fullwave code.
Furthermore, a more sophisticated analysis of nonlinearity thresholds and apparent knee positions can be performed using the theoretical framework given in [22]. For a preliminary test, we are only looking at the exponential term in the formula for the received signal power (adapted from equation (19) in [22]):


5. Conclusions
After a long period of refinements in the GENE simulations,the data exchange,the fullwave simulations,improvements in the quality and quantity of the Doppler measurements, the profile and equilibrium, and the availability of both O and X mode measurements, we finally have good agreement between measured and simulated Doppler derived density fluctuation wavenumber spectra,with only a 25%discrepancy in the wavenumber axis, subject to further investigation.Nonlinear theoretical analysis [22] could identify the fluctuation strength dependent transition wavenumber, above which the scattered power declines rapidly, giving rise to an apparent knee in the spectrum that is independent of the underlying density fluctuation spectrum’s knee. It is planned to undertake a detailed analysis.
The X mode spectra are shown to be more nonlinearly saturated than spectra from O mode measurements.A similar consequence of nonlinear saturation was also found in the FT-2 tokamak synthetic Doppler reflectometry effort [5].
These results serve as another piece in the validation efforts for plasma turbulence simulations.The reproduction of the spectral shape forms an important link between turbulence simulations and comparison to measurements.
It is planned to continue this undertaking as new Doppler reflectometry measurements and accompanying turbulence simulations become available.
Acknowledgments
The GENE simulations were performed on the HPC-FF computer cluster in Jülich, Germany and on the BOB Linux cluster at RZG; the IPF-FD3D fullwave simulations were performed on hazelhen at HLRS Stuttgart. The authors acknowledge support by the state of Baden-Württemberg through bwHPC.This work was also partly performed within the framework of the Helmholtz Virtual Institute on Plasma Dynamical Processes and Turbulence Studies using Advanced Microwave Diagnostics and within the collaboration with the Max Planck Institute for Plasma Physics (IPP),Garching and Greifswald, Germany. This work has been carried out within the framework of the EUROfusion Consortium and has received funding from the Euratom research and training program 2014–2018 and 2019–2020 under grant agreement No. 633053. The views and opinions expressed herein do not necessarily reflect those of the European Commission.
ORCID iDs
C LECHTE https://orcid.org/0000-0003-4171-888X
T G?RLER https://orcid.org/0000-0002-0851-6699
 Plasma Science and Technology2020年6期
- Plasma Science and Technology的其它文章
- Sensitivity of two drug-resistant bacteria to low-temperature air plasma in catheterassociated urinary tract infections under different environments
- First experimental results of intrinsic torque on EAST
- Gas pressure effect on plasma transport in a magnetic-filtered radio-frequency plasma source
- Design of a variable frequency comb reflectometer system for the ASDEX Upgrade tokamak
- Optimization of plasma-processed air (PPA)inactivation of Escherichia coli in button mushrooms for extending the shelf life by response surface methodology
- Reconstruction of hollow areas in density profiles from frequency swept reflectometry
