
Technical and Economic Indicators of Major Enterprise
2018-12-21 02:04:24
China Nonferrous Metals Monthly 2018年12期
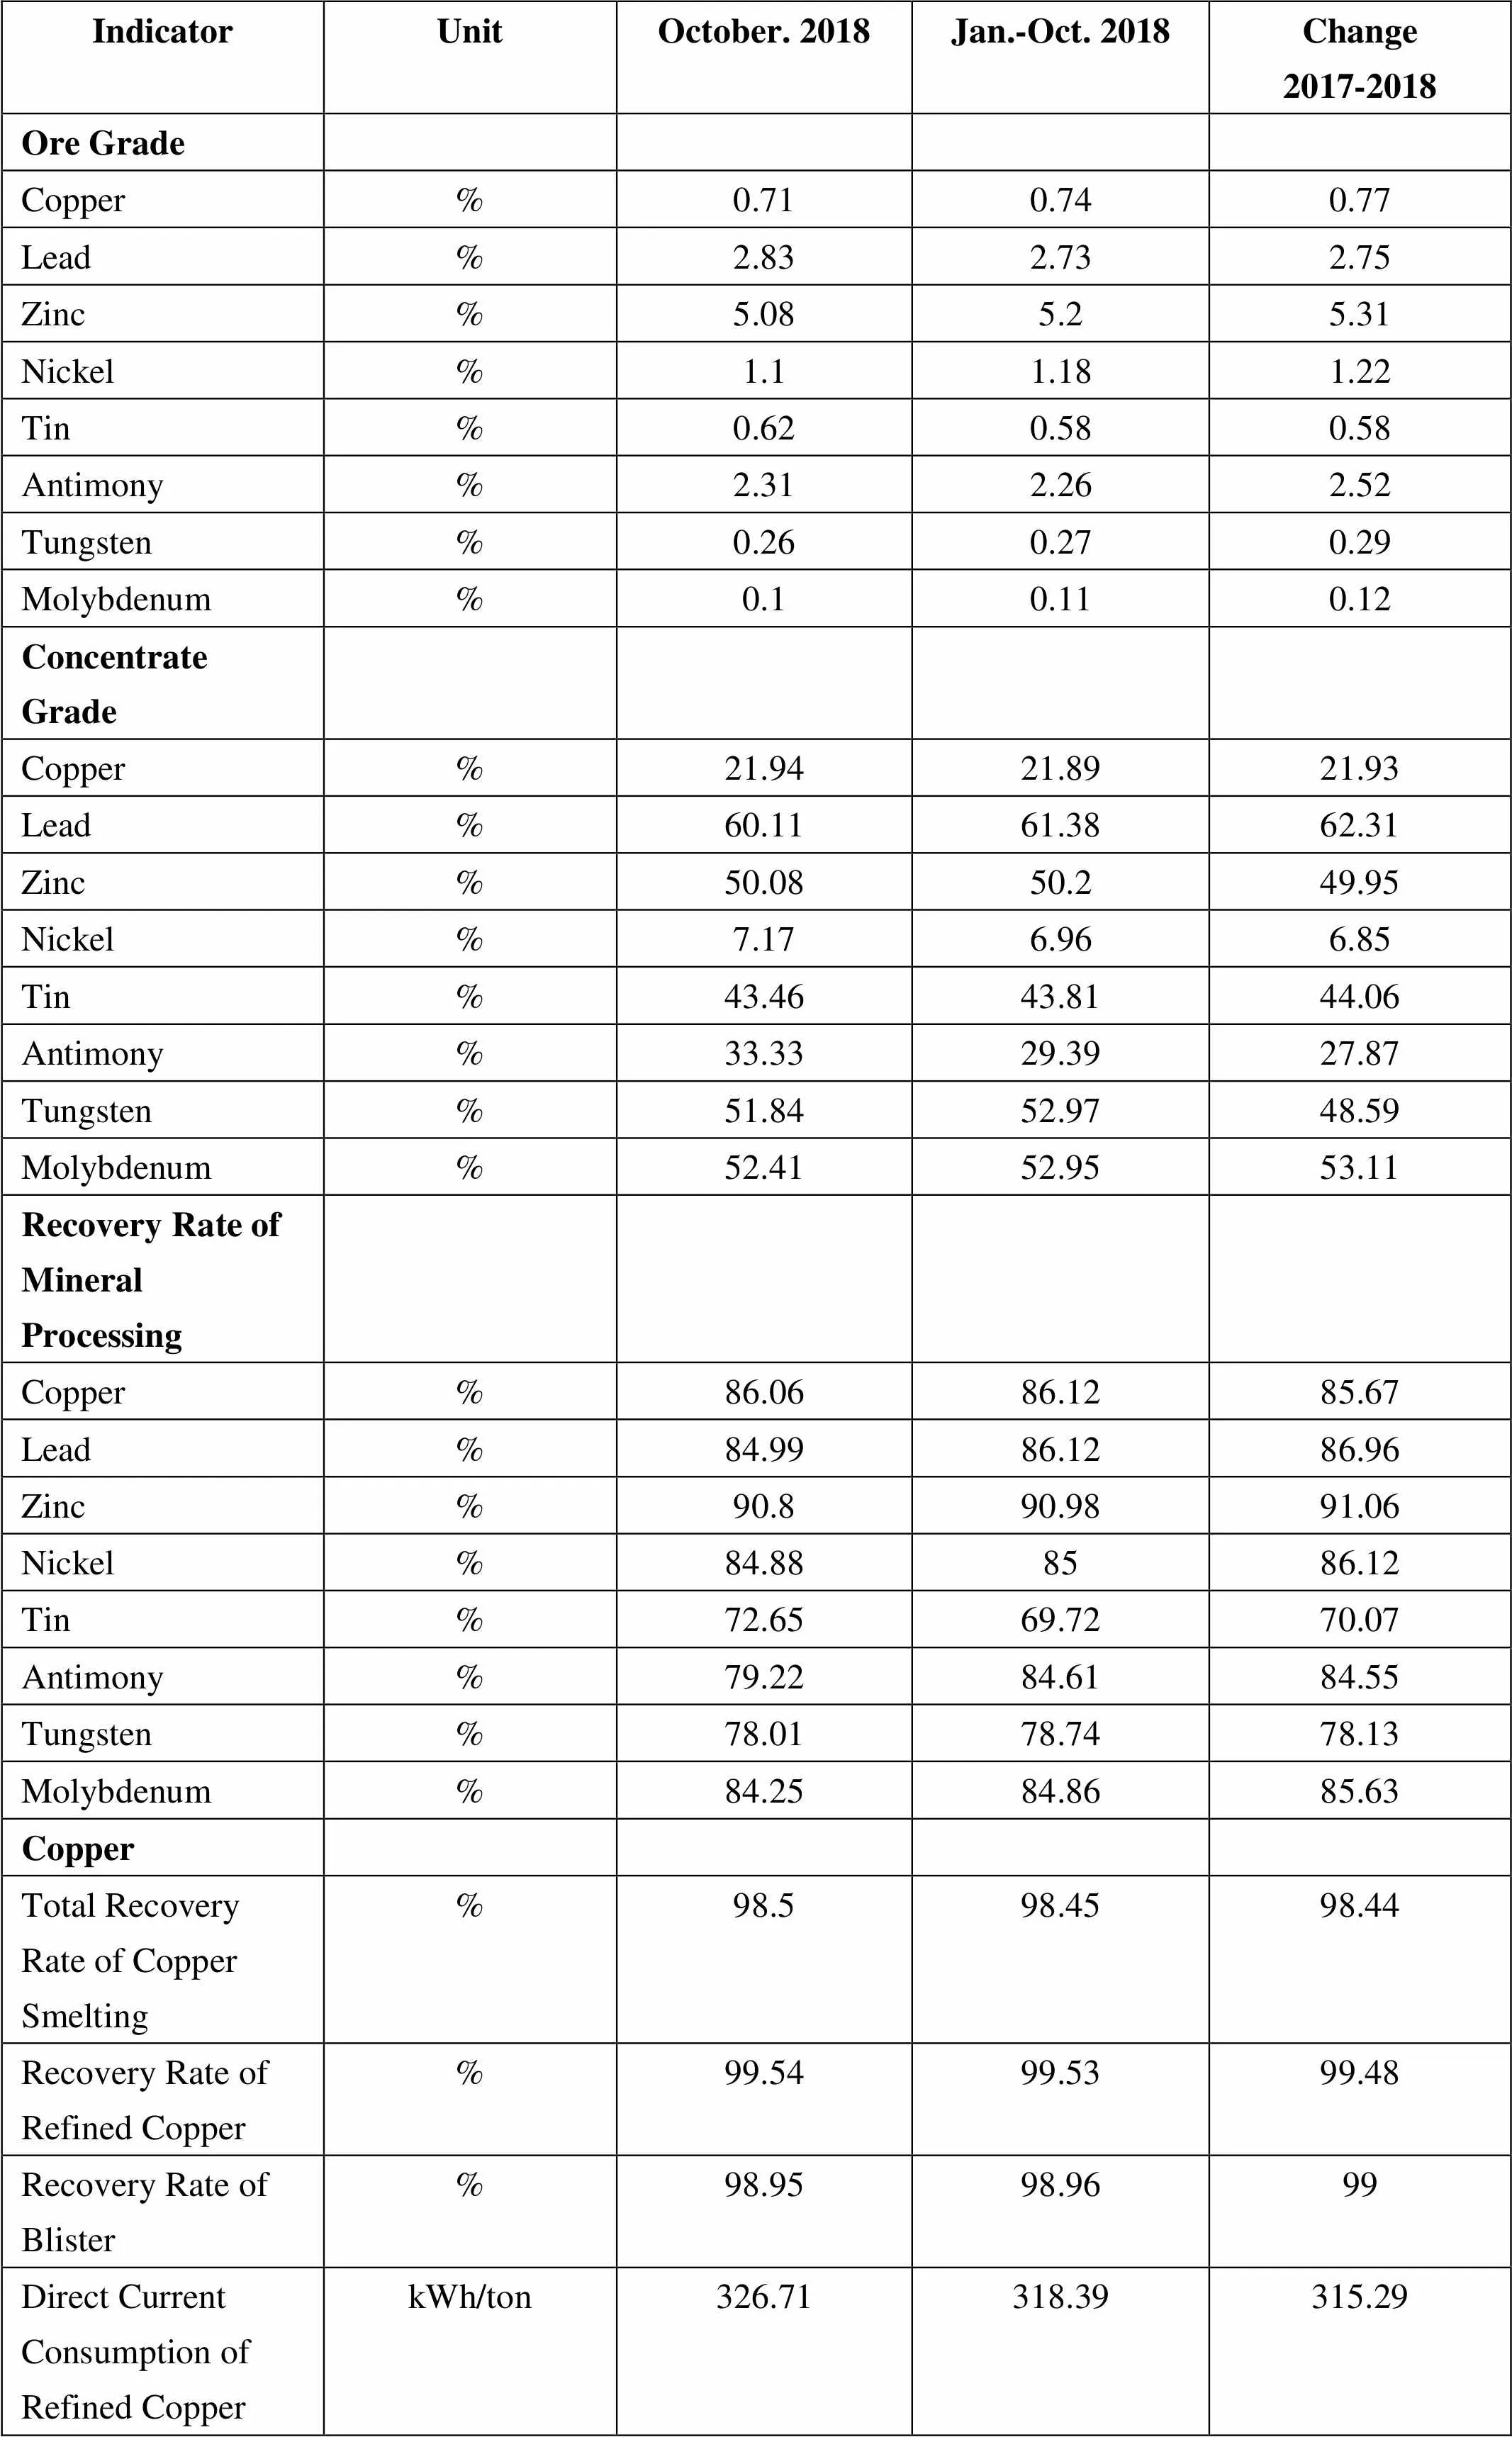
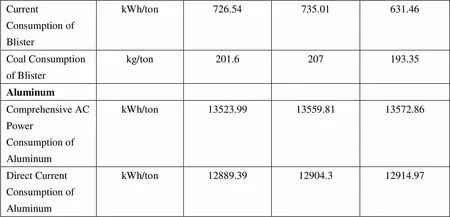
IndicatorUnitOctober. 2018Jan.-Oct. 2018Change2017-2018 Ore Grade Copper%0.710.740.77 Lead%2.832.732.75 Zinc%5.085.25.31 Nickel%1.11.181.22 Tin%0.620.580.58 Antimony%2.312.262.52 Tungsten%0.260.270.29 Molybdenum%0.10.110.12 Concentrate Grade Copper%21.9421.8921.93 Lead%60.1161.3862.31 Zinc%50.0850.249.95 Nickel%7.176.966.85 Tin%43.4643.8144.06 Antimony%33.3329.3927.87 Tungsten%51.8452.9748.59 Molybdenum%52.4152.9553.11 Recovery Rate of Mineral Processing Copper%86.0686.1285.67 Lead%84.9986.1286.96 Zinc%90.890.9891.06 Nickel%84.888586.12 Tin%72.6569.7270.07 Antimony%79.2284.6184.55 Tungsten%78.0178.7478.13 Molybdenum%84.2584.8685.63 Copper Total Recovery Rate of Copper Smelting%98.598.4598.44 Recovery Rate of Refined Copper%99.5499.5399.48 Recovery Rate of Blister%98.9598.9699 Direct Current Consumption of Refined CopperkWh/ton326.71318.39315.29 Current Consumption of BlisterkWh/ton726.54735.01631.46 Coal Consumption of Blisterkg/ton201.6207193.35 Aluminum Comprehensive AC Power Consumption of AluminumkWh/ton13523.9913559.8113572.86 Direct Current Consumption of AluminumkWh/ton12889.3912904.312914.97
IndicatorUnitOctober. 2018Jan.-Oct. 2018Change2017-2018 Ore Grade Copper%0.710.740.77 Lead%2.832.732.75 Zinc%5.085.25.31 Nickel%1.11.181.22 Tin%0.620.580.58 Antimony%2.312.262.52 Tungsten%0.260.270.29 Molybdenum%0.10.110.12 Concentrate Grade Copper%21.9421.8921.93 Lead%60.1161.3862.31 Zinc%50.0850.249.95 Nickel%7.176.966.85 Tin%43.4643.8144.06 Antimony%33.3329.3927.87 Tungsten%51.8452.9748.59 Molybdenum%52.4152.9553.11 Recovery Rate of Mineral Processing Copper%86.0686.1285.67 Lead%84.9986.1286.96 Zinc%90.890.9891.06 Nickel%84.888586.12 Tin%72.6569.7270.07 Antimony%79.2284.6184.55 Tungsten%78.0178.7478.13 Molybdenum%84.2584.8685.63 Copper Total Recovery Rate of Copper Smelting%98.598.4598.44 Recovery Rate of Refined Copper%99.5499.5399.48 Recovery Rate of Blister%98.9598.9699 Direct Current Consumption of Refined CopperkWh/ton326.71318.39315.29 Current Consumption of BlisterkWh/ton726.54735.01631.46 Coal Consumption of Blisterkg/ton201.6207193.35 Aluminum Comprehensive AC Power Consumption of AluminumkWh/ton13523.9913559.8113572.86 Direct Current Consumption of AluminumkWh/ton12889.3912904.312914.97
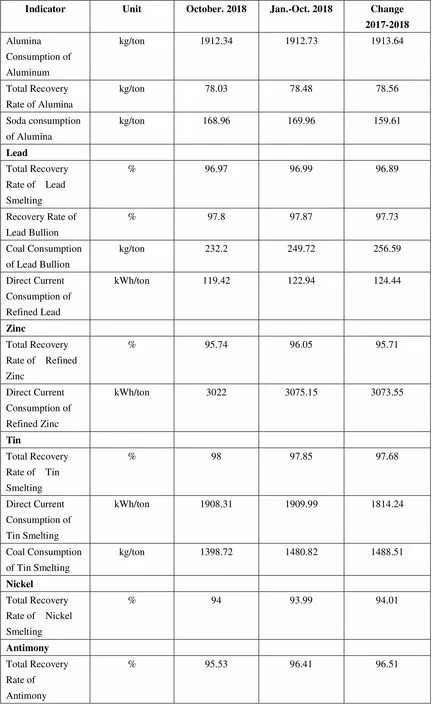
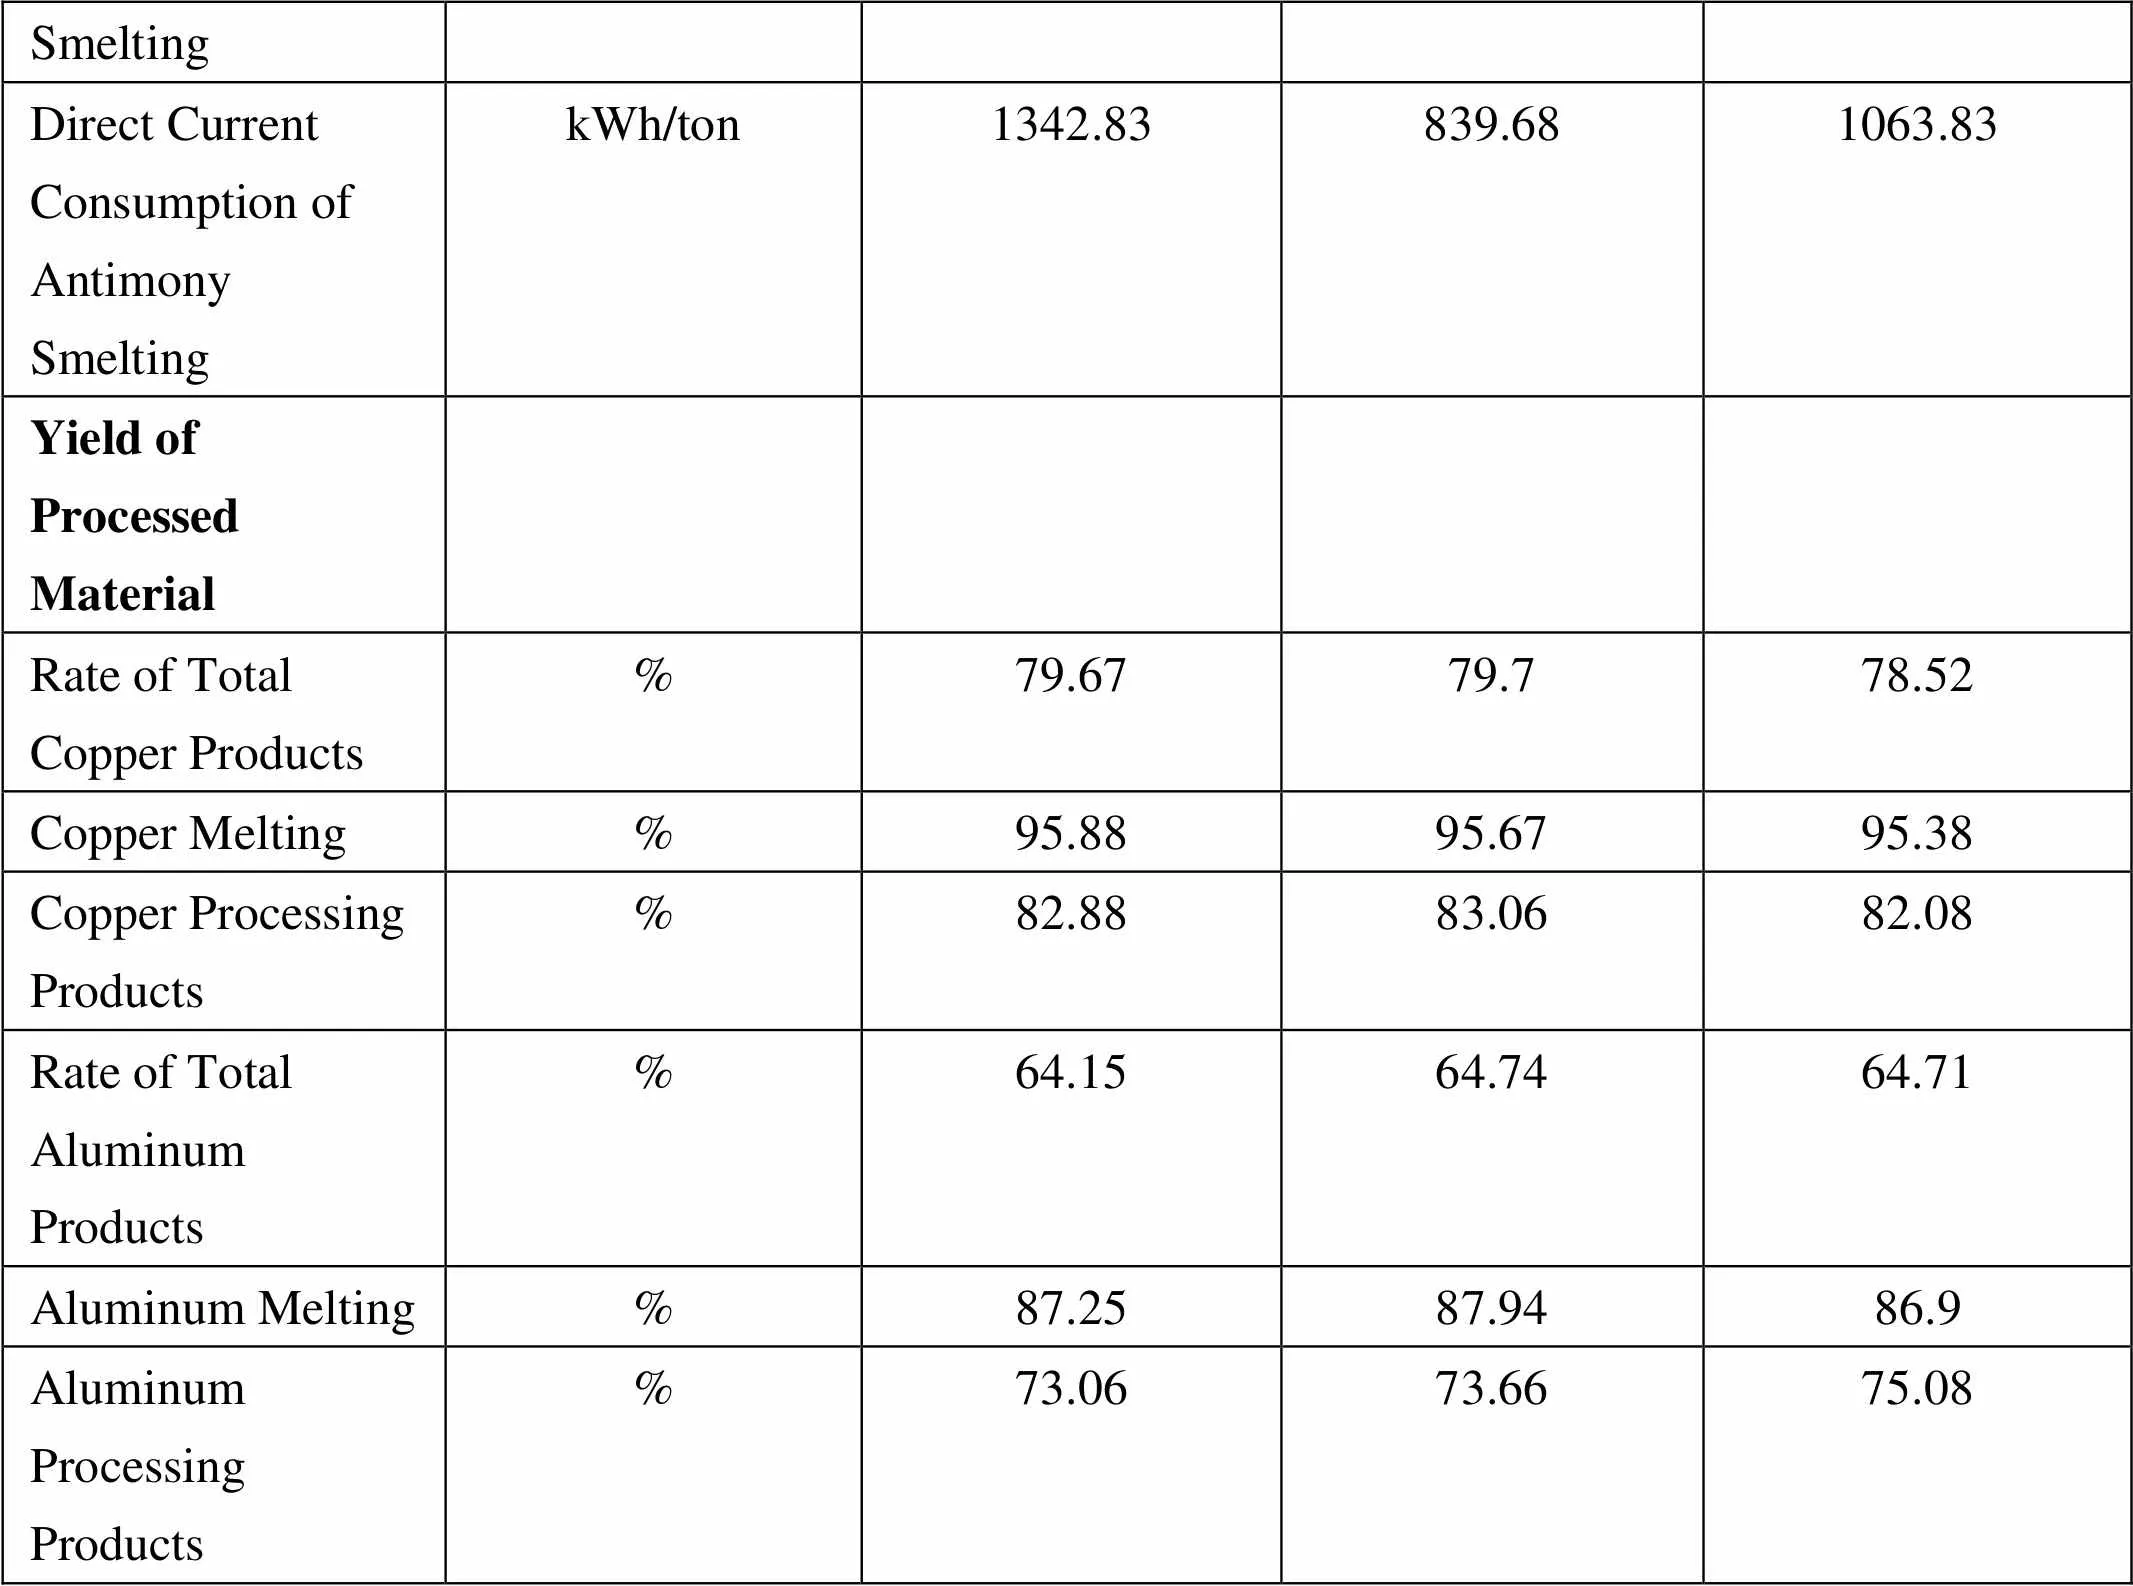
IndicatorUnitOctober. 2018Jan.-Oct. 2018Change2017-2018 Alumina Consumption of Aluminumkg/ton1912.341912.731913.64 Total Recovery Rate of Aluminakg/ton78.0378.4878.56 Soda consumption of Aluminakg/ton168.96169.96159.61 Lead Total Recovery Rate of Lead Smelting%96.9796.9996.89 Recovery Rate of Lead Bullion%97.897.8797.73 Coal Consumption of Lead Bullionkg/ton232.2249.72256.59 Direct Current Consumption of Refined LeadkWh/ton119.42122.94124.44 Zinc Total Recovery Rate of Refined Zinc%95.7496.0595.71 Direct Current Consumption of Refined ZinckWh/ton30223075.153073.55 Tin Total Recovery Rate of Tin Smelting%9897.8597.68 Direct Current Consumption of Tin SmeltingkWh/ton1908.311909.991814.24 Coal Consumption of Tin Smeltingkg/ton1398.721480.821488.51 Nickel Total Recovery Rate of Nickel Smelting%9493.9994.01 Antimony Total Recovery Rate of Antimony Smelting%95.5396.4196.51 Direct Current Consumption of Antimony SmeltingkWh/ton1342.83839.681063.83 Yield of Processed Material Rate of Total Copper Products%79.6779.778.52 Copper Melting %95.8895.6795.38 Copper Processing Products%82.8883.0682.08 Rate of Total Aluminum Products%64.1564.7464.71 Aluminum Melting%87.2587.9486.9 Aluminum Processing Products%73.0673.6675.08
IndicatorUnitOctober. 2018Jan.-Oct. 2018Change2017-2018 Alumina Consumption of Aluminumkg/ton1912.341912.731913.64 Total Recovery Rate of Aluminakg/ton78.0378.4878.56 Soda consumption of Aluminakg/ton168.96169.96159.61 Lead Total Recovery Rate of Lead Smelting%96.9796.9996.89 Recovery Rate of Lead Bullion%97.897.8797.73 Coal Consumption of Lead Bullionkg/ton232.2249.72256.59 Direct Current Consumption of Refined LeadkWh/ton119.42122.94124.44 Zinc Total Recovery Rate of Refined Zinc%95.7496.0595.71 Direct Current Consumption of Refined ZinckWh/ton30223075.153073.55 Tin Total Recovery Rate of Tin Smelting%9897.8597.68 Direct Current Consumption of Tin SmeltingkWh/ton1908.311909.991814.24 Coal Consumption of Tin Smeltingkg/ton1398.721480.821488.51 Nickel Total Recovery Rate of Nickel Smelting%9493.9994.01 Antimony Total Recovery Rate of Antimony Smelting%95.5396.4196.51 Direct Current Consumption of Antimony SmeltingkWh/ton1342.83839.681063.83 Yield of Processed Material Rate of Total Copper Products%79.6779.778.52 Copper Melting %95.8895.6795.38 Copper Processing Products%82.8883.0682.08 Rate of Total Aluminum Products%64.1564.7464.71 Aluminum Melting%87.2587.9486.9 Aluminum Processing Products%73.0673.6675.08
 China Nonferrous Metals Monthly2018年12期
- China Nonferrous Metals Monthly的其它文章
- Zinc Production by Province in 2018
- Copper Mine Production by Province or City in 2018
- Lead Production by Province or City in 2018
- Fabricated Copper Production by Province or City in 2018
- Production of the Ten Major Nonferrous Metals in 2018
- Alumina Production by Province in 2018