
Technical and Economic Indicators of Major Enterprise
2018-10-22 02:55:22ChinaNonferrousMetalsIndustryAssociation
China Nonferrous Metals Monthly 2018年10期
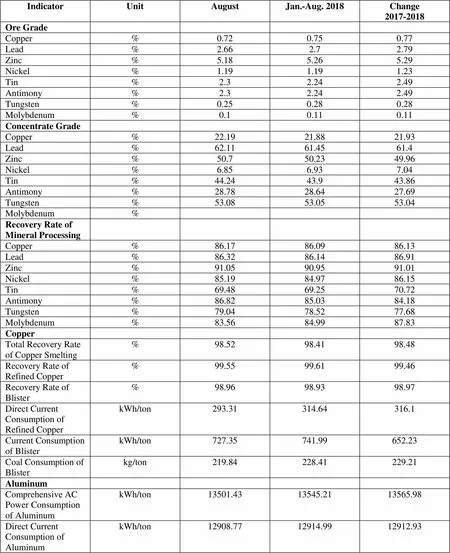
IndicatorUnitAugustJan.-Aug. 2018Change2017-2018 Ore Grade Copper%0.720.750.77 Lead%2.662.72.79 Zinc%5.185.265.29 Nickel%1.191.191.23 Tin%2.32.242.49 Antimony%2.32.242.49 Tungsten%0.250.280.28 Molybdenum%0.10.110.11 Concentrate Grade Copper%22.1921.8821.93 Lead%62.1161.4561.4 Zinc%50.750.2349.96 Nickel%6.856.937.04 Tin%44.2443.943.86 Antimony%28.7828.6427.69 Tungsten%53.0853.0553.04 Molybdenum% Recovery Rate of Mineral Processing Copper%86.1786.0986.13 Lead%86.3286.1486.91 Zinc%91.0590.9591.01 Nickel%85.1984.9786.15 Tin%69.4869.2570.72 Antimony%86.8285.0384.18 Tungsten%79.0478.5277.68 Molybdenum%83.5684.9987.83 Copper Total Recovery Rate of Copper Smelting%98.5298.4198.48 Recovery Rate of Refined Copper%99.5599.6199.46 Recovery Rate of Blister%98.9698.9398.97 Direct Current Consumption of Refined CopperkWh/ton293.31314.64316.1 Current Consumption of BlisterkWh/ton727.35741.99652.23 Coal Consumption of Blisterkg/ton219.84228.41229.21 Aluminum Comprehensive AC Power Consumption of AluminumkWh/ton13501.4313545.2113565.98 Direct Current Consumption of AluminumkWh/ton12908.7712914.9912912.93
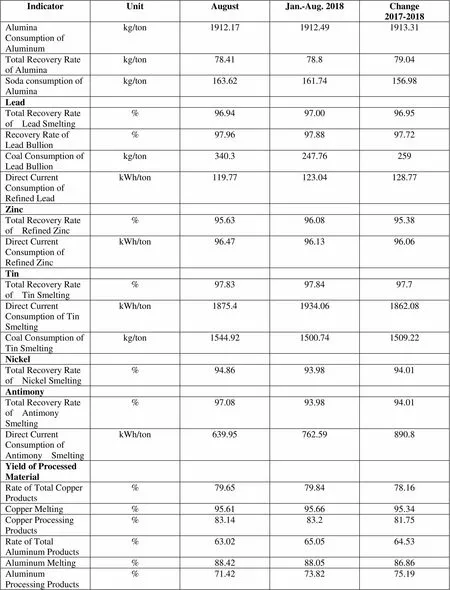
IndicatorUnitAugustJan.-Aug. 2018Change2017-2018 Alumina Consumption of Aluminumkg/ton1912.171912.491913.31 Total Recovery Rate of Aluminakg/ton78.4178.879.04 Soda consumption of Aluminakg/ton163.62161.74156.98 Lead Total Recovery Rate of Lead Smelting%96.9497.0096.95 Recovery Rate of Lead Bullion%97.9697.8897.72 Coal Consumption of Lead Bullionkg/ton340.3247.76259 Direct Current Consumption of Refined LeadkWh/ton119.77123.04128.77 Zinc Total Recovery Rate of Refined Zinc%95.6396.0895.38 Direct Current Consumption of Refined ZinckWh/ton96.4796.1396.06 Tin Total Recovery Rate of Tin Smelting%97.8397.8497.7 Direct Current Consumption of Tin SmeltingkWh/ton1875.41934.061862.08 Coal Consumption of Tin Smeltingkg/ton1544.921500.741509.22 Nickel Total Recovery Rate of Nickel Smelting%94.8693.9894.01 Antimony Total Recovery Rate of Antimony Smelting%97.0893.9894.01 Direct Current Consumption of Antimony SmeltingkWh/ton639.95762.59890.8 Yield of Processed Material Rate of Total Copper Products%79.6579.8478.16 Copper Melting %95.6195.6695.34 Copper Processing Products%83.1483.281.75 Rate of Total Aluminum Products%63.0265.0564.53 Aluminum Melting%88.4288.0586.86 Aluminum Processing Products%71.4273.8275.19
 China Nonferrous Metals Monthly2018年10期
- China Nonferrous Metals Monthly的其它文章
- Zinc Production by Province in 2018
- Copper Mine Production by Province or City in 2018
- Lead Production by Province or City in 2018
- Fabricated Copper Production by Province or City in 2018
- Production of the Ten Major Nonferrous Metals in 2018
- Nickel Production by Province or City in 2018