The Study of the Graft Hemodynamics with Different Instant Patency in Coronary Artery Bypassing Grafting
Zhou Zhao , Boyan Mao , Youjun Liu Haisheng Yang and Yu Chen
Abstract: In coronary artery bypass grafting (CABG), graft’s poor instant patency may lead to an abnormal hemodynamic environment in anastomosis, which could further cause graft failure after the surgery. This paper investigates the graft hemodynamics with different instant patency, and explores its effect on graft postoperative efficiency. Six CABG 0D/3D coupling multi-scale models which used left internal mammary artery(LIMA) and saphenous vein (SVG) as grafts were constructed. Different types of grafts were examined in the models, including normal grafts, grafts with competitive flow and grafts with anastomotic stenosis. Simulation results indicated that comparing with SVG grafts, there was a greater difference between normal LIMA graft and non-patent LIMA graft. Also, the backflow occurred even in LIMA systolic flow. The wall shear stress(WSS) in the graft of the competitive flow LIMA model had an appreciable decrease comparing with the normal graft. In addition, the WSS in the stenosis region of the anastomotic stenosis LIMA model was much higher than its adjacent regions. In contrast,the WSS distributions in the SVG models were much smoother than in the LIMA models.For oscillatory shear index (OSI), there was little difference between normal LIMA and SVG. But when the graft had competitive flow or anastomotic stenosis, much higher OSI occurred in some regions in LIMA than SVG. There are significant differences in hemodynamics between normal grafts and non-patent grafts both in LIMA and SVG. The hemodynamic environment in a normal LIMA is better than that in a normal SVG.However, in the situation of the two types of non-patent grafts, the hemodynamics of SVG is better than LIMA.
Keywords: Coronary artery bypass grafting, instant patency, graft flow, hemodynamics,multi-scale model
1 Introduction
Coronary artery bypass grafting (CABG) is a common surgery to cure coronary heart disease [Beck (1935); Vineberg (1948)]. The graft bypasses the coronary stenosis and supplies blood to the distal coronary. This surgery could decrease the risk of myocardial ischemia. However, as a common postoperative problem, the graft’s poor instant patency will reduce the surgical effect and lead to a new revascularization. Instant patency means the graft’s ability to supply the blood when it is just anastomosed. Currently, surgeons use transit time flow-meter (TTFM) to measure every graft’s flow wave after the surgery to predict graft’s patency [Acipayam, Uncu, Taraktas et al. (2015); Handa, Orihashi,Nishimori et al. (2016); Lehnert, M? ller, Damgaard et al. (2015)]. Low average flow rate,high pulsating index and low diastolic velocity time integral fraction would indicate a poor instant patency of a graft [Tokuda, Song, Ueda et al. (2007); Kim, Chang and Lim(2005); Papadopoulou, Spengos, Papapostolou et al. (2006)].
The causes of a graft’s poor instant patency could have two aspects; one is the anastomotic stenosis and the other is competitive flow [Sabik, Lytle, Blackstone et al. (2003); Pagni,Storey, Ballen et al. (1997)]. The anastomotic stenosis is often caused by operation errors,and can be corrected by removing the graft and redoing the surgery. The competitive flow happens because of non-severity stenosis on native coronary artery, which also has the ability to supply blood to distal coronary artery. The blood from the native coronary artery“competes” the blood from the graft and makes the graft flow decrease. The competitive flow will make the graft non-patency and cause so called “string phenomenon” if it is serious. The non-patency caused by competitive flow could not be corrected by redoing the surgery, and thus it requires choice of another surgery strategy [Villareal and Mathur(2000); Barner (1974); Seki, Kitamura, Kawachi et al. (1992)].
Hemodynamics is the key factor to influence the graft patency. Graft failure is mainly caused by atherosclerosis and intimal hyperplasia [Whittemore, Clowes, Couch et al.(1981); Butany, David and Ojha (1998)], and risk hemodynamic factors are seen as the most important factor to trigger them [Bassiouny, White, Glagov et al. (1992); Hofer,Rappitsch, Perktold et al. (1996)]. In end-to-side anastomotic structure, researches show that intimal hyperplasia mostly occurs in the heel of anastomosis, the graft bottom and the toe of anastomosis where the disturbed flow is serious [Sottiurai, Yao, Batson et al.(1989); Ojha, Cobbold and Johnston (1994)]. The hemodynamic risk factors include low wall shear stress (WSS), high wall shear stress gradient (WSSG) and high oscillatory shear index (OSI). Based on these facts, the objective of this paper is to study the hemodynamics in graft anastomosis with variable instant patency, and explore the effects to the postoperative graft efficiency.
Due to the complex condition in realistic surgery, it is dangerous and not ethical to take the experiment in patients. For this reason, the present study is designed to construct CABG models and uses numerical calculation approaches. In order to focus on details of surgery spot and provide an accurate boundary condition at the same time, the multi-scale model is considered for this study [Sankaran, Esmaily, Kahn et al. (2012); Taylor, Fonte and Min(2013)]. The general approach of the multi-scale modeling is to couple different dimensional models, such as 0D and 3D models, which have been used in examining hemodynamics and its effectiveness previously by our group [Zhao, Liu, Li et al. (2015); Li,Liu, Zhao et al. (2016); Mao, Wang, Zhao et al. (2016); Wang, Mao, Wang et al. (2016)].
The left anterior descending branch (LAD) stenosis was chosen for modeling and left internal mammary artery graft (LIMA) and saphenous vein graft (SVG) were investigated. Based on the two grafts, three types of CABG models with different graft patency were constructed.
2 Method
2.1 Construction of 3D CABG model
In this study, a 3D model of a coronary system with an aortic arch was reconstructed from CT data. The CT data was from a 55 years old male patient whose cardiac output was 4.6 L/min, systolic pressure was 147 mmHg and diastolic pressure was 103 mmHg.The CT image had 460 slices, 512*512 pixels in each slice. The distance of two adjacent slices was 1mm. The Mimics software was used to complete the 3D reconstruction of CT images, and distinguish the coronary and aortic arch regions by thresholding segmentation. The Freeform software was used to smooth the model and complete the LIMA bypass grafting as well as the SVG bypass grafting. The LIMA diameter was set as 3 mm and the SVG diameter as 5 mm. The anastomosis position and angle of the LIMA and SVG grafts met the surgeon’s suggestion. Based on the two types of grafts,three types of models were built, including a normal model with LAD stenosis rate of 90%, a competitive flow model with LAD stenosis rate of 50% and an anastomotic stenosis model with anastomotic stenosis rate of 50% according to a 90% stenosis in LAD. Finally, there are six reconstructed 3D models shown as Fig. 1 and Fig. 2.
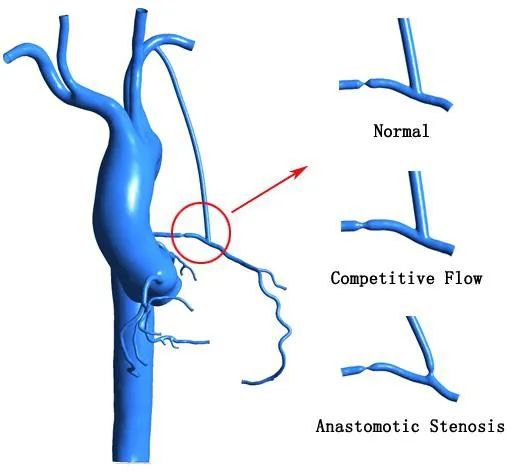
Figure 1: LIMA Bypass grafting models which include the Normal model, Competitive flow model and Anastomotic stenosis model
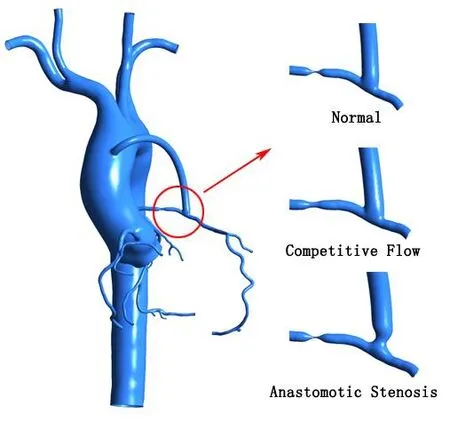
Figure 2: SVG Bypass grafting models which include the Normal model, Competitive flow model and Anastomotic stenosis model
These six models were meshed by ANSYS ICEM CFD software. All of these models used the hexahedral meshing method and passed sensitivity analysis. Fig. 3 shows the meshes in one of these models, and the number of nodes and elements are listed in Tab. 1.In this simulation, the vessel wall was set up as rigid wall which was impermeable and non-slip. The blood material property was set up as incompressible Newtonian fluid, for which the density was 1050 kg/m3and the dynamic viscosity was 0.0035 Pa s.

Table 1: The nodes and elements numbers of the 3D models
2.2 The lumped parameter model
Based on the similarity of blood vessel network and circuit network, the complex vessel system can be simplified as lumped parameter model. The solution of the lumped parameter model is based on solving the differential-algebraic equations controlled by Kirchhoff’s law. In the construction of the lumped parameter model, blood pressure,blood flow, flow resistance, vessel elasticity and inertia are simulated by voltage, current,resistance, capacitance, and inductance in the circuit, respectively. Some special components, such as diode and variable capacitance, could simulate the heart valve and ventricular motion. The lumped parameter model overcomes the shortcomings of the 3D model and can simulate a wider range of blood circulation systems [Abdi, Karimi,Navidbakhsh et al. (2015); Taylor and Draney (2004)].
The structure of the lumped parameter model in this study was come up with Taylor[Taylor, Fonte and Min (2013)], and had been used often before. Based on the patient’s 3D model, this study constructed a lumped parameter model shown as Fig. 4. This model mainly contained three parts, including cardiac part, systemic vessel part and coronary part.
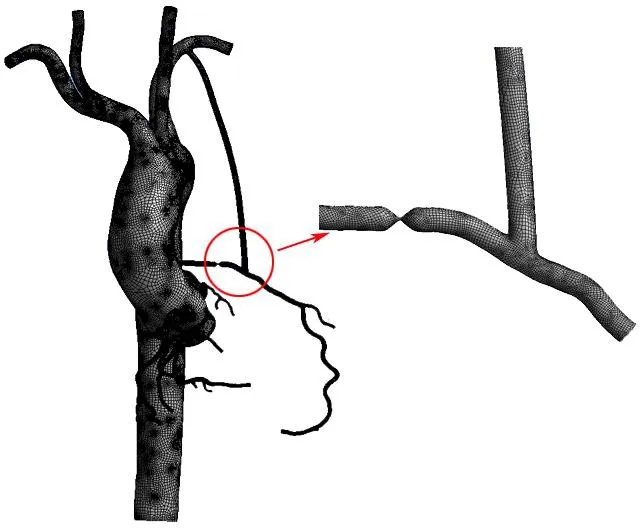
Figure 3: The mesh in the LIMA_Normal 3D model
As for cardiac part, a constant power source was used to simulate the left atrium pressure,two diodes were used to simulate mitral and aortic valves, the resistance and the inductance were used to simulate the blood resistance and inertia which flow through the valves. Variable capacitance C(t) was used to simulate the contraction of the left ventricle.The value is shown below:

Among the function (1), E(t) is a time-varying elastance which is calculated by:


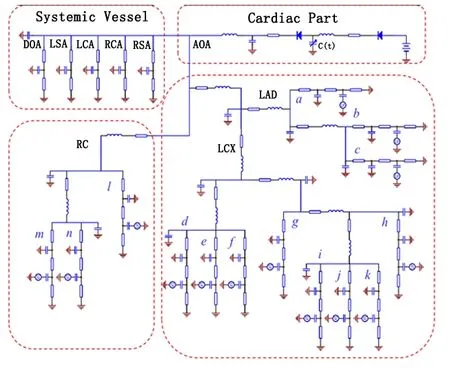
Figure 4: The lumped parameter model which contains Cardiac part, Systemic vessel part and Coronary part. LAD represents Left anterior descending branch, LCX represents Left circumflex branch and RC represents Right coronary artery
For the systemic vessel part, the proximal resistance represented arterial flow resistance,the distal resistance represented venous and microcirculation resistance, the capacitance represented the vascular elasticity.
For the coronary part, in coronary trunk (LAD, LCX, RC), its resistance, inductance and capacitance represented the flow resistance, flow inertia and vessel elasticity in coronary artery, respectively. While in coronary branch (a-n), its resistances from front to back represented coronary artery flow resistance, microcirculation resistance and coronary vein flow resistance. Its proximal capacitance represented coronary artery elasticity;distal capacitance represented the microcirculation elasticity. A power source whose value was linked to left ventricular pressure was connected to the distal capacitance.
The values of this lumped parameter model’s components were chosen based on Kim’s study [Kim, Vignonclementel, Coogan et al. (2010)], and were adjusted using genetic algorithm to make the cardiac output, systolic pressure and diastolic pressure of the model match realistic data [Li, Wang, Mao et al. (2018)]. The blood flow in every coronary branch was adjusted to meet the two principles provided by Kim et al. [Kim,Vignonclementel, Coogan et al. (2010)]. Total coronary blood flow accounts for 4% of cardiac output, and the blood flow in every coronary branch is proportional to its diameter.
2.3 0D/3D coupling multi-scale model
After constructing the 3D model and lumped parameter model, the last step was to couple them together to form the multi-scale model. Part of the lumped parameter model which can be replaced by 3D model was deleted, and the remaining part to the entrance of the 3D model was connected, as shown in Fig. 5.
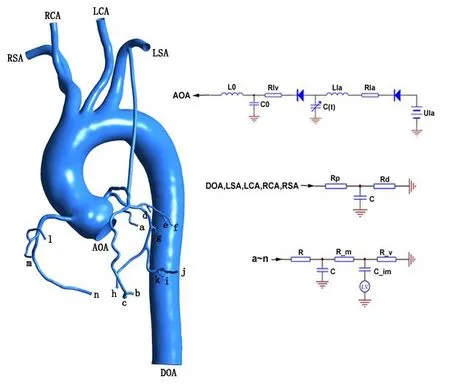
Figure 5: 0D/3D coupling multi-scale model
This study used a specific coupling algorithm and interface conditions to couple the lumped parameter model and the 3D model. The 3D model was calculated by ANSYSCFX, the lumped parameter was calculated by FORTRAN subroutines based on CFX Junction Box. The data transmission between lumped parameter model and 3D model was achieved using CFX User CEL Function. The lumped parameter model provided a flow in aorta and pressures in other arteries for 3D model, and the 3D model returned a pressure in aorta and flows in other arteries for the lumped parameter model.
3 Results
After completing the calculations, hemodynamics of the anastomotic site which is encircled by a red circle as shown in Fig. 6 were extracted. The flow waves in distal graft section, the WSS and OSI in anastomotic site were extracted.
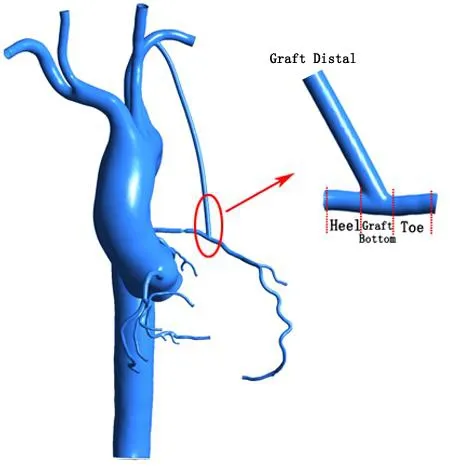
Figure 6: The anastomotic site which the Hemodynamics are extracted
3.1 The comparison of flow waves in distal grafts
The flow waves of distal grafts were extracted. The LIMA flow waves are shown as Fig. 7.For the LIMA graft, graft flow rate of the normal model was higher than anastomotic stenosis model, but their wave shapes were similar. However, the graft flow shape of competitive flow model had a significant difference with the normal model. Except for an obvious decrease in diastolic flow, there was even backflow in systolic period.
The SVG flow waves are shown as Fig. 8.
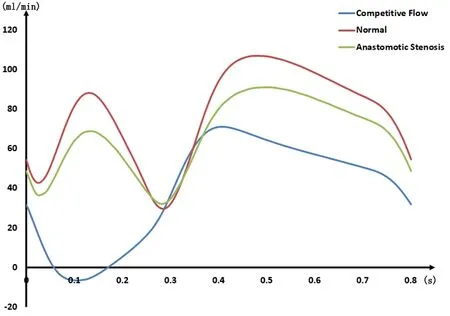
Figure 7: The flow waves in LIMA with different Instant patency

Figure 8: The flow waves in SVG with different Instant patency
For the SVG graft, the graft flow of anastomotic stenosis model was slightly lower than the normal model. The graft flow of competitive flow model was similar to the above two in diastolic period, while in systolic period and the interval between systole and diastole the flow was significantly different. The peak flow in systolic period was significantly lower than that in the normal and the anastomotic stenosis. But in the interval between systole and diastole the flow was much higher. Different from the LIMA, there was no backflow in the SVG.
The results for comparing the average flow rates in these six models are shown in Tab. 2.It could be seen that the difference between non-patent graft and normal graft in LIMA was larger than in SVG. Especially in LIMA competitive flow model, the flow rate reduced 38 ml/min compared with the normal model.

Table 2: The comparison of average flow rate
3.2 The WSS in anastomotic site
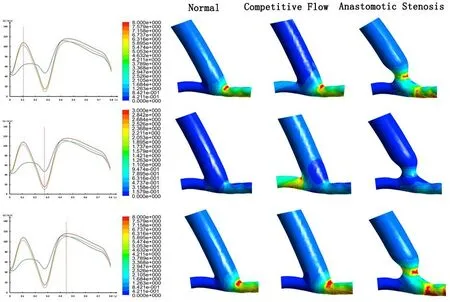
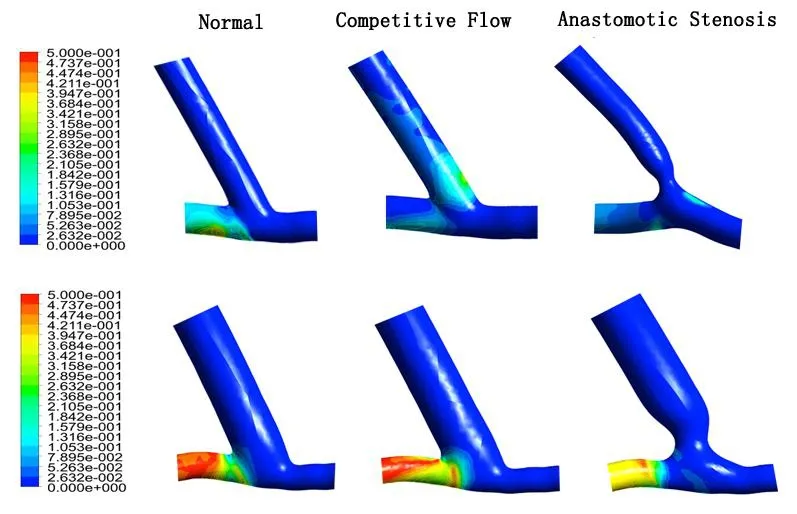
The WSS in anastomotic site were extracted and shown in Fig. 9 and Fig. 10. Based on the time corresponding to the graft flow of the normal model, the WSS contours were depicted. According to Malek’s studies [Malek, Alper and Izumo (1999)], hemodynamic environment is harmful in the region where WSS<0.4 Pa (low WSS region) or WSS>7 Pa(high WSS region), it is appropriate in the region where 1 Pa For LIMA, in systolic peak flow time, the normal model graft’s heel was at low WSS region while the graft bottom and toe were at appropriate WSS region. In competitive flow model, its distal graft was at low WSS region, and its heel and toe had some high WSS regions. In anastomotic stenosis model, there was a significant high WSS region in stenosis part, and other parts in this model were at appropriate region or transition region.In the interval between systole and diastole, the normal model graft’s heel was at low WSS region while other parts were at transition region. In competitive flow model, heel,graft bottom and toe all had some low WSS regions. In anastomotic stenosis model,stenosis part was at high WSS region while other parts were at low WSS region or transition region. In diastolic peak flow time, the normal model’s WSS distribution was similar to the above two models. In competitive flow model, there was a high WSS region in the toe. In anastomotic model, it was also similar to the above two models. For SVG, in systolic peak flow time, the normal model’s distal graft was at transition region, the heel was at low WSS region and there were some high WSS regions in the toe part. In competitive flow model, its distal graft was at low WSS region while the toe had some high WSS regions. In anastomotic stenosis model, its heel was at low WSS region while the toe had some high WSS regions. In the interval between systole and diastole, the normal model was at low WSS region. In competitive flow model, the heel was at appropriate region while other parts were at transition region. In anastomotic stenosis model, the stenosis part and the toe were at transition region, other parts were at low WSS region. In diastolic peak flow time, the normal model’s WSS distribution was similar to the corresponding one in systolic peak flow time. In competitive flow model, its distal graft was at transition region, the heel was at low WSS region and the toe had some high WSS regions. In anastomotic stenosis model, WSS distribution was similar to the corresponding one in systolic peak flow time. Figure 9: WSS contours at different times in LIMA Figure 10: WSS contours at Different times in SVG OSI is an important hemodynamic factor influencing graft patency. High OSI could lead to atherosclerosis and intimal hyperplasia. The function of OSI is shown below: n means WSS. OSI contours were extracted from these six models, shown in Fig. 11. Figure 11: OSI contours. The above is LIMA Anastomotic site, the below is SVG Anastomotic site For LIMA, the normal model’s heel was at high OSI region, the competitive flow model’s graft bottom had some high OSI regions and the anastomotic stenosis model’s toe had some high OSI regions. For SVG, the normal model and the anastomotic stenosis model only had high OSI regions in their heel. But in competitive flow model, except for heel, there was also a little high OSI region in graft bottom. This patient’s model has been often used in the author’s group to study the CABG topic[Zhao, Liu, Li et al. (2015); Li, Liu, Zhao et al. (2016); Mao, Wang, Zhao et al. (2016)].In order to maintain consistency of these series of studies, the patient’s model is been used again. The LAD is one of the most possible branches that the stenosis could occur and can be bypassed by LIMA or SVG, so the LAD is chosen to set the stenosis.According to the surgeon’s suggestion, the anastomosis position and angle of the LIMA and SVG grafts are set as Fig. 1 and Fig. 2. In a normal situation, both LIMA and SVG graft flows present a double peak flow waveform in systole and diastole. Because of the difference in graft diameter and proximal anastomosis location, the flow rate of SVG graft is higher than that of LIMA graft. When the graft is not patent, whether due to competitive flow or anastomotic stenosis, the decrease of flow rate in LIMA is more than that in SVG. This reflects that the resistance to adverse condition in SVG is better than LIMA. It also should be noted that the competitive flow influence in LIMA is more significant. Not only the LIMA graft flow rate has an obvious decrease, but also the backflow occurs in its systolic period. The occurrence of backflow in graft reveals that risk hemodynamics exist in anastomosis,which will greatly reduce the life of the graft. By comparing the normal model’s anastomosis WSS in LIMA and SVG, it can be found that the whole anastomotic site is at appropriate WSS region except the heel at the time of two peak flow. The heel is at anastomosis upstream and its hemodynamics has little influence for graft blood supplying. But for SVG, the distal graft WSS is at transition region and the toe has some high WSS regions. This means from the perspective of WSS,the SVG hemodynamic environment is worse than LIMA when the anastomosis is in normal situation. However, when the graft instant patency is adverse, the situation has changed. In both of the situations which the graft is non-patent, the SVG’s WSS distribution is similar to the normal. But for LIMA, when the competitive flow exists, there is a high WSS region in the toe at the times of peak flow. And at the time of systolic peak flow, the graft has a big area of low WSS. This means when the competitive flow occurs, the whole graft is liable to be influenced by adverse hemodynamics, and lead to the graft failure. If there is an anastomotic stenosis, the stenosis part may have an obvious high WSS region, which could lead to thrombus formation and block the anastomosis. In summary, although LIMA’s WSS environment is better than SVG in normal situation,the SVG has a better ability to avoid the risk WSS environment when the instant patency is adverse. In normal situation, the LIMA and the SVG’s high OSI regions exist in the heel which has little influence for graft blood supplying. When the competitive flow exists, LIMA graft bottom has a big area of high OSI, while SVG graft bottom only has a small area of high OSI. And in anastomotic stenosis situation, there is high OSI region in the toe of LIMA, while there is not in SVG. These results also show that when the instant patency is adverse, SVG has a better ability to avoid risk OSI environment than LIMA. It is found that there are significant differences in hemodynamics between a normal graft and non-patent grafts both in LIMA and SVG. In the normal graft, the LIMA hemodynamic environment is better than that in SVG. But in non-patent graft, SVG has a better ability to avoid the adverse hemodynamic environment. These results suggest that surgeries should be performed carefully to avoid instant nonpatency of LIMA. Meanwhile, when the coronary artery has a moderate stenosis, SVG should be used as the graft to avoid the influence of competitive flow. Acknowledgement:This work is supported by National Natural Science Foundation of China (11832003, 11772016, 11472022, 11702008).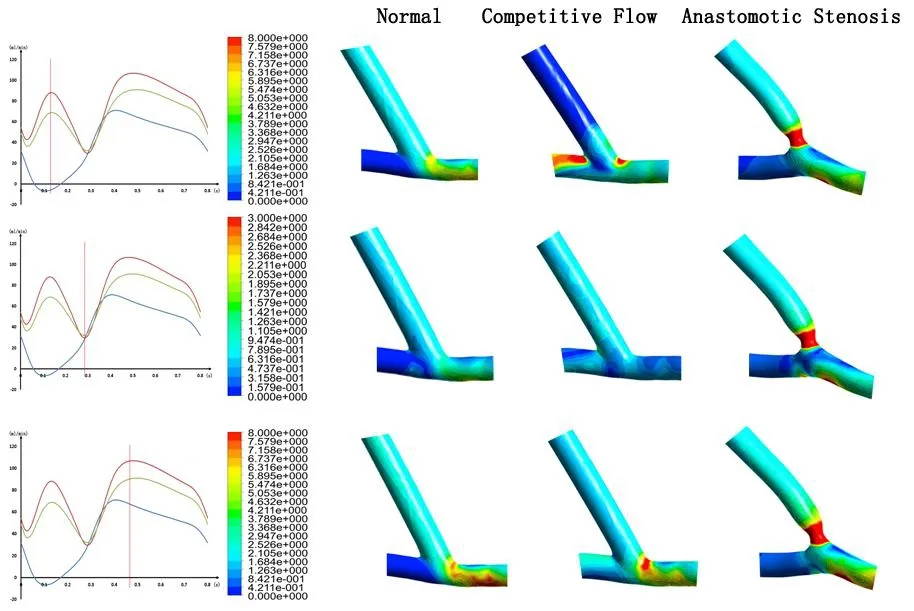
3.3 The OSI in anastomotic site

4 Discussion
4.1 The model selection
4.2 The distal graft flow
4.3 WSS in anastomotic site
4.4 OSI in anastomotic site
5 Conclusion
 Computer Modeling In Engineering&Sciences2018年8期
- Computer Modeling In Engineering&Sciences的其它文章
- Fluid-Structure Interaction Simulation of Aqueous Outflow System in Response to Juxtacanalicular Meshwork Permeability Changes with a Two-Way Coupled Method
- A Numerical Investigation of the Effects of Benign Paroxysmal Positional Vertigo on the Balance Function of the Inner Ear
- A Numerical Study of Passive Receptor-Mediated Endocytosis of Nanoparticles: The Effect of Mechanical Properties
- Mechanical Strength and Structural Basis of β2 Integrin to Mediate Neutrophil Accumulation on Liver Sinusoidal Endothelial Cells: A Study Using Atomic Force Microscopy and Molecular Dynamics Simulations
- The Hemodynamic Comparative Study Between Pulsatile and Non-Pulsatile VA ECMO: A Primary Numerical Study
- Numerical Analyses of Idealized Total Cavopulmonary Connection Physiologies with Single and Bilateral Superior Vena Cava Assisted by an Axial Blood Pump
