
Technical and Economic Indicators of Major Enterprise
2018-08-13 06:14:40ChinaNonferrousMetalsIndustryAssociation
China Nonferrous Metals Monthly 2018年7期
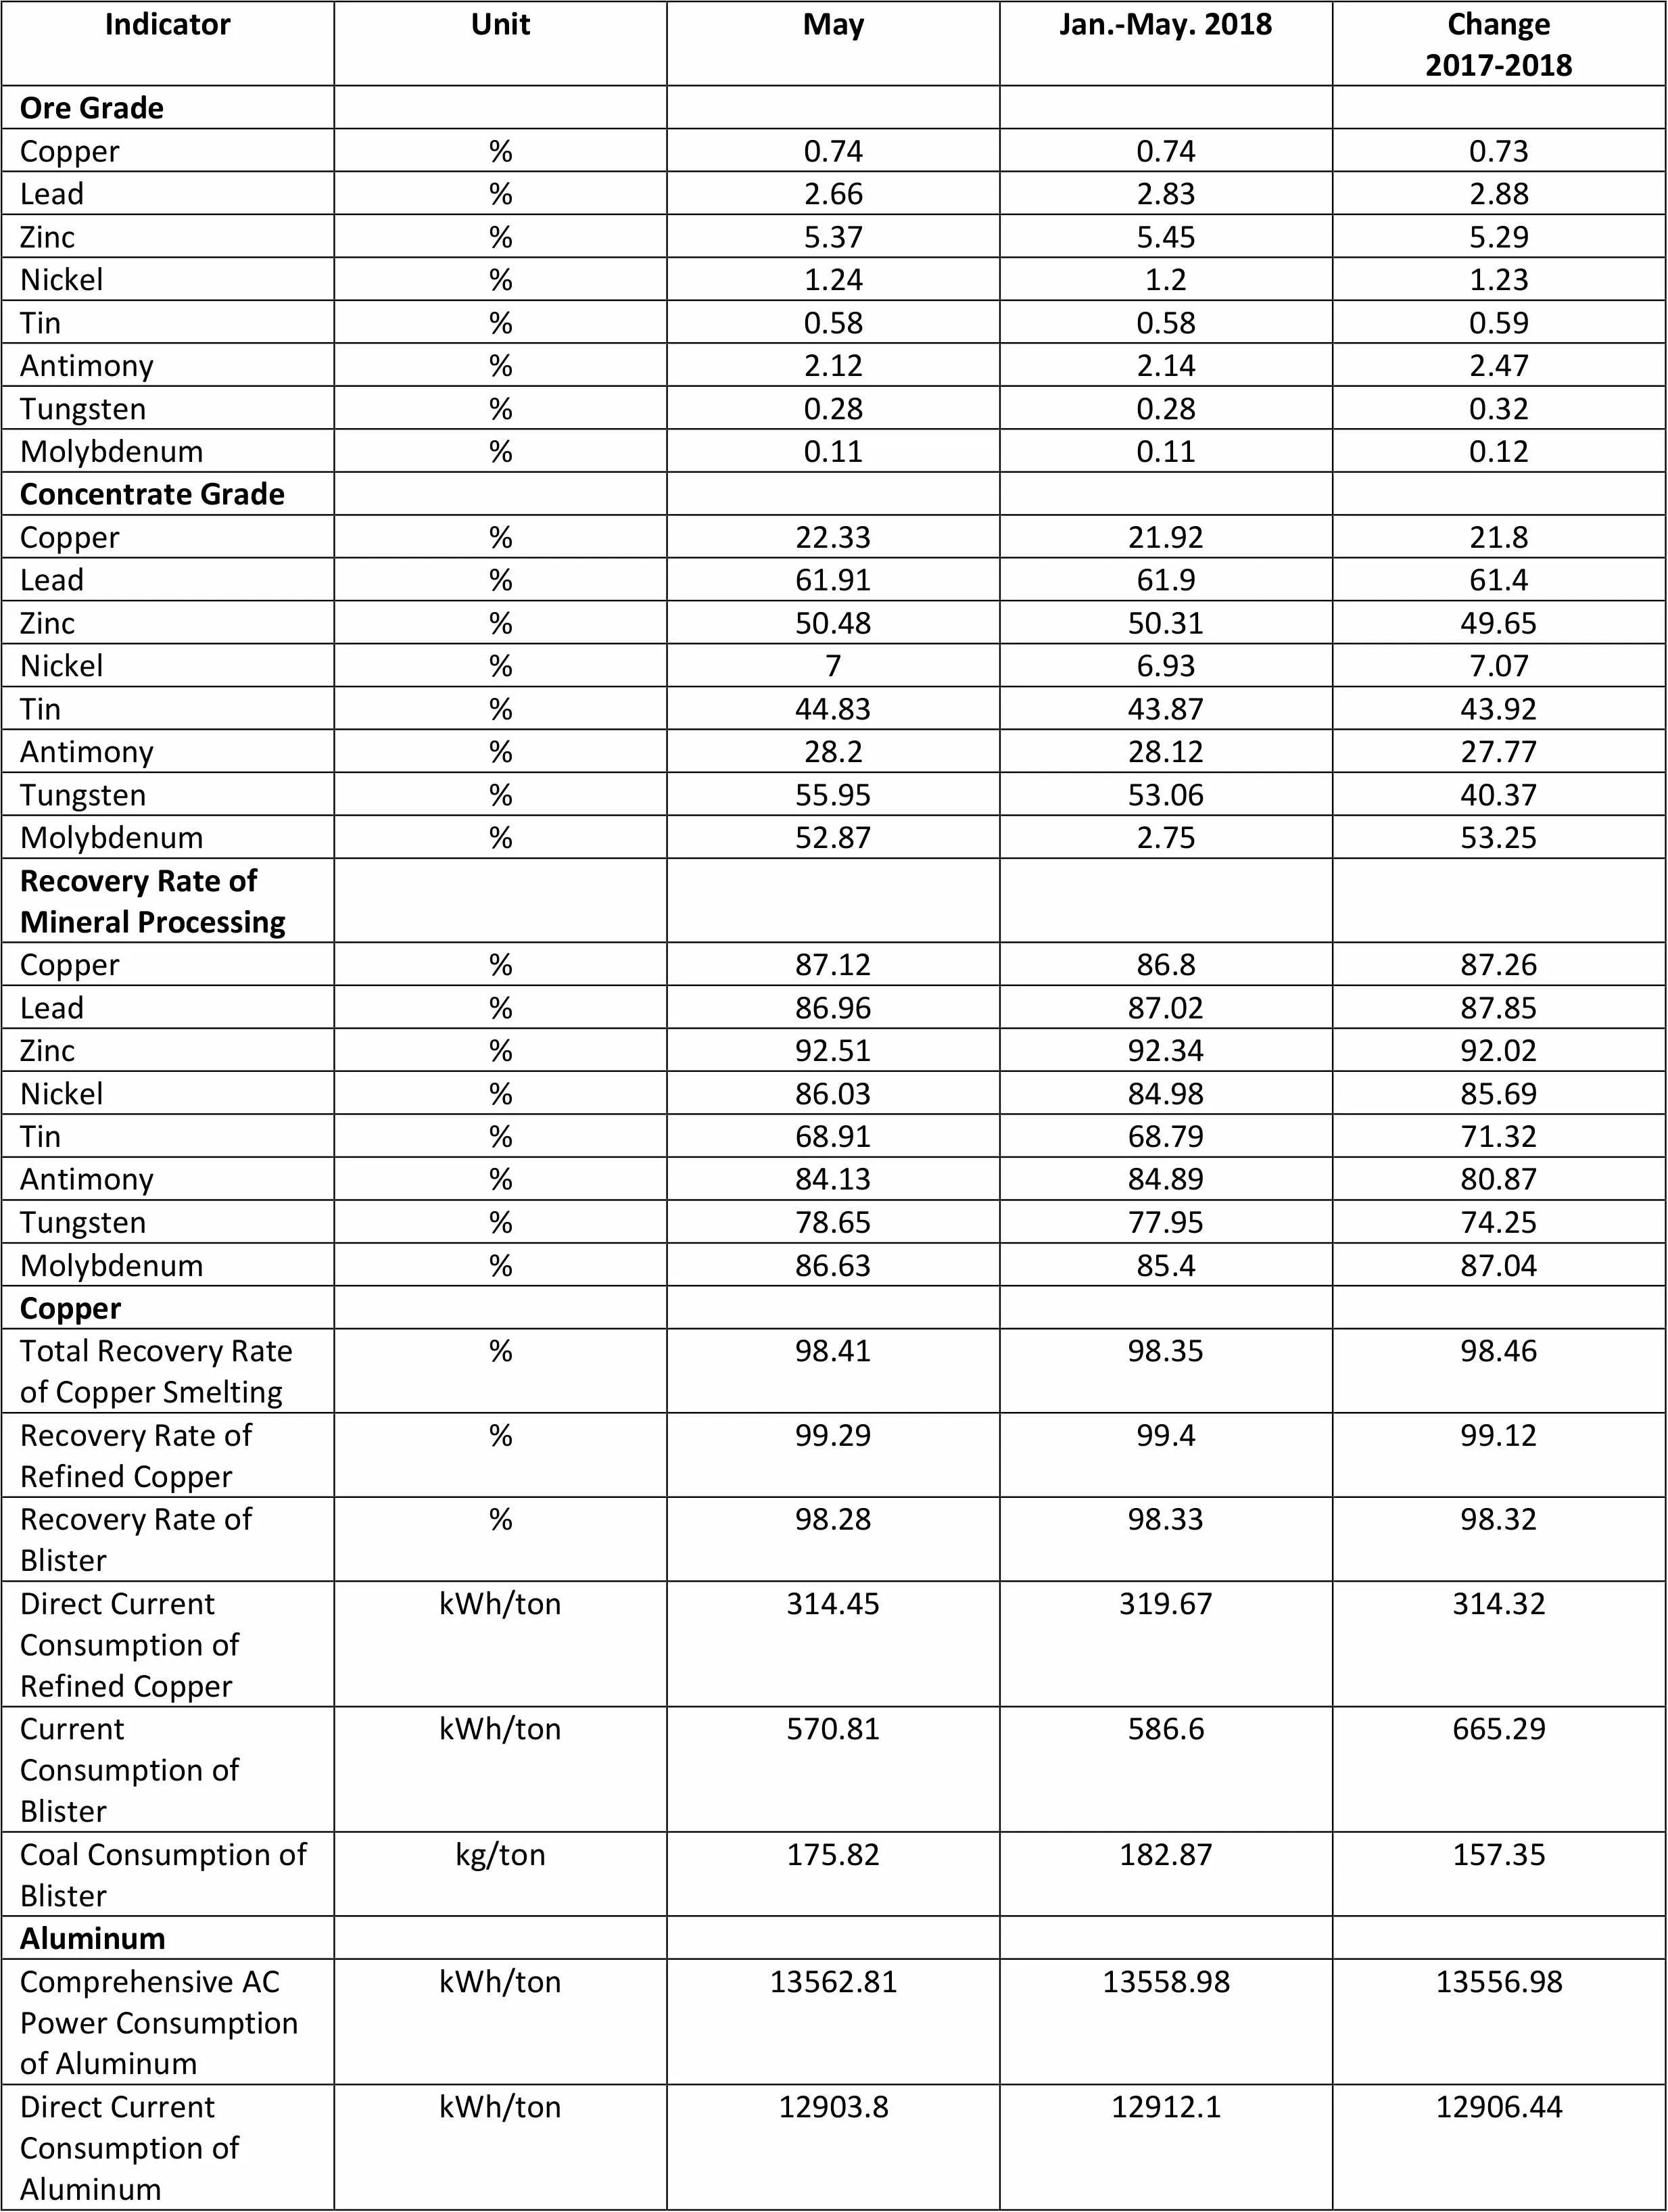
IndicatorUnitMayJan.-May. 2018Change2017-2018 Ore Grade Copper%0.740.740.73 Lead%2.662.832.88 Zinc%5.375.455.29 Nickel%1.241.21.23 Tin%0.580.580.59 Antimony%2.122.142.47 Tungsten%0.280.280.32 Molybdenum%0.110.110.12 Concentrate Grade Copper%22.3321.9221.8 Lead%61.9161.961.4 Zinc%50.4850.3149.65 Nickel%76.937.07 Tin%44.8343.8743.92 Antimony%28.228.1227.77 Tungsten%55.9553.0640.37 Molybdenum%52.872.7553.25 Recovery Rate of Mineral Processing Copper%87.1286.887.26 Lead%86.9687.0287.85 Zinc%92.5192.3492.02 Nickel%86.0384.9885.69 Tin%68.9168.7971.32 Antimony%84.1384.8980.87 Tungsten%78.6577.9574.25 Molybdenum%86.6385.487.04 Copper Total Recovery Rate of Copper Smelting%98.4198.3598.46 Recovery Rate of Refined Copper%99.2999.499.12 Recovery Rate of Blister%98.2898.3398.32 Direct Current Consumption of Refined CopperkWh/ton314.45319.67314.32 Current Consumption of BlisterkWh/ton570.81586.6665.29 Coal Consumption of Blisterkg/ton175.82182.87157.35 Aluminum Comprehensive AC Power Consumption of AluminumkWh/ton13562.8113558.9813556.98 Direct Current Consumption of AluminumkWh/ton12903.812912.112906.44
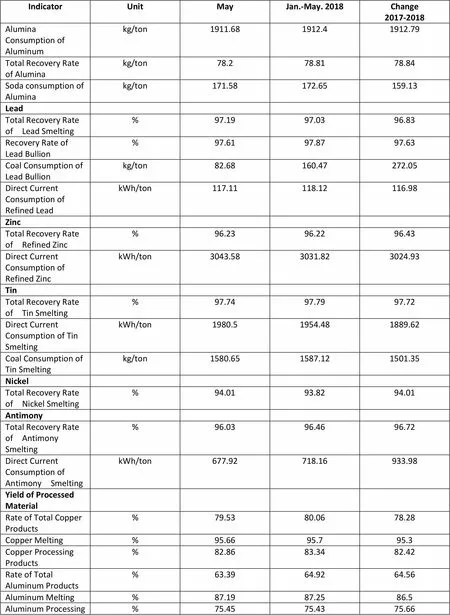
IndicatorUnitMayJan.-May. 2018Change2017-2018 Alumina Consumption of Aluminumkg/ton1911.681912.41912.79 Total Recovery Rate of Aluminakg/ton78.278.8178.84 Soda consumption of Aluminakg/ton171.58172.65159.13 Lead Total Recovery Rate of Lead Smelting%97.1997.0396.83 Recovery Rate of Lead Bullion%97.6197.8797.63 Coal Consumption of Lead Bullionkg/ton82.68160.47272.05 Direct Current Consumption of Refined LeadkWh/ton117.11118.12116.98 Zinc Total Recovery Rate of Refined Zinc%96.2396.2296.43 Direct Current Consumption of Refined ZinckWh/ton3043.583031.823024.93 Tin Total Recovery Rate of Tin Smelting%97.7497.7997.72 Direct Current Consumption of Tin SmeltingkWh/ton1980.51954.481889.62 Coal Consumption of Tin Smeltingkg/ton1580.651587.121501.35 Nickel Total Recovery Rate of Nickel Smelting%94.0193.8294.01 Antimony Total Recovery Rate of Antimony Smelting%96.0396.4696.72 Direct Current Consumption of Antimony SmeltingkWh/ton677.92718.16933.98 Yield of Processed Material Rate of Total Copper Products%79.5380.0678.28 Copper Melting %95.6695.795.3 Copper Processing Products%82.8683.3482.42 Rate of Total Aluminum Products%63.3964.9264.56 Aluminum Melting%87.1987.2586.5 Aluminum Processing Products%75.4575.4375.66

IndicatorUnitMayJan.-May. 2018Change2017-2018 Alumina Consumption of Aluminumkg/ton1911.681912.41912.79 Total Recovery Rate of Aluminakg/ton78.278.8178.84 Soda consumption of Aluminakg/ton171.58172.65159.13 Lead Total Recovery Rate of Lead Smelting%97.1997.0396.83 Recovery Rate of Lead Bullion%97.6197.8797.63 Coal Consumption of Lead Bullionkg/ton82.68160.47272.05 Direct Current Consumption of Refined LeadkWh/ton117.11118.12116.98 Zinc Total Recovery Rate of Refined Zinc%96.2396.2296.43 Direct Current Consumption of Refined ZinckWh/ton3043.583031.823024.93 Tin Total Recovery Rate of Tin Smelting%97.7497.7997.72 Direct Current Consumption of Tin SmeltingkWh/ton1980.51954.481889.62 Coal Consumption of Tin Smeltingkg/ton1580.651587.121501.35 Nickel Total Recovery Rate of Nickel Smelting%94.0193.8294.01 Antimony Total Recovery Rate of Antimony Smelting%96.0396.4696.72 Direct Current Consumption of Antimony SmeltingkWh/ton677.92718.16933.98 Yield of Processed Material Rate of Total Copper Products%79.5380.0678.28 Copper Melting %95.6695.795.3 Copper Processing Products%82.8683.3482.42 Rate of Total Aluminum Products%63.3964.9264.56 Aluminum Melting%87.1987.2586.5 Aluminum Processing Products%75.4575.4375.66
 China Nonferrous Metals Monthly2018年7期
- China Nonferrous Metals Monthly的其它文章
- Zinc Production by Province in 2018
- Copper Mine Production by Province or City in 2018
- Lead Production by Province or City in 2018
- Fabricated Copper Production by Province or City in 2018
- Production of the Ten Major Nonferrous Metals in 2018
- Nickel Production by Province or City in 2018