
Multi-focus image fusion via morphological similarity-based dictionary construction and sparse representation
2018-07-04 01:28:08GuanqiuQiQiongZhangFanchengZengJinchuanWangZhiqinZhu
Guanqiu Qi?,Qiong Zhang ,Fancheng Zeng ,Jinchuan Wang ,Zhiqin Zhu
1College of Automation,Chongqing University of Posts and Telecommunications,Chongqing 400065,People’s Republic of China
2School of Computing,Informatics,and Decision Systems Engineering,Arizona State University,Tempe,AZ 85287,USA
1 Introduction
Cloud computing provides more powerful computation resources to process various images[1–4].Owing to the limited depth-of-focus of optical lenses,the blurred objects always appear in the captured images.It is difficult to capture all-in-focus image in one scene[5,6].As the development of image processing techniques,multi-focus fusion is widely used to combine complementary information from multiple out-of-focus images.
In this decade,multi-focus image fusion is a hot research topic,and many related methods have been proposed and implemented[5–8].Multi-scale transform(MST)-based methods are widely used in multi-focus image fusion.
Among image pixel transformation methods,wavelet transform[9,10],shearlet[11,12],curvelet[13],dual tree complex wavelet transform [14,15],and non-subsampled controulet transform(NSCT)[16]are commonly used to represent image features in MST-based methods.In the transformation process,image features are resolved into MST bases and coefficients.The fusion process of MST-based methods consists of two steps.One is the fusion of coefficients,and the other is the transformation of fused coefficients.Different methods have their own focuses,thus it is difficult to represent all features of source images in a single method.
In recent years,sparse representation(SR)-based image fusion has resolved the limitations of MST-based method.Compared with MST-based method,the fusion process of SR-based method is similar.However,SR-based method usually uses trained dictionary to adaptively represent image features.Thus,SR-based method can better describe detailed information of images to reinforce the effect of fused image.As the most commonly used method,K-means generalised singular value decomposition (KSVD)algorithm is applied to SR-based image fusion[17–19].Yin et al.[17]proposed a KSVD-based dictionary learning method and a hybrid fusion rule to improve the quality of multi-focus image fusion.Nejati et al.[18]also proposed a multi-focus image fusion method based on KSVD.He optimised the learning process of KSVD to enhance the performance of multi-focus image fusion.According to image features,Kim et al.[20]proposed a clustering-based dictionary learning method to train a more informative dictionary.The trained dictionary can better describe image features,and improve the fusion performance.Zhang introduced a non-negative SR model to improve the detailed performance in image fusion[21].Li et al.[22]proposed a group dictionary learning method to extract different features from different image feature groups.This method can improve the accuracy of SR-based fusion,and obtain better fusion effect.Ibrahim et al.[23]used robust principal component analysis to build a compact dictionary for SR-based multi-focus image fusion.The previously introduced SR-based methods have showed the state-of-the-art performance in multi-focus image fusion these years.However,the aforementioned methods do not consider morphological information of image features in dictionary learning processes.
This paper analyses morphological information of source images to do dictionary learning.Based on the morphological similarity,a different type of image information is processed,respectively,to increase the accuracy of SR-based dictionary learning.Geometric information,such as edge and sharp line information,is extracted from source image blocks, and classified into different image-block groups to construct the corresponding dictionaries by sparse coding.
There are two main contributions in this paper as follows:
(i)Morphological information of source images is classified into different image patch groups to train corresponding dictionaries, respectively. Each classified image patch group contains more detailed morphological information of source images.
(ii)It proposes a principle component analysis(PCA)-based method to construct an informative and compact dictionary.PCA method is employed to reduce the dimension of each image patch group and obtain informative image bases.The informative feature of trained dictionary not only ensures the accurate description of source images,but also decreases the computation cost of SR.
The rest sections of this paper are structured as follows:Section 2 proposes the geometric similarity-based dictionary learning method and SR-based multi-focus image fusion framework;Section 3 compares and analyses the results of comparative experiments;and Section 4 concludes this paper.
2 SR-based image fusion framework
2.1 Dictionary learning in image fusion
For dictionary learning,it is important to build an over-complete dictionary that not only has a relatively small size,but also contains the key information of source images.
KSVD[19],online dictionary learning[24],and Stochastic gradient descent[25]are popular dictionary learning methods.This paper applies PCA to dictionary learning.The learned dictionary of PCA is compared with corresponding dictionary of KSVD to show the advantages of PCA-based solution.A good over-complete dictionary is important for SR-based image fusion.Unfortunately,it is difficult to obtain such a small and informative one.In Aharon’s solution[26],KSVD was proposed to train source image patches and adaptively update corresponding dictionary by SVD operations for obtaining an over-complete dictionary.KSVD used extracted image patches from globally and adaptively trained dictionaries during the dictionary learning process.
Clustering-based dictionary learning solution was first introduced to image fusion by Kim et al.[20].Based on local structure information,similar patches from different source images were clustered.The subdictionary was built by analysing a few components of each cluster.To describe structure information of source images in an effective way,it combines the learned subdictionaries to obtain a compact and informative dictionary.
2.2 Construction of geometric similarity-based dictionary
Smooth,stochastic,and dominant orientation patches as three geometric types used in single image super-resolution(SISR)[27–29]are used to classify source images,and describe structure,texture,and edge information,respectively.Three subdictionaries are learned from corresponding image patches.PCA method is used to extract important information only from each cluster for obtaining corresponding compact and informative subdictionary.All learned subdictionaries are combined to form a compact and informative dictionary for image fusion[20,30,31].
Fig.1 shows the proposed two-step geometric solution.First,the input source images Iito Ikare split into several small image blocks pin,i∈(1,2,...,k),n∈(1,2,...,w),where i is the source image number,n the patch number,and w the total block number each input image.The obtained image blocks are classified into smooth,stochastic,and dominant orientation patch group on the basis of geometric similarity.Then,PCA is applied to each group to extract corresponding bases for obtaining subdictionary.All obtained subdictionaries are combined to form a complete dictionary for instructing the image SR.
2.3 Geometric structure-based image patch classification
According to the classified smooth,stochastic,and dominant orientation image patches,more detailed image information can be further analysed.The out-of-focused areas are usually smooth and contain smooth image patches.The focused areas usually have sharp edges and contain dominant orientation patches.Besides that,many stochastic image patches exist in source images.More detailed information can be obtained,when dictionary learning is applied to three different types of image patches.As an efficient way,it enhances the accuracy in describing source images.
In this paper,source images are classified into different image-patch groups first by proposed geometry-based method.Then corresponding subdictionaries are obtained from classified image-patch groups.
Generally,the classified smooth patches have similar structured information of source images.Non-smooth patches are usually different and need to be classified into different groups.
For multi-focus images,the smooth blocks are not only include the originally smoothed area,but also include the out-of-focus area of the source images.As shown in Figs.2a–c,image regions and blocks in orange rectangle frames and blue rectangle frames are the original smooth and out-of-focus image regions.Originally smoothed regions are smooth in both focused and out-of-focus area.In image blocks of originally smoothed regions,pixels are with little difference.In the blue frames of Fig.2c,the out-of-focus edge blocks and number blocks are smoothed.Owing to the variance of the image,patches are small.In Figs.2a,b,and d,the focused characters,numbers,and object edges are framed by the red rectangles.As shown in Fig.2d,the focused blocks that with sharp edges and basis are clustered into the detail cluster of blocks.
Stochastic and dominant orientation patches belong to non-smooth patches,based on geometric patterns.The proposed solution takes two steps to separate stochastic and dominant orientation patches from source images.First,it calculates the gradient of each pixel.In every image vector vi,i∈(1,2,...,n),the gradient of each pixel kij,j∈ (1,2,...,w),i∈ (1,2,...,n)is composed by its x and y coordinate gradient gij(x)and gij(y).The gradient value of each pixel kijin image patch viis gij=(gij(x),gij(y)).The(gij(x),gij(y)) can be calculated by gij(x)= ?kij(x,y)/?x, gij(y)=?kij(x,y)/?y.For each image vector vi,the gradient Giis Gi=(gi1,gi2,...,giw)T,where Gi∈ Rw×2.Second,(1)is used to decompose the gradient value of each image patch

Fig.1 Proposed morphology-based image fusion framework

Fig.2 Results of geometric similarity-based clustering
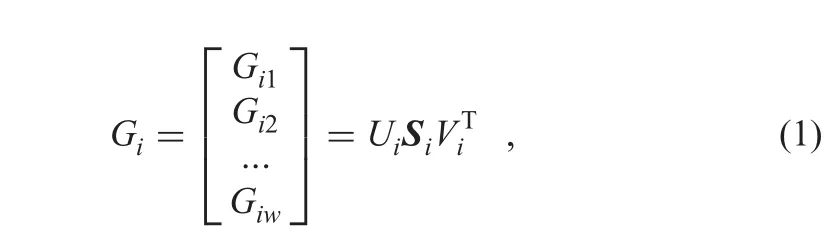
whereis the singular value decomposition of Gi.As a diagonal 2×2 matrix,Sirepresents energy in dominant directions[32].Based on the obtained Si,the dominant measure R can be calculated by the below equation

When the R gets smaller,the corresponding image patch is more stochastic[33].To distinguish stochastic and dominant orientation patches,a probability density function (PDF)of R can be calculated by(3)to get the corresponding threshold R?[34]

P(R)converges to zero,when the value of R increases.When the value of P(R)reaches zero for the first time,the corresponding R is used as the threshold R?that is used to distinguish stochastic and dominant orientation patches in a PDF significance test[34].Those image patches that have smaller R than R?are treated as stochastic patches.The proposed method separates stochastic and dominant orientation patches.Texture and detailed information is included in stochastic image patches,and dominant orientation image patches contain edge information.
According to the direction information,dominant orientation image patches can be classified into horizontal and vertical patch groups furtherly.The gradient field v1shown in(4)is used to estimate the direction d of dominant orientation image patch
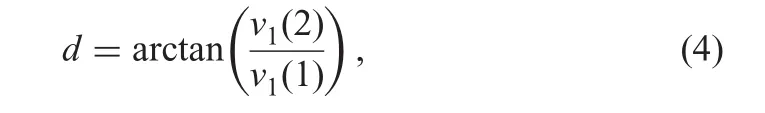
In(4),when d is close to 0 or ± 90°,the corresponding image patch is clustered into horizontal or vertical patch group,respectively.
2.4 Dictionary construction by PCA
After the geometric similarity-based classification,the principal components of each group are used to train a compact and informative dictionary.Since a small number of PCA bases can represent corresponding image patches in the same geometric group well,a subdictionary is obtained based on the top m most informative principal components[35].All subdictionaries D1,D2,…,Dnare combined to form a full dictionary D by the below equation

2.5 Image fusion scheme


Fig.3 Proposed image fusion scheme
Algorithm 1:Framework of CoSaMP algorithm
Input:
The CS observation y,sampling matrix Φ,and sparsity level K;
Output:
A K sparse approximation x of the target;
1:Initialisation:x0=0(xJis the estimate of x)at the J th iteration and r=y(the current residual);
2:Iteration until convergence:
3:Compute the current error(note that for Gaussian Φ,ΦTΦ is diagonal):
4:Compute the best 2 K support set of the error Ω(index set):

5:Merge the strongest support sets and perform a least-squares signal estimation:

6:Prune xJand compute for next round:
In Algorithm 1,Φ?is the Hermitian transform of Φ.Φ?represents the pseudo-inverse of Φ.T is the number of elements.Tcindicates the complement of set T.
Second,Max-L1 fusion rule is applied to the fusion of sparse coefficients[36,37].Equation(10)demonstrates Max-L1 fusion rule to merge two sparse coefficientsand
Based on the trained dictionary,the fused image is obtained by the inversion of corresponding fused coefficients.
3 Comparative experiments and analyses
Ten pairs of grey-level images and 20 pairs of colour images are used to test the proposed multi-focused image fusion approach in comparative experiments.Ten pairs of grey-level images,that are obtained from http://www.imagefusion.org,consist of three 320×240 image pairs and seven 256×256 image pairs.Twenty pairs of colour images are from Lytro data set http://mansournejati.ece.iut.ac.ir/content/lytro-multi-focus-dataset and all the colour images are 520×520 size.In this section,six fusion comparison experiments of grey-level images and colour images are chosen and presented,respectively.Twelve sample groups of testing images are shown in Fig.4,which consists of six grey-level(Figs.4a–f)and six colour image groups(Figs.4g–l).The image pair samples in Figs.4a–c are grey-level multi-focus images with the size of 256×256,and the rest grey-level multi-focus image pairs are with the size of 320×240.The colour multi-focus image pair samples from Figs.4g–l are with the size of 520× 520.The proposed solution is compared with KSVD[36]and JCPD[20]that are two important dictionary-learning-based SR fusion schemes.Comparative experiments are assessed in both subjective and objective ways.Four objective metrics are used to evaluate the quality of image fusion quantitatively.All three SR-based methods use 8×8 patch size.Sliding window scheme is used to avoid blocking artefacts in all comparative experiments[20,36].Four-pixel is set in each horizontal and vertical direction as overlapped region of sliding window scheme.All experiments are simulated using a 2.60 GHz single processor of an Intel?Core?i7-4720HQ CPU Laptop with 12.00 GB RAM.To compare fusion results in a fair way,all comparative experiments are programmed by Matlab code in Matlab 2014a environment.
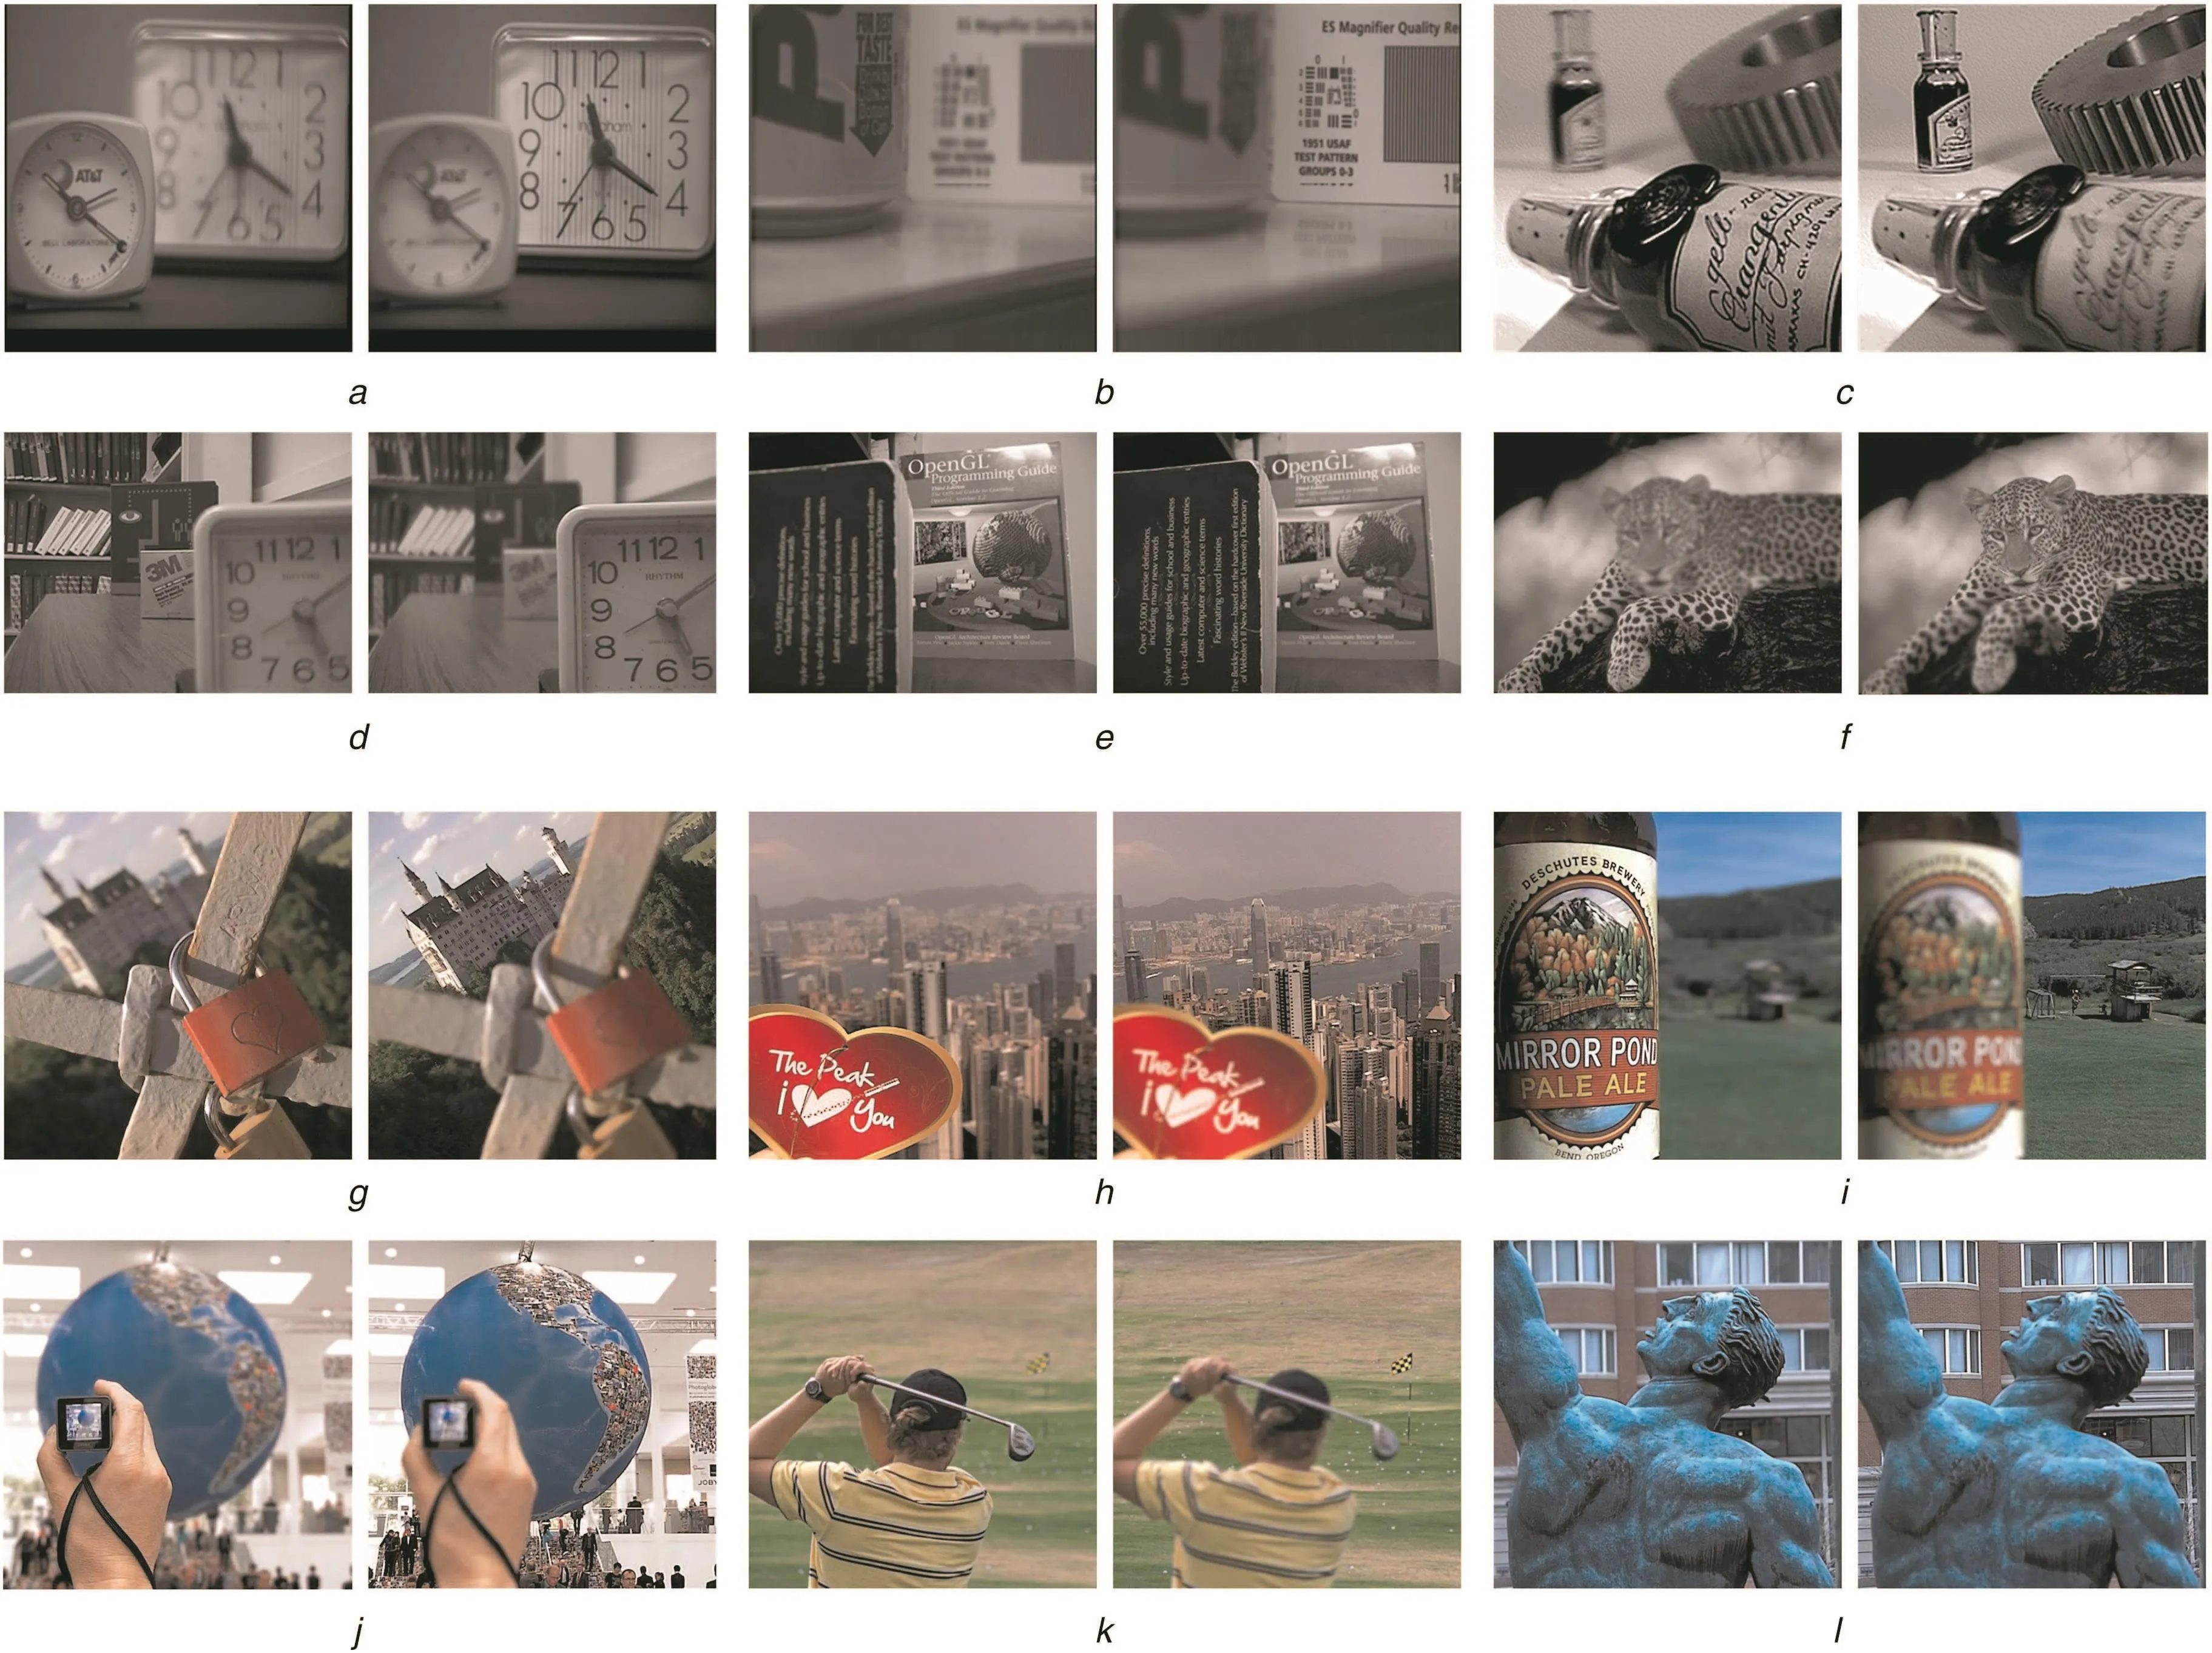
Fig.4 Sample groups of grey-level and colour multi-focus images
3.1 Objective evaluation metrics
To evaluate the integrated images objectively,four popular objective evaluations are implemented,which include entropy[38,39],mutual information(MI)[40,41],edge retention QAB/F[42,43],and visual information fidelity(VIF)[44,45].These performance metrics are defined as follows.
3.1.1 Entropy:Entropy of an image is about the information content of image.Higher entropy value means the image is more informative.The entropy of one image is defined as
where L is the number of grey-level and Plthe ratio between the number of pixels with grey values l and total number of pixels.
3.1.2 Mutual information:The metric of MI measure the MI of the source images and fused image.MI for images can be formalised as

where L is the number of grey-level,hA,F(i,j)the grey histogram of image A and F.hA(i)and hF(j)are edge histogram of image A and F.Equation(13)calculates MI of fused image

where MI(A,F)represents the MI value of input image A and fused image F;MI(B,F)the MI value of input image B and fused image F.
3.1.3 QAB/F:QAB/Fmetric,as a gradient-based quality index,measures the performance of edge information in fused image[42],and can be calculated by
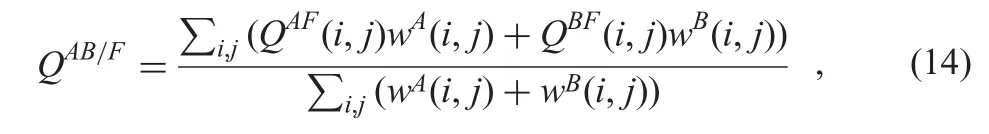

Fig.5 Multi-focus image fusion of‘two clocks’

3.1.4 Visual information fidelity:VIF is the novel full reference image quality metric.VIF quantifies the MI between the reference and test images based on natural scene statistics theory and human visual system(HVS)model.It can be expressed as the ratio between the distorted test image information and the reference image information,the calculation equation of VIF is shown in the following equation


Fig.6 Multi-focus image fusion of‘clock and book’
a Source image
b Source image
c Fused image of KSVD
d Fused image of JCPD
e Fused image of the proposed method
f Difference images between a and fused image c
g Difference images between a and fused image d
h Difference images between a and fused image e
i Difference images between b and fused image c
j Difference images between b and fused image d
k Difference images between b and fused image e
To evaluate the VIF of fused image,an average of VIF values of each input image and the integrated image is proposed[45].Equation(16)shows the evaluation function of VIF for image fusion
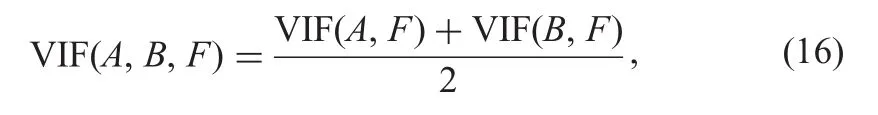
where VIF(A,F)is the VIF value between input image A and fused image F;VIF(B,F)the VIF value between input image B and fused image F.
3.2 Grey-level image fusion
In order to test the efficiency of the proposed method,the most commonly used ten multi-focus grey-level images are implemented for testing.Two sample groups of fused grey-level images with the size of 256×256 and 320×240 are picked for demonstration,which are shown in Figs.5 and 6.The difference images of each fused image are also shown in Figs.5 and 6.The difference images demonstrate the difference between the fused images and source images.In multi-focus image fusion,if the focused area of difference images is more clear,it means the fusion performance is better.The difference image can be obtained by

where Idrepresents the difference image,IFis the fused image,and Isa source multi-focus image.
Figs.5 and 6 show the fused images of similar comparison experiments,respectively.It only chooses Fig.5 for analysis.The source multi-focus images of ‘two clocks’are shown in Figs.5a and b,respectively.To show the details of fused image,two specified image blocks,that show the number in clock,are highlighted and magnified in red and blue squares,respectively.In Fig.5a,the highlighted image block in red square is focused,and another highlighted part in blue square is out of focus.In Fig.5b,the corresponding image block in red square is out of focus,and the corresponding image block in blue square is focused.Figs.5c–e are the fused image of KSVD,JCPD,and proposed method,respectively.Figs.5f–h are the difference images between source image(Fig.5a)and fused image of KSVD,JCPD,and proposed method,respectively.Similarly,Figs.5i–k show the corresponding difference images between source image(Fig.5b)and three fused
images,respectively.Two specified image blocks are focused in all three fused images.However,it is different to differentiate the slight differences among each fused image and evaluate the corresponding fusion performance of each method.

Table 1 Average quantitative comparison of ten grey-level multi-focus image fusions
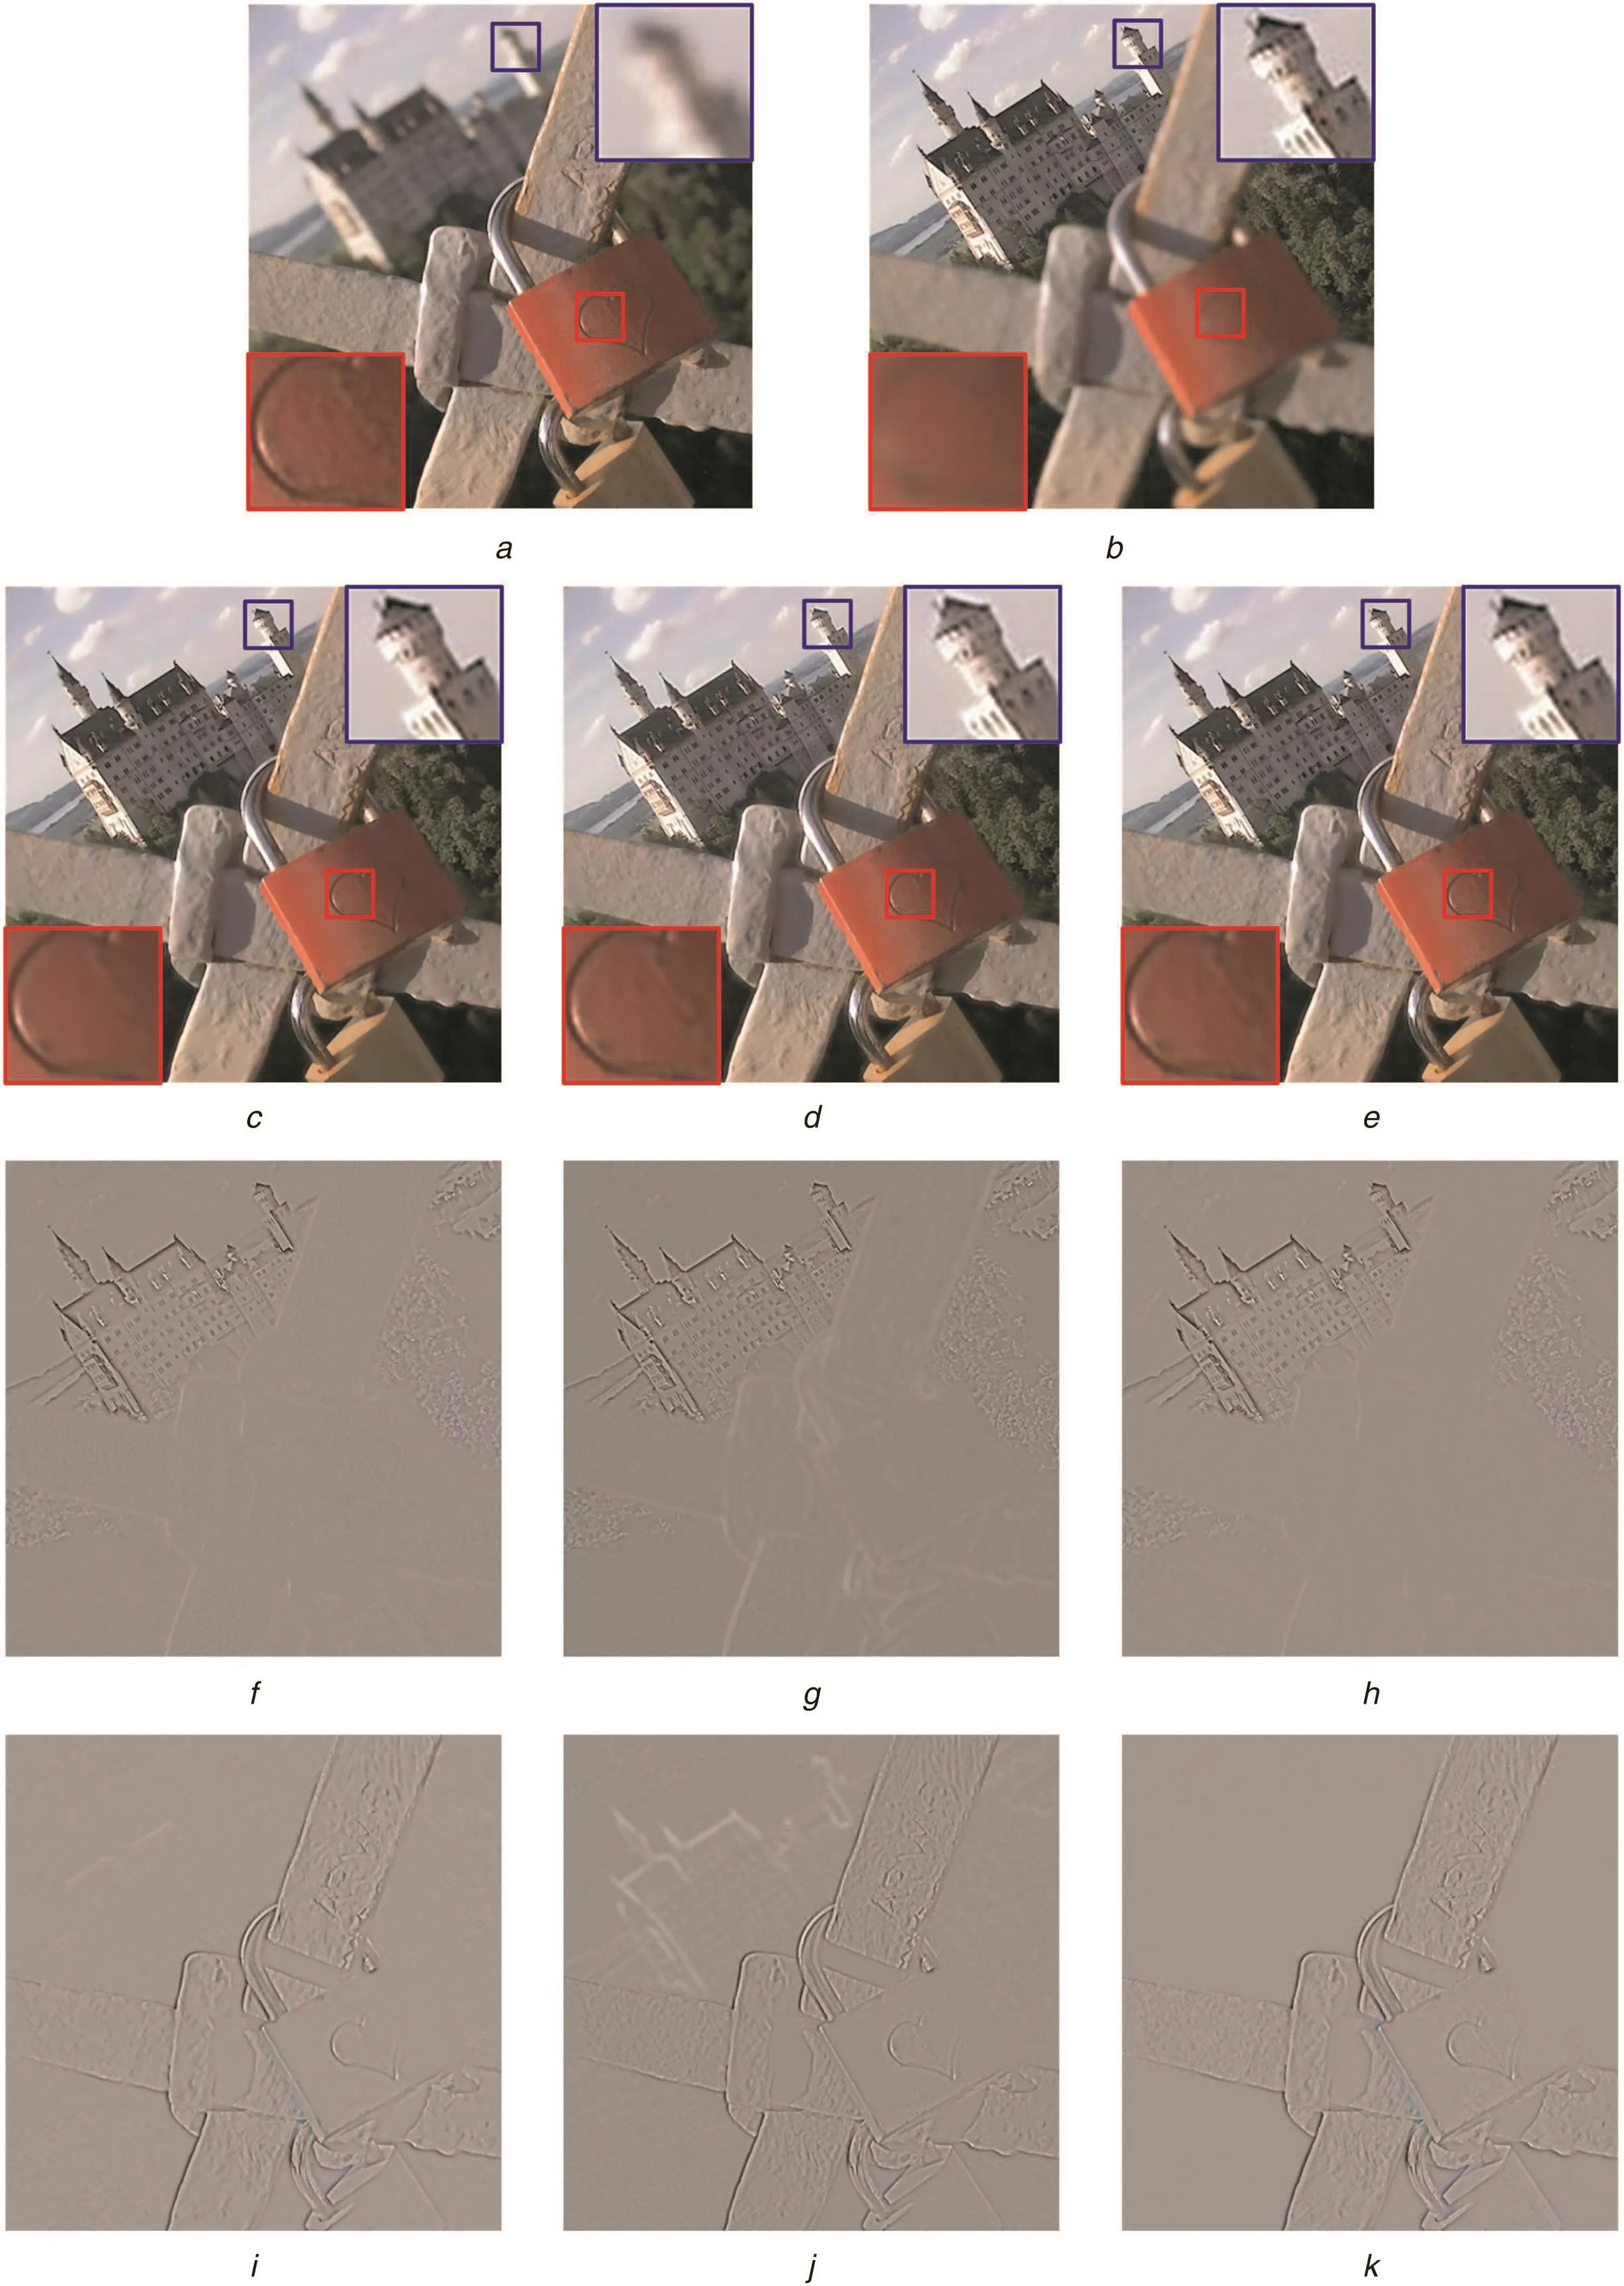
Fig.7 Multi-focus image fusion of‘castle and lock’

Fig.8 Multi-focus image fusion of‘love card and Hong-Kong’
To objectively evaluate the fusion performances of input multi-focus images,entropy,QAB/F,MI,and VIF are used as image fusion quality measures.Table 1 shows the averageobjective evaluation results of ten grey-level multi-focus images using three different methods.The best metric results in Table 1 are highlighted by bold faces.The proposed method achieves the best performance in all four objective evaluations.JCPD method only has the same performance as the proposed method in entropy.
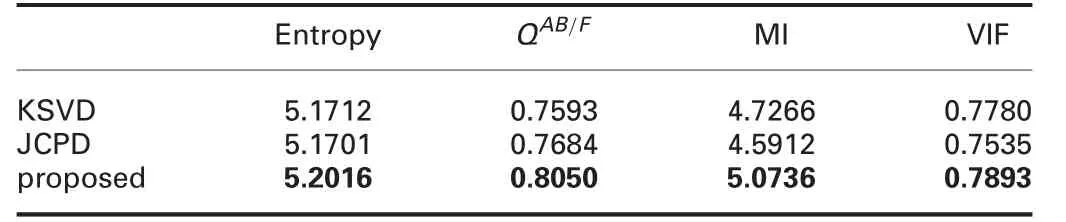
Table 2 Average quantitative comparison of 20 colour multi-focus image fusions
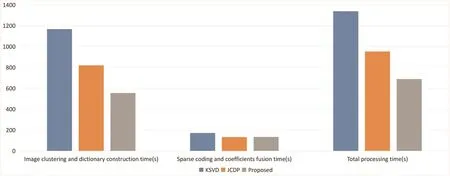
Fig.9 Average time comparison of 20 colour image pairs fusion from Lytro data set
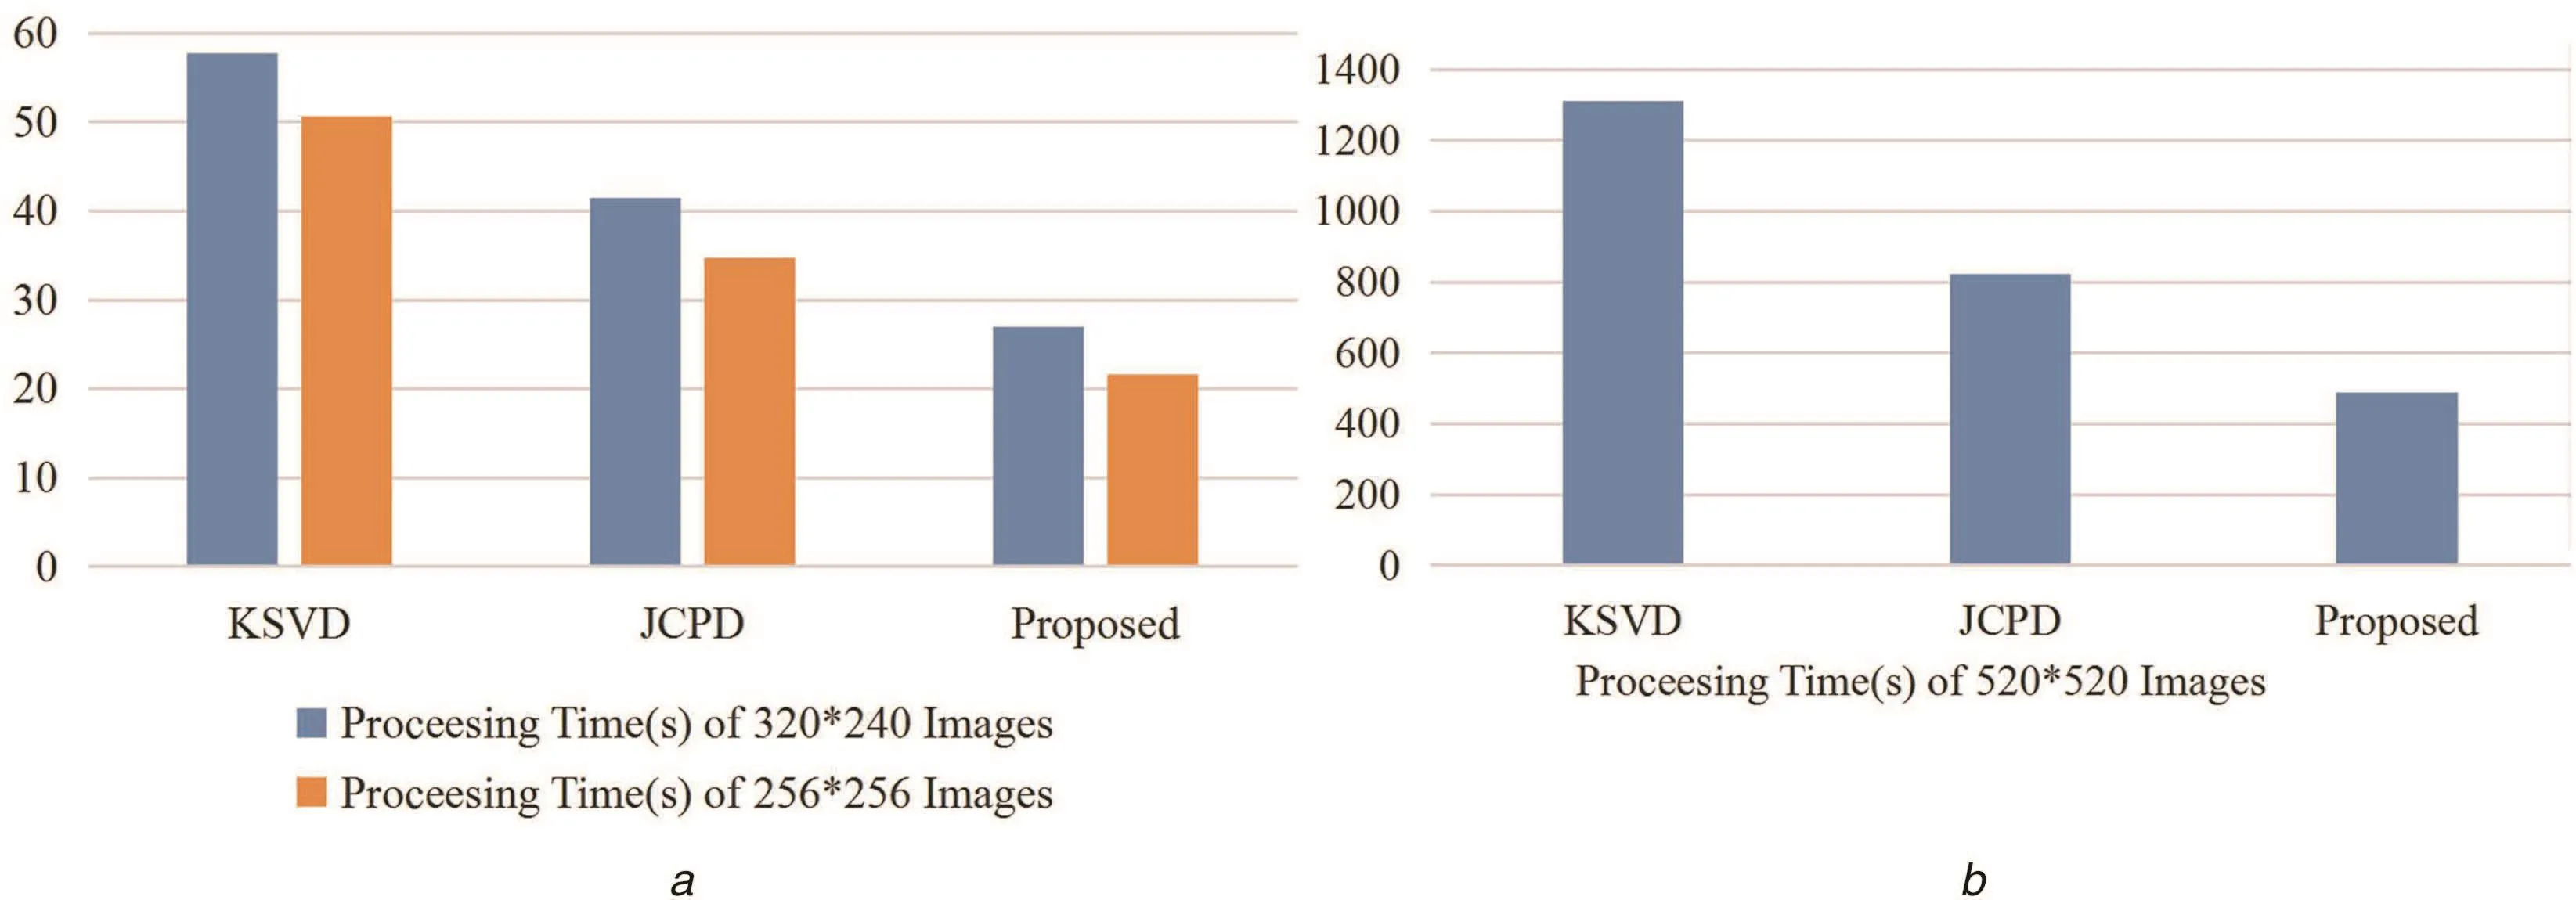
Fig.10 Time comparison of KSVD,JCPD,and the proposed method
3.3 Colour multi-focus image fusion
To compare the proposed method with KSVD and JCPD,20 colour image pairs from Lytro data set are used to test fusion results.For visual evaluation,two sample groups of fused colour images obtained by three different methods are chosen to demonstrate in Figs.7 and 8.Figs.7 and 8 not only include the details of fused images,but also show the difference images of between source images and fused images.
Similar to grey-level image fusion experiment,it only picks Fig.7 for analysis.Figs.7a and b are the source multi-focus images.Two image blocks of red lock and castle are highlighted and magnified to show the details of fused image,which are squared by red and blue squares,respectively.Red lock in the centre of the image,that is marked in red,is focused in Fig.7a,and castle in the left-top,that is marked in blue,is totally focused in Fig.7b.The corresponding castle and red lock in Figs.7a and b are out of focus,respectively.Figs.7c–e show the fused images of KSVD,JCPD,and proposed method,respectively.Figs.7f and i show the difference images between two source images(Figs.7a and b)and fused image(Fig.7c),respectively.Similarly,Figs.7g,j,h,and k show the difference image of fused image(Figs.7d and e),respectively.
It is difficult to figure out the differences in fused images by three different methods visually.Similarly,entropy,QAB/F,MI,and VIF are also used as image fusion quality measures to evaluate the fusion performance objectively.The average quantitative fusion results of 20 colour multi-focus images using three different methods are shown in Table 2.The best results of each evaluation metric are highlighted by bold faces in Table 2.The proposed method reaches the best performance in all four types of evaluation metrics.Particularly,the proposed method higher result in QAB/Fthan other two methods.As a gradient-based quality metric,QAB/Fmeasures the performance of edge information in fused image.It con firms the proposed method can obtain fused images with better edge information.
3.4 Processing time comparison
Fig.9 compares the average fusion time of 20 colour image pairs in details.The total processing time consists of two parts.One is image clustering and dictionary construction,the other one is sparse coding and coefficients fusion.Comparing with KSVD and JCDP,the proposed method has much better performance of image clustering and dictionary construction.KSVD spends the longest time on image clustering and dictionary construction.JCDP and the proposed solution take almost same time to do sparse coding and coefficients fusion.Similarly,KSVD uses longer time to finish sparse coding and coefficients fusion.Generally,the proposedmethod has the best overall performance of processing time among three methods.JCDP has better performance than KSVD.

Table 3 Processing time comparison
Fig.10a shows the time comparison of 320×240 and 256×256 grey-level image fusion.Fig.10b shows the time comparison of 520×520 colour image fusion.In Figs.10a and b,it can easily figure out the proposed method has lower computation costs than the compared two methods.
Table 3 compares the processing time of 320×240 and 256×256 grey-level image fusion and 520×520 colour image fusion.The proposed solution has lower computation costs than KSVD and JCPD in image fusion process.When the size of source image increases,the processing time veri fies that the proposed solution has much better performance than the compared two methods.Comparing with KSVD,the dictionary construction of the proposed solution is more efficient,that does not use any iterative way to extract the underlying information of images.Although JCPD and the proposed solution both cluster image pixels or patches based on geometric similarity,the proposed solution does not use steering Kernel regression in dictionary construction as JCPD,which is an iterative method,but time-consuming.
Additionally,as the proposed method shows great image fusion performance on both grey-level and colour multi-focus images with different size,it can infer that the proposed method is robust to the image size and colour spatial.
3.5 Effectiveness discussion
The obtained dictionary of the proposed approach is more compact than existing methods.The proposed solution takes less fusion time than existing methods.Although the proposed method is just slightly better than the compared approaches in objective evaluations,the results of comparison experiments verify that the proposed solution obtains high-quality fused image and performs high efficiency in image fusion.
According to each objective evaluation,this paper compares each increasing rate of proposed solution with four SR-based methods published in mainstream journals in 2015–2016.The experimentation environment of each compared method is different and not all compared methods publish their source codes,so it is difficult to compare each objective evaluation using the same standard.This paper can only compare the relative increasing rate among all approaches.The relative increasing rate is the difference between each proposed solution and the second best solution in the same paper.
Table 4 shows the comparison results.The analysis of each objective evaluation is shown as follows:
(i)Entropy:The proposed solution increases 0.3%and Yin’s solution did not improve entropy.The other three solutions did not compare entropy.
(ii)QAB/F:The proposed solution increases 3.4%.The increasing rate of proposed solution is greater than Kim’s solution,but is less than Nejati’s solution.
(iii)MI:The proposed solution has the best increasing rate 4.2%.
(iv)VIF:The increasing rate of proposed solution is 0.8%,that is,greater than Nejati’s solution,but is less than Kim’s solution.
Comparing with the other four existing solutions,the relative increasing rate of the proposed solution is convincing.The increasing rate varies from 0 to 4.3%in all compared solution.It is normal and reasonable that most of proposed solutions only slightly improve existing solutions in image fusion.
4 Conclusion
Based on the geometric information of image,an SR-based image fusion framework is proposed in this paper.The geometric similarities of source images,such as smooth,stochastic,and dominant orientation image patches,are analysed,and corresponding image patches are classified into different image patch groups.PCA is applied to each image patch group to extract the key image patches for constructing the corresponding compact and informative subdictionary.All obtained subdictionaries are combined into a fully trained dictionary.Based on the trained dictionary,source image patches are sparsely coded into coefficients.During the image processing,image block size is adaptively chosen and optimal coefficients are selected.More edge and corner details can be retained in the fused image.Max-L1 rule is applied to fuse the sparsely coded coefficients.After that,the fused coefficients are inverted to obtain the final fused image.Two existing mainstream SR-based methods,KSVD and JCPD,are compared with the proposed solution in comparative experiments.According to subjective and objective assessments,the fused images of proposed solution have better quality than existing solutions in edge,corner,structure,and detailed information.
5 References
[1] Wu,W.,Tsai,W.T.,Jin,C.,et al.:‘Test-algebra execution in a cloud environment’.IEEE 8th Int.Symp.on Service Oriented System Engineering,Oxford,UK,2014,pp.59–69
[2] Qi,G.,Tsai,W.-T.,Li,W.,etal.:‘A cloud-based triage log analysis and recovery framework’,Simul.Modelling Pract.Theory,2017,77,pp.292–316
[3] Tsai,W.T.,Qi,G.:‘DICB:dynamic intelligent customizable benign pricing strategy for cloud computing’.IEEE Fifth Int.Conf.on Cloud Computing,Honolulu,HI,USA,2012,pp.654–661
[4] Tsai,W.T.,Qi,G.,Chen,Y.:‘A cost-effective intelligent con figuration model in cloud computing’.32nd Int.Conf.on Distributed Computing Systems Workshops,Macau,China,2012,pp.400–408
[5] Li,H.,Qiu,H.,Yu,Z.,et al.:‘Multifocus image fusion via fixed window technique of multiscale images and non-local means filtering’,Signal Process.,2017,138,pp.71–85
[6] Qi,G.,Wang,J.,Zhang,Q.,et al.:‘An integrated dictionary-learning entropy-based medical image fusion framework’,Future Internet,2017,9,(4),p.61
[7] Li,H.,Liu,X.,Yu,Z.,et al.:‘Performance improvement scheme of multifocus image fusion derived by difference images’,Signal Process.,2016,128,pp.474–493
[8] Li,H.,Yu,Z.,Mao,C.:‘Fractional differential and variational method for image fusion and super-resolution’,Neurocomputing,2016,171,pp.138–148
[9] Pajares,G.,de la Cruz,J.M.: ‘A wavelet-based image fusion tutorial’,Pattern Recognit.,2004,37,(9),pp.1855–1872
[10]Makbol,N.M.,Khoo,B.E.:‘Robust blind image watermarking scheme based on redundant discrete wavelet transform and singular value decomposition’,AEU – Int.J.Electron.Commun.,2013,67,(2),pp.102–112
[11] Luo,X.,Zhang,Z.,Wu,X.:‘A novel algorithm of remote sensing image fusion based on shift-invariant shearlet transform and regional selection’,AEU – Int.J.Electron.Commun.,2016,70,(2),pp.186–197
[12] Liu,X.,Zhou,Y.,Wang,J.:‘Image fusion based on shearlet transform and regional features’,AEU – Int.J.Electron.Commun.,2014,68,(6),pp.471–477
[13] Sulochana,S.,Vidhya,R.,Manonmani,R.:‘Optical image fusion using support value transform(SVT)and curvelets’,Optik – Int.J.Light Electron Optics,2015,126,(18),pp.1672–1675
[14] Yu,B.,Jia,B.,Ding,L.,et al.:‘Hybrid dual-tree complex wavelet transform and support vector machine for digital multi-focus image fusion’,Neurocomputing,2016,182,pp.1–9
[15] Seal,A.,Bhattacharjee,D.,Nasipuri,M.:‘Human face recognition using random forest based fusion of à-trous wavelet transform coefficients from thermal and visible images’,AEU – Int.J.Electron.Commun.,2016,70,(8),pp.1041–1049
[16] QU,X.-B.,Yan,J.-W.,Xiao,H.-Z.,et al.:‘Image fusion algorithm based on spatial frequency-motivated pulse coupled neural networks in nonsubsampled contourlet transform domain’,Acta Autom.Sin.,2008,34,(12),pp.1508–1514
[17] Yin,H.,Li,Y.,Chai,Y.,et al.:‘A novel sparse-representation-based multi-focus image fusion approach’,Neurocomputing,2016,216,pp.216–229
[18] Nejati,M.,Samavi,S.,Shirani,S.:‘Multi-focus image fusion using dictionary-based sparse representation’,Inf.Fusion,2015,25,pp.72–84
[19] Zhu,Z.,Qi,G.,Chai,Y.,etal.:‘A novel visible-infrared image fusion framework for smart city’,Int.J.Simul.Process Model.,2018,13,(2),pp.144–155
[20] Kim,M.,Han,D.K.,Ko,H.:‘Joint patch clustering-based dictionary learning for multimodal image fusion’,Inf.Fusion,2016,27,pp.198–214
[21] Guo,M.,Zhang,H.,Li,J.,et al.:‘An online coupled dictionary learning approach for remote sensing image fusion’,IEEE J.Sel.Top.Appl.Earth Obs.Remote Sens.,2014,7,(4),pp.1284–1294
[22] Li,S.,Yin,H.,Fang,L.:‘Group-sparse representation with dictionary learning for medical image denoising and fusion’,IEEE Trans.Biomed.Eng.,2012,59,(12),pp.3450–3459
[23] Ibrahim,R.,Alirezaie,J.,Babyn,P.:‘Pixel level jointed sparse representation with RPCA image fusion algorithm’.38th Int.Conf.on Telecommunications and Signal Processing(TSP),Prague,Czech Republic,2015,pp.592–595
[24] Qi,G.,Zhu,Z.,Erqinhu,K.,etal.:‘Fault-diagnosis for reciprocating compressors using big data and machine learning’,Simul.Modelling Pract.Theory,2018,80,pp.104–127
[25] Zhu,Z.,Sun,J.,Qi,G.,et al.:‘Frequency regulation of power systems with self-triggered control under the consideration of communication costs’,Appl.Sci.,2017,7,(7),p.688
[26] Aharon,M.,Elad,M.,Bruckstein,A.:‘k-SVD:an algorithm for designing over complete dictionaries for sparse representation’,IEEE Trans.Signal Process.,2006,54,(11),pp.4311–4322
[27] Yang,S.,Wang,M.,Chen,Y.,et al.:‘Single-image super-resolution reconstruction via learned geometric dictionaries and clustered sparse coding’,IEEE Trans.Image Process.,2012,21,(9),pp.4016–4028
[28] Zhu,Z.,Qi,G.,Chai,Y.,et al.:‘A geometric dictionary learning based approach for fluorescence spectroscopy image fusion’,Appl.Sci.,2017,7,(2),p.161
[29] Wang,K.,Qi,G.,Zhu,Z.,et al.:‘A novel geometric dictionary construction approach for sparse representation based image fusion’,Entropy,2017,19,(7),p.306
[30] Zhu,Z.,Yin,H.,Chai,Y.,et al.:‘A novel multi-modality image fusion method based on image decomposition and sparse representation’,Inf.Sci.,2018,432,pp.516–529
[31] Zhu,Z.,Qi,G.,Chai,Y.,et al.:‘A novel multi-focus image fusion method based on stochastic coordinate coding and local density peaks clustering’,Future Internet,2016,8,(4),p.53
[32] Takeda,H.,Farsiu,S.,Milanfar,P.:‘Kernel regression for image processing and reconstruction’,IEEE Trans.Image Process.,2007,16,(2),pp.349–366
[33] Ratnarajah,T.,Vaillancourt,R.,Alvo,M.:‘Eigenvalues and condition numbers of complex random matrices’,SIAM J.Matrix Anal.Appl.,2004,26,(2),pp.441–456
[34] Bigün,J.,Granlund,G.H.,Wiklund,J.:‘Multidimensional orientation estimation with applications to texture analysis and optical flow’,IEEE Trans.Pattern Anal.Mach.Intell.,1991,13,(8),pp.775–790
[35] Chatterjee,P.,Milanfar,P.:‘Clustering-based denoising with locally learned dictionaries’,IEEE Trans.Image Process.,2009,18,(7),pp.1438–1451
[36] Yang,B.,Li,S.:‘Pixel-level image fusion with simultaneous orthogonal matching pursuit’,Inf.Fusion,2012,13,(1),pp.10–19
[37] Yin,H.,Li,S.,Fang,L.:‘Simultaneous image fusion and super-resolution using sparse representation’,Inf.Fusion,2013,14,(3),pp.229–240
[38] Deshmukh,M.,Bhosale,U.:‘Image fusion and image quality assessment of fused images’,Int.J.Image Process.(IJIP),2010,4,(5),pp.484–508
[39] Tsai,W.-T.,Qi,G.:‘Integrated fault detection and test algebra for combinatorial testing in TAAS(testing-as-a-service)’,Simul.Modelling Pract.Theory,2016,68,pp.108–124
[40] Xydeas,C.,Petrovic,V.: ‘Objective image fusion performance measure’,Electron.Lett.,2000,36,(4),pp.308–309
[41] Tsai,W.,Qi,G.,Zhu,Z.:‘Scalable SAAS indexing algorithms with automated redundancy and recovery management’,Int.J.Softw.Inf.,2013,7,(1),pp.63–84
[42] Qu,G.,Zhang,D.,Yan,P.:‘Information measure for performance of image fusion’,Electron.Lett.,2002,38,(7),pp.313–315
[43] Zuo,Q.,Xie,M.,Qi,G.,et al.:‘Tenant-based access control model for multi-tenancy and sub-tenancy architecture in software-as-a-service’,Front.Comput.Sci.,2017,11,(3),pp.465–484
[44] Sheikh,H.R.,Bovik,A.C.:‘Image information and visual quality’,IEEE Trans.Image Process.,2006,15,(2),pp.430–444
[45] Han,Y.,Cai,Y.,Cao,Y.,et al.:‘A new image fusion performance metric based on visual information fidelity’,Inf.Fusion,2013,14,(2),pp.127–135
[46] Zhang,Q.,Levine,M.D.:‘Robust multi-focus image fusion using multi-task sparse representation and spatial context’,IEEE Trans.Image Process.,2016,25,(5),pp.2045–2058
 CAAI Transactions on Intelligence Technology2018年2期
- CAAI Transactions on Intelligence Technology的其它文章
- Visual programming language environment for different Io T and robotics platforms in computer science education
- Efficient key management scheme for health blockchain
- Optimisation of mobile intelligent terminal data pre-processing methods for crow d sensing
- Temporal enhanced sentence-level attention model for hashtag recommendation
- Survey of advances and challenges in intelligent autonomy for distributed cyber-physical systems
- Guest Editorial:Internet of things and intelligent devices and services