Effect of Lactobacillus acidophilus as a Dietary Supplement on Nonspecific Immune Response and Disease Resistance in Juvenile Common carp, Cyprinos carpio
Adeshina Ibrahim, Sani Abdulkareem Ramatu, and Adewale Yusuf Adewale
1 Department of Aquaculture and Fisheries, University of Ilorin, Ilorin 1515, Nigeria
2 Department of Animal Science, University of Maiduguri, Maiduguri 1050, Nigeria
3 School of Life and Environmental Science, Faculty of Science, Engineering and Built Environment, Deakin University, Melbourne 3217, Australia
Introduction
The need for aquaculture became necessary following the tremendous decrease in supply from captured fisheries due to over-fishing, unreported, illegal and irresponsible fishing, habitat destruction and pollution among other factors. Aquaculture has been accountable for the remarkable and progressive growth in the fish supply following geometric increase in fish farming.Despite the achievement recorded in the aquaculture sector, some constraints, such as disease outbreak has hindered the industry. Disease in fish is an establishment of pathogens in fish tissues which cause disorderliness in physiological function of the fish that results in to physical, biological and economical loses.Diseases arise as result of complex interaction among the fish, pathogen and culture environment (Ajaniet al., 2011). Antibiotics is one of the common means of control and management of fish diseases. However,use of chemotherapeutics in aquaculture as disease control agents has become debatable, due to rise of drug resistant bacteria, residual effects and restraint the immune system of the fish (Ulukoyet al., 2017)leading to search for alternative such as probiotics.
Probiotics are life microbial feed supplements that improve health host by modifing the gastrointestinal tract of the fish. Fish, being a hydrophilic animal relies solely on the environment (water) which filters through the body and gill as fish performs its physiological function would benefit from using probiotics.Probiotics enhance the nutrient utilization, modulate gut flora, inhibit the growth of pathogenic bacteria and improve growth and immune system of the fish as reported in the previous studies (Nayak, 2010; Ulukoyet al., 2017). Several probiotics have been used in aquaculture, but probiotics from lactic acid bacteria(LAB) andBacillusspecies are often used (Wanget al., 2008; Monuz-Atienzaet al., 2013; Ulukoyet al., 2017).
Lactobacillus acidophilusis bacteria belonging to the genusLactobacilluswhich significant present in gut of common carp (Cyprinos carpio). It has been isolated from piglet, chicken dung, etc.Lactobacillus acidophilusis a member of lactic acid bacteria group;however, its benefit in the diet to improve nonspecific immune response and disease resistance inCyprinos carpiohas not been fully elucidated.The aim of this study was to determine the effect dietary supplementation ofLactobacillus acidophilusnonspecific immune response and disease resistance in juvenile Common carp,Cyprinos carpio.
Materials and Methods
Chicken dungs were obtained from a University of Ilorin Teaching and Research Farm (Poultry Unit),Nigeria and added to a selective medium of de Man-Rogosa Sharpe (MRS) broth (LAB M) and sodium azide (0.02% w/v). The medium was transported to the Department of Aquaculture and Fisheries, University of Ilorin, Nigeria in an ice box immediately and incubated at 37℃ for 24 h (Al-Dohailet al., 2009).The medium was streaked on MRS agar prepared plates at 37℃ for 48 h. The plates which showed typical colony morphology ofLactobacillus acidophiluswere sub-cultured to obtain pure colony.
All the suspected isolates were subjected to both biochemical and molecular characterizations. Biochemical tests comprises gram stain, motility test, catalase test and sugar (fructose, galactose, lactose, maltose,mannitol, rhamnose, sucrose and xylose) fermentation(Pyar and Peh, 2014), while molecular characterization was carried out by using polymerase chain reaction(PCR) using specific primer (Table 1)(Aminet al., 2011).
The isolates were suspended in 1.5 mL of enriched MRS broths, grown on a shaker for 48 h at 48℃ and pelleted by centrifugation at 6 000 r · min-1(4 600×g)for 5 min. The pellets were re-suspended in 520 μL of TE buffer (10 mmol · L-1Tris-HCl, 1 mmol · L-1EDTA, pH 8.0). Fifteen microliters of 20% SDS and 3 μL of proteinase K (20 mg · mL-1) were added. The mixture was incubated for 1 h at 37℃, then 100 μL of 5 mol · L-1NaCl and 80 μL of a 10% CTAB solution in 0.7 mol · L-1NaCl were added and mixed (LQAD,2008). The suspension was incubated for 10 min at 65℃ and kept on ice for 15 min. An equal volume of chloroform: isoamyl alcohol (24 : 1) was added, followed by incubation on ice for 5 min and centrifugation at 7 200×g for 20 min. The aqueous phase was transferred to a new tube, isopropanol (1 : 0.6) was added and DNA was precipitated at -20℃ for 16 h.DNA was collected by centrifugation at 7 200 x g for 10 min, washed with 500 μL of 70% ethanol, air-dried at room temperature for approximately 3 h and finally dissolved in 50 μL of TE buffer (LQAD, 2008).

Table 1 Primer used for Lacidophilus acidophilus identification
Polymerase chain reaction (PCR) analyses were carried at -70℃ in skim milk. One loop to two loops of the bacteria with phenotypically analysis grown on MRS agar were resolved in TE (Trace EDTA) buffer and boiled at 100℃ for 15 min. PCR conditions were initial denaturation of 94℃ for 5 min followed by 30 cycle of denaturation of 94℃ for 30 s, annealing of 52℃ for 30 s for cas-ITS specific primer (45℃ for 45 s) and final extension at 72℃ for 10 min using a termocycler (eppendorf). The integrity of the amplified band genes fragment was checked on a 1.0% agarose gel ran at 110 V for 1 h to confirm amplification and pictures were taken under gel electrophoresis (Aminet al., 2011).
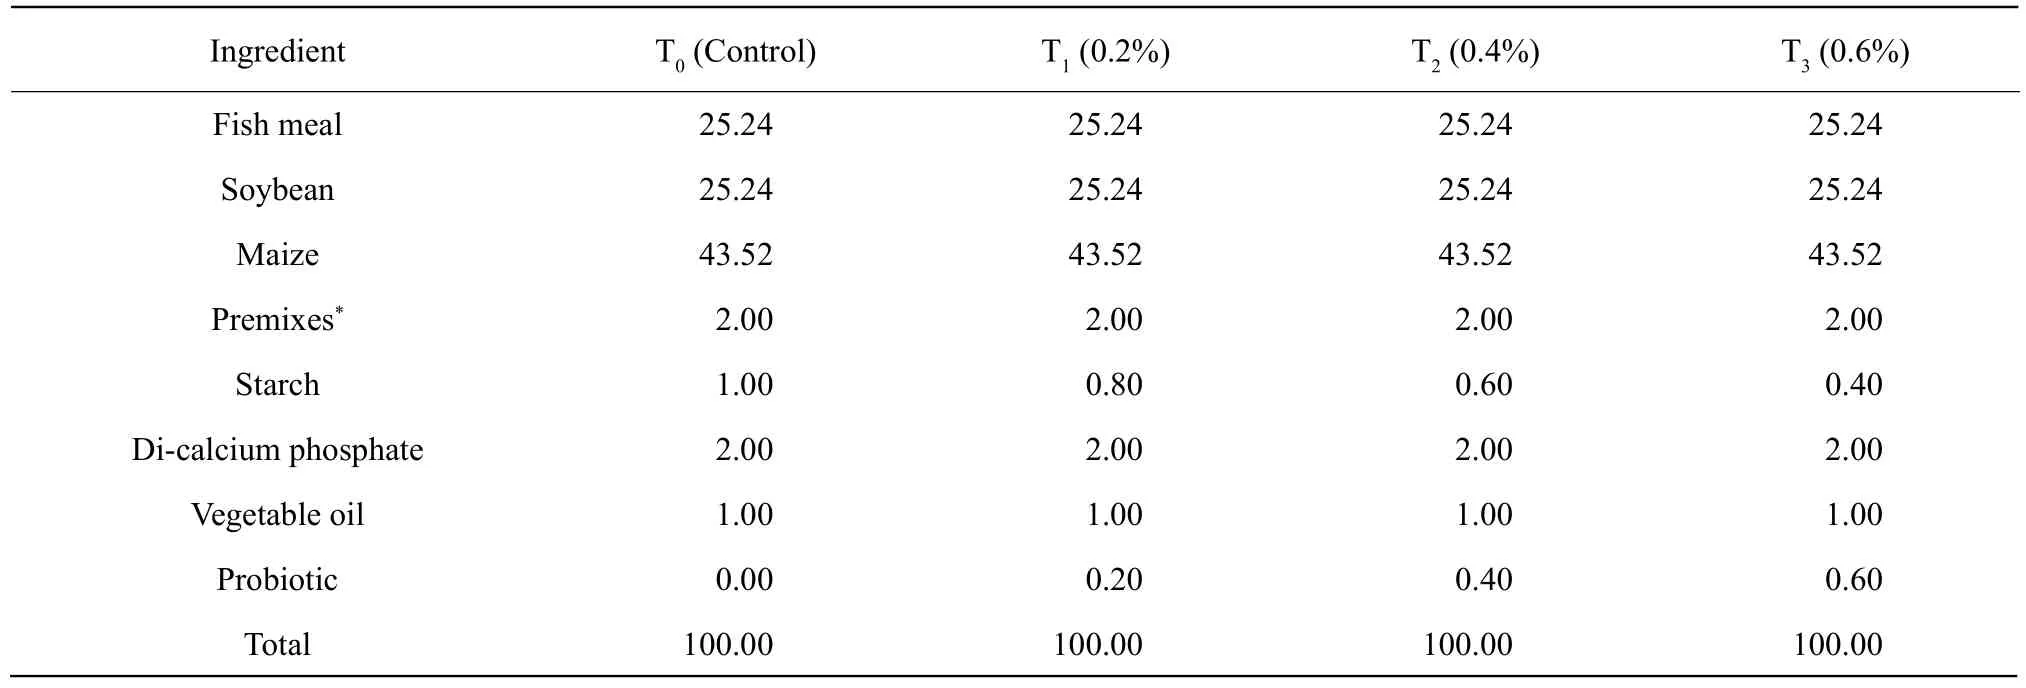
The experimental diets were formulated to meet the nutritional requirements of common carp, containing 32% protein comprises (Limet al., 1979). The diets were 0.0% (control diet), 0.2%L. acidophilus(T1),0.4%L. acidophilus(T2) and 0.4%L. acidophilus(T3)(Table 2). The feed ingredients were mixed thoroughly with distilled water and cultured isolates. The resulting dough was made into pellets, which were air-dried and stored in airtight containers at room temperature to prevent mould growth until required.

Table 2 Gross composition of experimental diets, with or without probiotic, formulated to contain 32% protein and fed to common carp
A total of 240 healthy common carps (21.34±1.85 g) were obtained from a commercial farm in Ibadan, Nigeria. The fish were acclimatized for 2 weeks in 60 cm×38 cm×27 cm rectangular plastic tanks and fed commercial diets twice daily before experimentation. For the feeding trial, the fish were allotted to 12 tanks in a completely randomized design containing 20 fish per tank in triplicate. The fish were fed experimental diets twice per day at 3% body weight for 56 days. The blood samples were obtained from the caudal vein on day 1 and days 14, 28, 42 and 56 of the trial periods.
The blood was collected with 5 mL sterile syringe and needle inserted gently at 45℃. The blood was gently transferred into tube containing lithium heparin at about 25℃. The serum was collected with a pipette following a centrifugation at 3 000 r · min-1for 30 min.
The red blood cells (RBC) were determined using differential method: the samples were diluted 1 : 200 with Rees and Ecker's diluent fluid. Few drops were expelled out, and then introduced under cover slip on an improved Neubaeur count chamber (Neubauer improved bright line Marienfield, Germany 0.100 mm, 0.0025 mm2) count with×10 objective. The amounts were calculated asRBC×1012L=Numbers of cells counted×Depth×Dilution×Area (Oresegun and Alegbeleye, 2001). The white blood cells (WBC)were counted in a Neubauer counting chamber(Schaperclauset al., 1991; Ulukoyet al., 2017) in triplicates.
The lymphocytes were determined by observing the smear under the light microscope (x100 objective lens). The small cells containing nuclei, showing granular appearance were observed and expressed as percentage (Oyewale, 2011). While heterocyte cells with an average of 6-9 μ with circular shape were observed with the aid of light microscope. The cells with rod shape with central granules with irregular size and not closely grouped, colourless to pink with bilobed or multilobed were observed and expressed as percentage (Oyewale, 2011).
The itroblue tetazolium (NBT) was measured by determining the respiratory burst activity (Andersonet al., 1992). The blood samples were incubated at 25℃ for 30 min and washed with 0.067 mmol · L-1sodium phosphate buffer (pH 6.4). A single drop of 0.2% of NBT solution placed on a slide and incubated for 30 min at 25℃. NBT cells were counted under the microscope (×100 objective lens) in triplicates.
The total proteins (TP) were determined using Randox TP (TP 245) kits. The 0.02 mL of the samples were mixed with 0.1 mL of R1 and R2 Biuret reagent and incubated at 25℃ for 30 min. The absorbances of the samples and standard reagent were measured against reagent blank using photospectometer (SM23A). The values were standardized using Randox calibration serum Level 3 traceable to TP reference material NIST 927d. TP was calculated using TP (g · dL-1) =Standard concentration (Oyeleseet al., 1999).

Albumin (ALB) was determined using Randox(ALB) AB 362 kit. Took 0.01 mL of the samples using micro-pipette, mixed with 0.5 mL of kit reagent and incubated for 5 min at 20℃ to 25℃. The absorbances of the samples and standard reagent were measured against reagent blank using photospectometer (SM23A). The values were standardized using Randox calibration serum Level 3 traceable to ALB reference material DA470 (IFCC). ALB was calculated usingALB(g · dL-1)Standard concentration (Omitoyinet al., 2006).

Aspartate aminotransferase (AST) was determined using Randox AS 101 kit. Took 0.1 mL of the samples using micro-pipette, mixed with 0.5 mL of Reagent 1 and incubated for 30 min at 37℃. The solutions were further mixed with 0.5 mL Reagent 2,mixed and allowed to stand for exactly 20 min at 20℃ to 25℃. Five mL of sodium hydroxide were added to the solutions and mixed. The absorbances of the samples were read against blank after 5 min using photospectometer (SM23A). The values were compared with absorbance table (Oyeleseet al., 1999).
α-oxoglutarate+L-aspartate GOT L-glutamate+oxaloacetate. AST was measured by monitoring the concentration of oxaloacetate hydrazone formed with 2, 4-dinitrophenylhydrazine.
Alanine aminotransferase (ALT) was determined using Randox AL 100 kits. Took 0.1 mL of the samples using micro-pipette, mixed with 0.5 mL of Reagent 1 and incubated for 30 min at 37℃. The solutions were further mixed with 0.5 mL Reagent 2, mixed and allowed to stand for exactly 20 min at 20℃ to 25℃.Five mL of sodium hydroxide were added to the solutions and mixed. The absorbances of sample were read against blank after 5 min using photospectometer(SM23A). The values were compared with absorbance table.α-oxoglutarate+L-alanineL-glutamate+pyruvate. ALT was measured by monitoring the concentration of pyruvate hydrazone formed with 2, 4-dinotrophenylhydrazine (Osuigweet al., 2005).
Alkaline phosphatase (ALP) was determined using Randox AP 542 kits. Took 0.01 mL of the samples using micro-pipette, mixed with 0.5 mL of kit reagent and incubated for 30 min at 37℃. The initial reading were taken and started timer simultaneously.Reading was taken again after 1, 2 and 3 min on photospectometer (SM23A). The values were calculated usingU/I=2 760×?A405 nm · min-1(Osuigweet al., 2005).
p-nitrophenylphosphate+H2Ophosphate+p-nitrophenol.
Urea was determined using Randox UR 1 068 kits.Took 10 μL of the samples using micro-pipette,mixed with 100 μL of Reagent 1 and incubated for 15 min at 37℃. The absorbances of the samples and standard were read on photospectometer (SM23A).The colour of the reaction was stable for at least 8 h.The values were calculated using urea concentration(mg · dL-1)Standard concentration (Ajeniyi and Solomon, 2014).
Standard concentration=79.81 mg · dL-1
Urea+H2O2NH3+CO2
NH3+hypochlorite+phenol→indophenol (blue compound)
Creatinines were determined using Randox CR 510 kits. Took 0.1 mL of the samples using micropipette, mixed with 1.0 mL of Reagent 1 and after 30 s read the absorbanceA1of the standard and the samples on photospectrometer (SM23A). Exactly 2 min later,read absorbanceA2of standard and the samples. The values were calculated usingA2-A1=?Asample,A2-A1=?Standard. Creatinine (mg · dL-1)Standard concentration×50. Standard concentration=2.06 mg · dL-1.The amount of complex formed was directly proportional to the creatinine concentration (Osuigweet al.,2005; Ajeniyi and Solomon, 2014).
The total immunoglobulin M (IgM) was determined by enzyme-linked immunosorbent assay (ELISA)using immunoglobulin M (IgM) ELISA kit for fish in the Chemical Pathology Laboratory of the Faculty of Veterinary Medicine, University of Ibadan, Nigeria following the manufacturer's instruction.
The juvenile common carps fed experimental diets for 56 days were challenged withPseudomonas aeruginosaandAeromonas hydrophillato examine its resistance against the pathogens for 14 days. The fish were intraperitoneally injected with 1.0×10⁷cfu · mL-1ofP. aeruginosaandA. hydriphillabroth (making two groups). Each group contained 120 fish (10 fish per tank) was randomly allotted to four treatments in triplicates in a completely randomized design. Relative protection level (RPL) was calculated as the following:

(Akanmuet al., 2016)
Data obtained were analyzed by one-way analysis of variance (ANOVA) atp=0.05. The means among the treatments were compared using Duncan's Multiple Range Test using SPSS statistical package (Version 20.0, IBM SPSS Inc., NY, USA).
Results
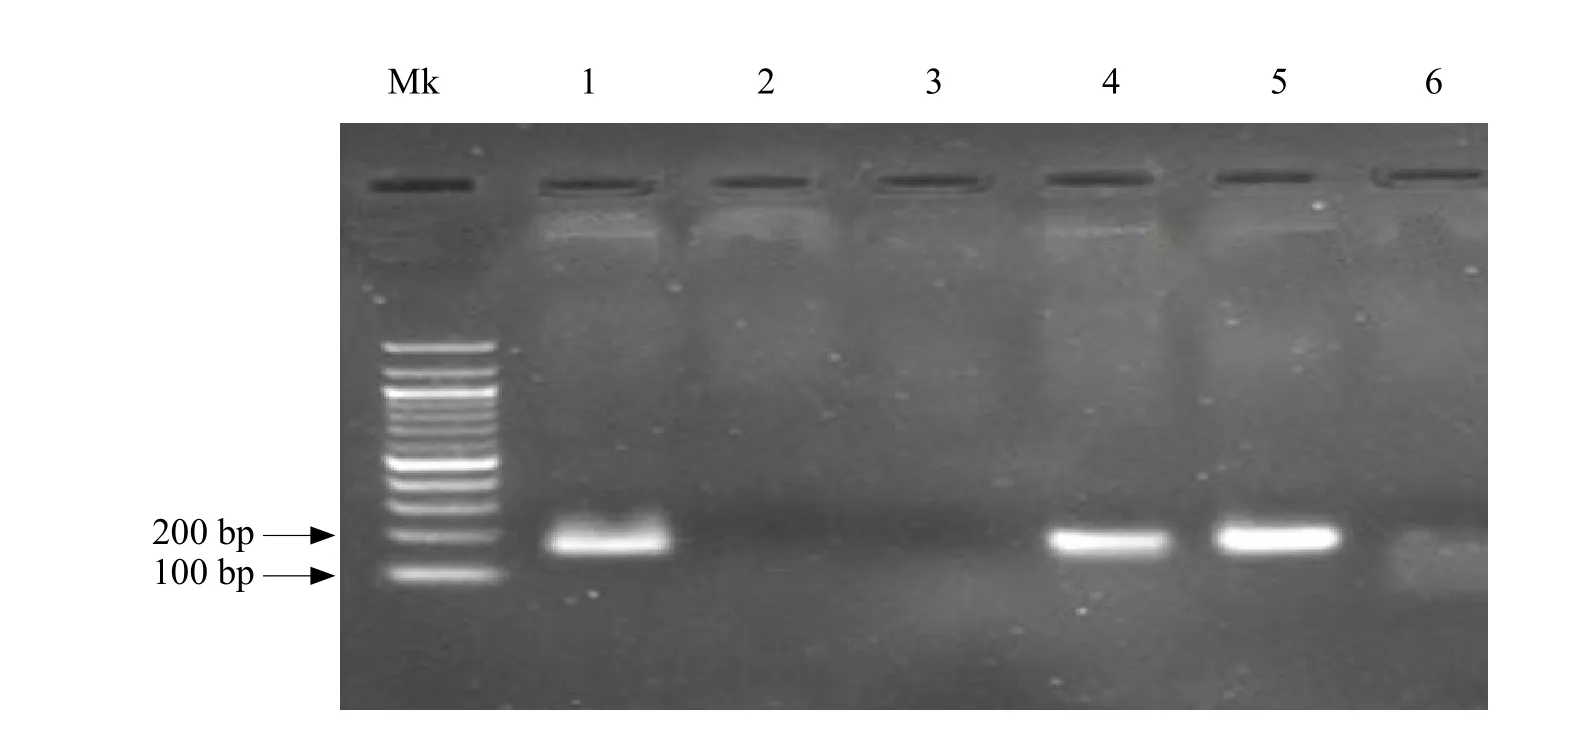
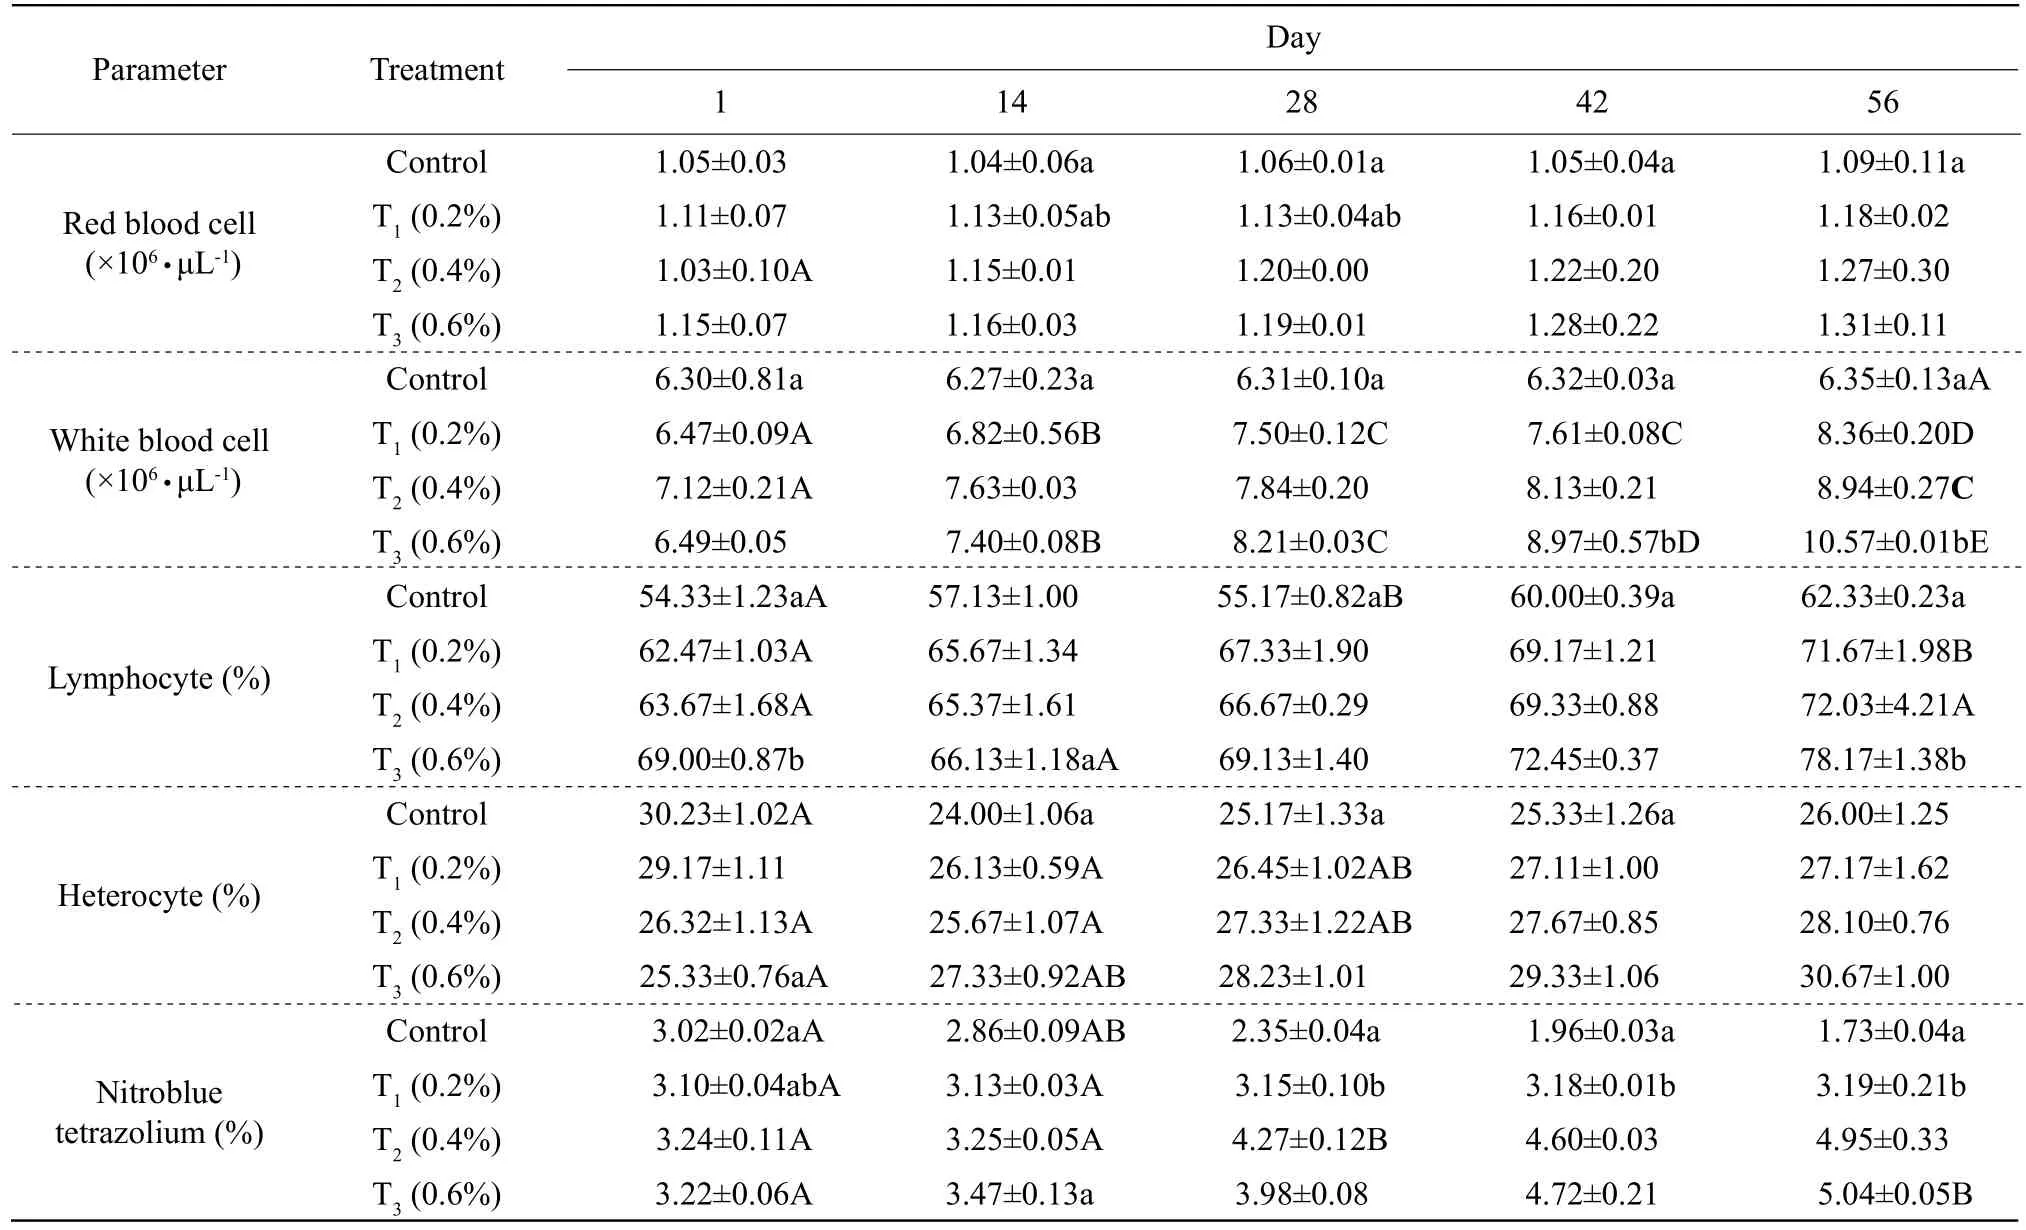
A total of 72 samples out of 100 were positive forLactobacillus genuswhile only 49 isolates wereLactobacilus acidophilus(Fig. 1). The effects ofLactobacillus acidophiluson non-specific immune response parameters of common carp are presented in Table 3. There were significant increases in the values of red blood cells, white blood cells, lymphocytes,heterocytes and nitroblue tetrazolium in treated groups when compared to the control group. However,red blood cells were progressively increased with increases of treatment days in treated groups except on the 1st day of fish treated 0.4%Lactobacillus acidophilusfortified diet. The highest white blood cells, heterocytes and nitroblue tetrazolium were observed on day 56 (p<0.05). There were increases in the parameter values in treated groups than those in the control.
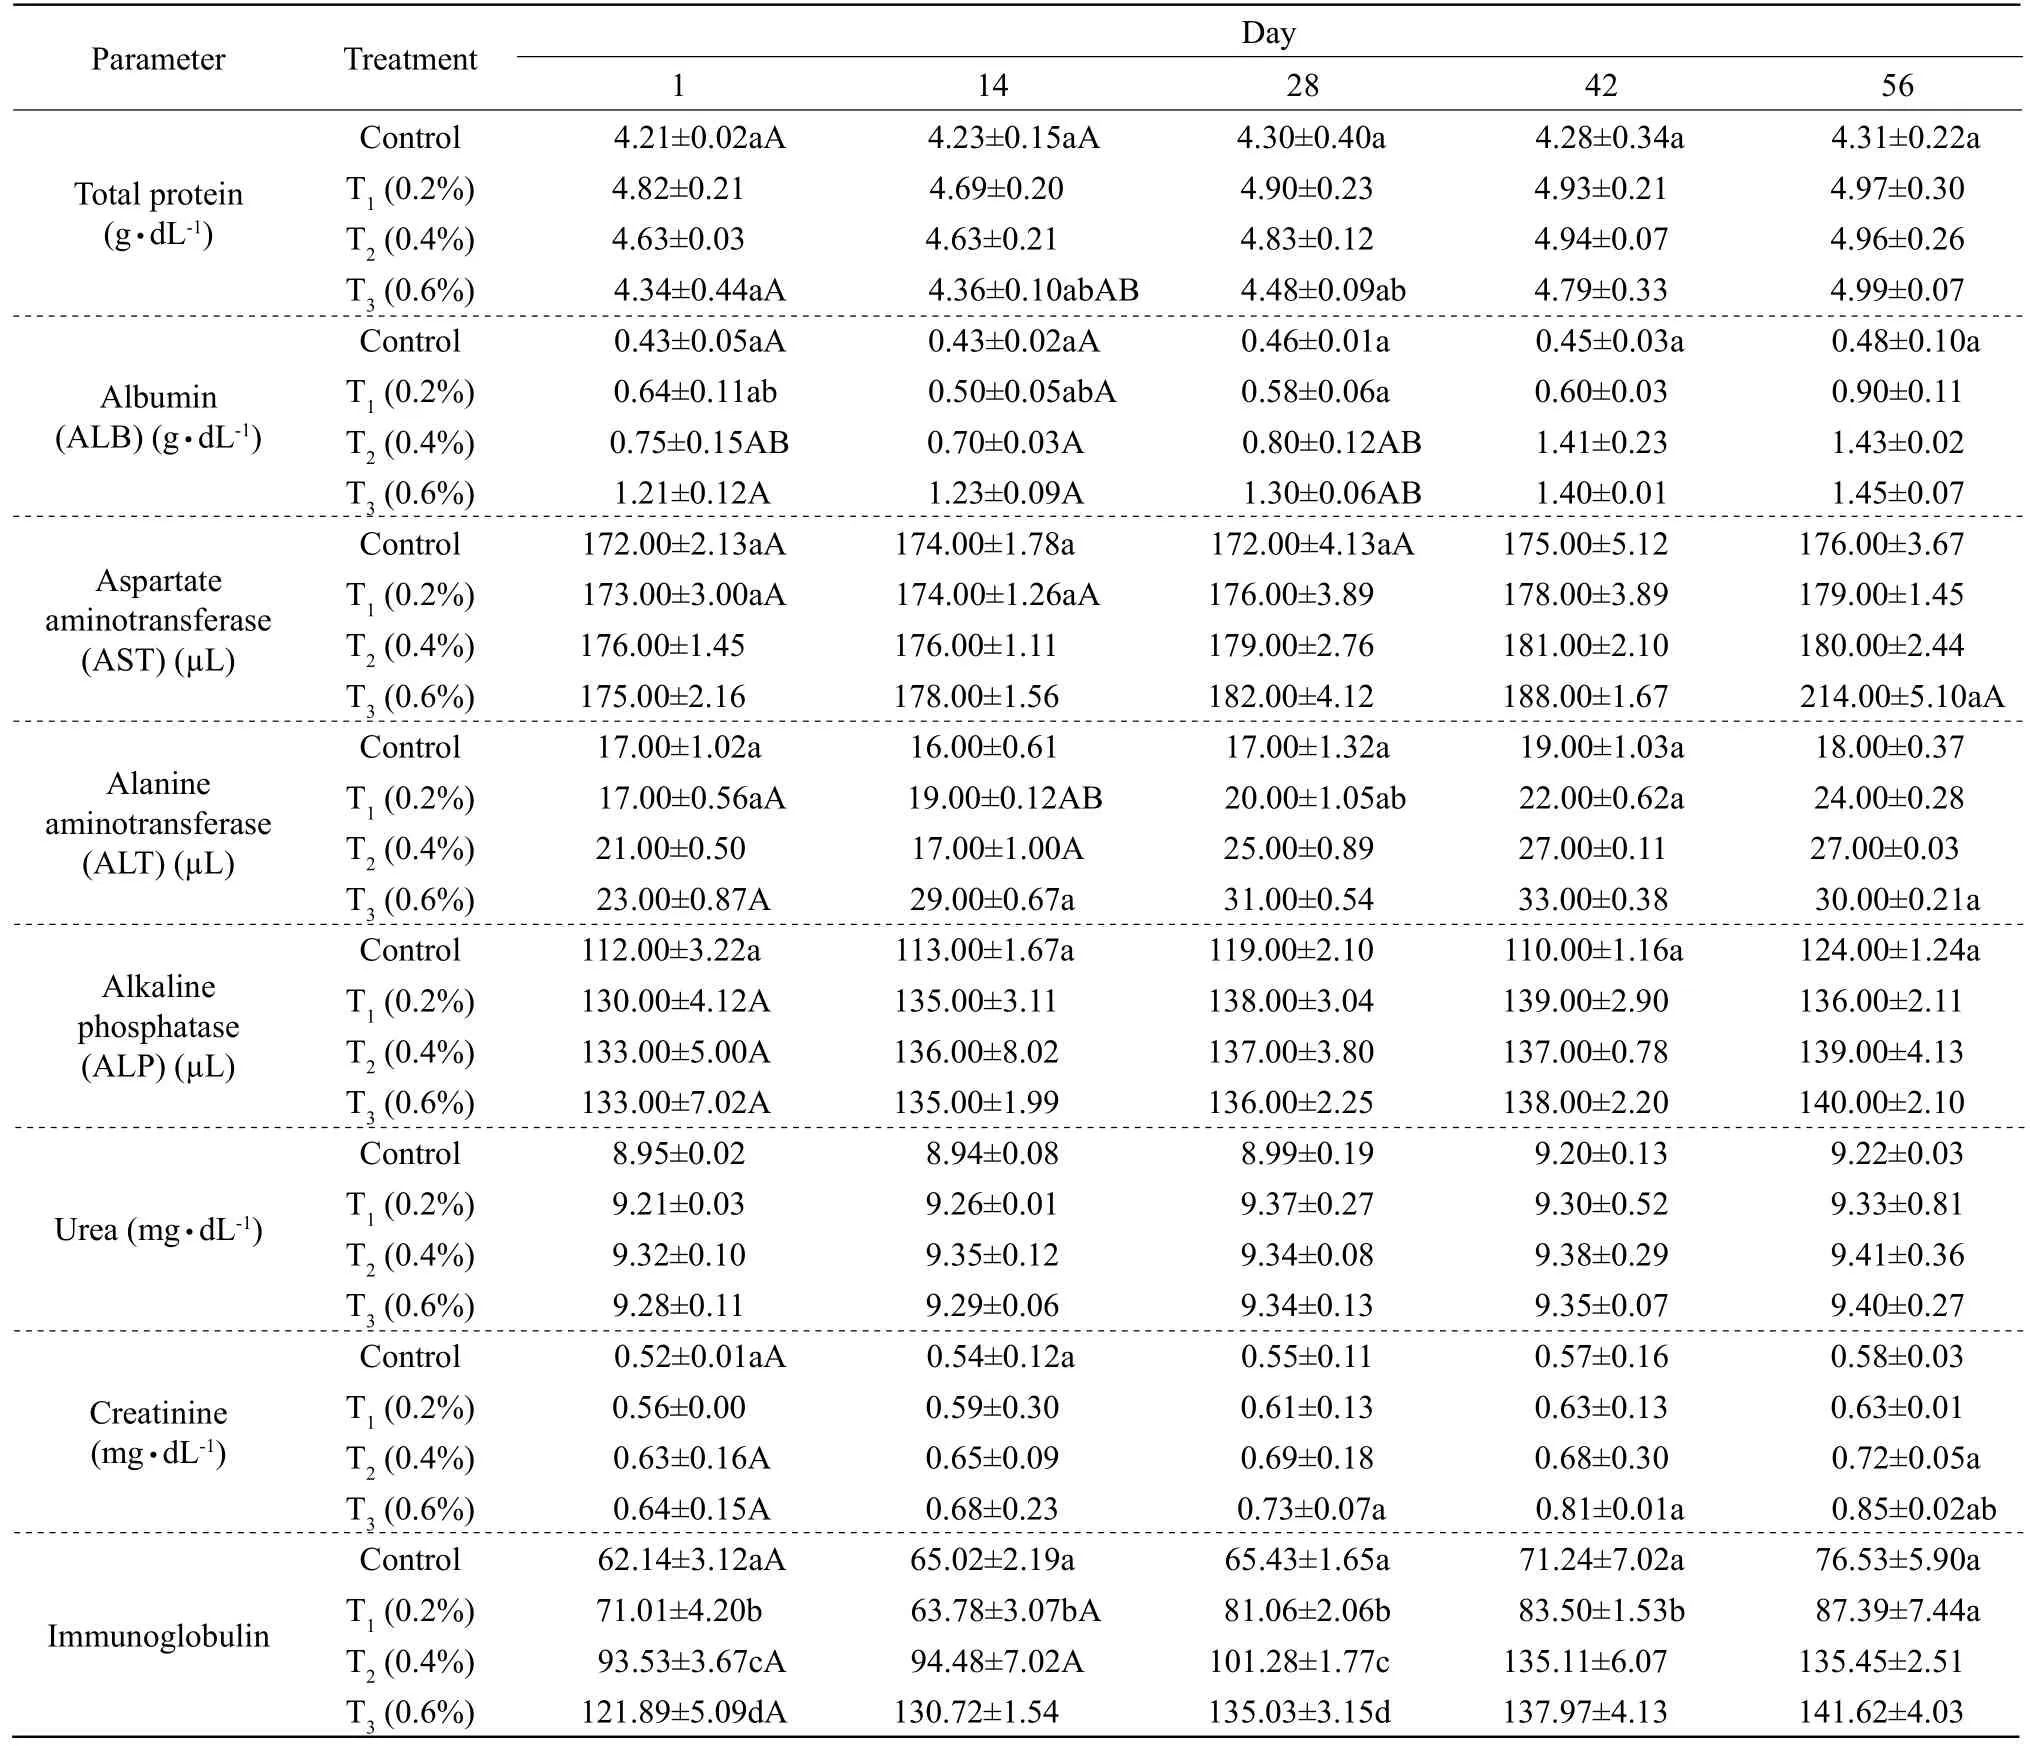
The total protein contents were significantly higher in groups fed withLactobacillus acidophilussupplemented diet, compared with the total proteins of the control groups (p<0.05) as revealed in Table 4.Albumin was higher in treated groups than that in the control group throughout the trial period. Fish fed diet T1showed no significant difference in the albumin on day 1 and day 14, but later improved on days 28 to 56. AST, ALT and ALP in fish fedLactobacillus acidophilusfortified diet were significantly higher than those in the control group (Table 4).

Fig. 1 Agarose gel of PCR products amplified by species-specific primers of Lactobacillus acidophilus 1, 4 and 5 confirmed Lactobacillus acidophilus, 199 bp.

Table 3 Red blood cells (RBC), white blood cells (WBC), lymphocytes, heterocytes and nitroblue tetrazolium (NBT) in blood samples of juvenile common carps fed diets fortified with different Lactobacillus acidophilus inclusion levels

Table 4 Total protein, albumin (ALB), aspartate aminotransferase (AST), alanine aminotransferase (ALT), alkaline phosphatase (ALP), urea, creatinine, creatinine, immunoglobulin in blood samples of juvenile common carps fed diets fortified with different Lactobacillus acidophilus inclusion levels

Table 5 Resistance of common carp juveniles challenged with Pseudomonas aeruginosa (1.0×10⁷ cfu · mL-1) and Aeromonas hydrophilla and fed with different levels of Lactobacillus acidophilus
Discussion
Continuous debate on the use of chemotherapeutic has ushered in the application of probiotics in aquaculture to enhance the immune system of fish. Various probiotics have been used to immune response of the fish, such asBacillus species(Guzel-Seydimet al.,2011),Lactobacillus species(Ulukoyet al., 2015),Lactobacillus fermentum(Akanmuet al., 2016),Saccharomyces cerevisiae(Akanmuet al., 2016) and Kefir (Ulukoyet al., 2017).
Previous studies have revealed that measurements of non-specific immune parameters in fish were valuable information on the health status of the fish. The results of this study depicted that haematological parameters such as red blood cells, white blood cells,lymphocytes, heterocytes and nitroblue tetrazolium were significantly increased in common carp fed diets fortifiedLactobacillus acidophilus. The results were in accordance with the findings of Faramarziet al.(2011) in rainbow trout and Al-Dohailet al. (2009)in African catfish fed diets containedLactobacillus acidophilus. Urea and creatinine were customarily to assess kidney function. Following protein metabolizes,the liver produced nitrogen which combined with other molecules in the liver to form urea, a waste product. When urea got to the kidneys, it was filtered out of the blood and dumped into the urine. Normal urea in fish values ranged from 7 to 20 mg · dL-1(NKF, 2002); however, higher values indicated kidney disease, congestive heart failure, gastrointestinal bleeding, shock, kidney failure, hypovolemia, a heart attack or a urinary tract obstruction, while low values depicted liver failure, malnutrition or overhydration. On the other hand, the waste product from muscle was called creatinine. Most of the creatinines in the body were removed by the kidneys,as it was an indication of kidney functionality. Normal creatinine values ranged from 0.8 to 1.4 mg · dL-1(NKF, 2002). In this present study, though most of the physiological values were within the recommended values, the urea values obtained in the fish fed control diet were lower than those in the fish fedLactobacillus acidophilus. Similarly, fish fed experimental diets had significantly higher creatinine levels than the control group. The results revealed a better condition/health status of treated fish which translated to a better immune system as a result of probiotics inclusion in the diets. In the same vein, liver specific enzymes of the treated groups were significantly higher than those of the control group.
The major components of the immune response against pathogen were immunoglobulin and were examined in this study. The results of this study revealed a significantly increase in the level of immunoglobulin in the fish fedLactobacillus acidophilusfortified diets when compared to that in the control group. Previous studies of Panigrahiet al. (2004), Al-Dohailet al. (2009), Canet al. (2012), Akanmuet al.(2016) and Ulukoyet al. (2017) showed an increase in the immunoglobulin in fish fed probiotics usingLactobacillus rhamnosus,Lactobacillus acidophilus,Lactobacillus fermentumand Kefir, respectively.These results in terms of trend shared the similar view with the present study.
An investigation into the survival rate of common carp fedLactobacillus acidophilusand challenged withPseudomonas aeruginosaandAeromonas hydrophillashowed significant increase survival rates in treated groups than those in the control, which was in agreement with previous studies (Gildberget al.,1997; Nikoskelainenet al., 2001; Sonet al., 2009;Faramarziet al., 2011; Pereze-Sanchezet al., 2011;Genget al., 2012; Abumouradet al., 2013; Araujoet al., 2015).
Conclusions
Diets fortified withLactobacillus acidophilusincreased the non-specific immune parameters and other haematological parameters of common carp.Also, fish fed diets fortified withLactobacillus acidophilusrelatively protected fish against pathogenicPseudomonas aeruginosaandAeromonas hydrophilla.Therefore, diets fortified withLactobacillus acidophilusat 0.4% was recommended to improve the non-specific immune response of common carps and elevated its protection against pathogenic bacteria.
Abumourand I M K, Abbas W T, Awaad E S,et al.2013. Evaluation ofLactobacillus plantarumas a probiotic in aquaculture:emphasis on growth performance and innate immunity.Journal of Applied Sciences Research, 9: 572-582.
Ajani E K, Akinwole A O, Ayodele I A. 2011.Fundamentals of fish farming in Nigeria.Ibadan Walecrowns Ventures, Nigeria.
Ajeniyi S A, Solomon R J, 2014. Urea and creatinine of Clarias gariepinusin three different commercial ponds.Nature and Science,12: 124-138.
Akanmu O A, Emikpe B O, Omitoyin B O,et al. 2016. Evaluation of the wound healing potential of the diets fortified withLactobacillus fermentum,Saccharomyces cerevisiaeand their combination inHeterobranchus bidorsalisjuveniles.Zoology and Ecology, 26:323-330.
Al-Dohail M A, Hashim R, Aliyu-Paiko M. 2009. Effects of the probiotic,Lactobacillus acidophilus, on the growth performance,haematology parameters and immunoglobulin concentration in African catfish (Clarias gariepinus, Burchell 1822) fingerling.Aquaculture Research, 40: 1642-1652.
Amin M, Goodarzi H, Orang Z,et al. 2011. Isolation and identification ofLactobacillusspecies from the vagina and their antimicrobial properties.African Journal of Microbiology Research, 5: 3300-3304.
Anderson D P, Moritomo T, Grooth R D. 1992. Neutrophile, glassadherent, nitroblue tetrazolium assay gives early indication of immunization effectiveness in rainbow trout.Veterinary Immunology and Immunopathology, 30: 419-429.
Araujo C, Munoz-Atienza E, Perez-Sanchez T,et al. 2015. Nisin Z production byLactococcus lactissubsp. Ceremis WA2-67 of aquatic origin as a defense mechanism to protect rainbow trout(Onchorhychus mykiss, Walbaum) againstLactococcus garvieae.Marine Biotechnology, 51: 820-830.
Can E, Kutluyer F, Sonay F D,et al.2012. The use of kefir as potential probiotic in Coruh trout (Salmo coruhensis): effects on growth performance an immunoglobulin (IgM) levels.African Journal ofBiotechnology, 11: 7775-7780.
Faramarzi M, Kiaalvandi S, Lashkarbolooki M,et al. 2011. The investigation ofLactobacillus acidophilusas probiotics on growth performance and disease resistance of rainbow trout (Oncorhychus mykiss).American-Eurasian Journal of Scientific Research, 6: 32-38.
Geng X, Dong X H, Tan B P,et al. 2012. Effects of dietary probiotic on the growth performance, non-specific immunity and disease resistance of cobia,Rachycentron canadum.Aquaculture Nutrition,18: 46-55.
Gildberg A, Mikkelsen H, Sandakar E,et al. 1997. probiotic effect of lactic acid bacteria in the feed on growth and survival of fry of Atlantic cod (Gadus morhua).Hydrobiologia, 352: 279-285.
Guzel-Seydim Z, Kok-Tas T, Greene A K. 2011. Review: functional properties of kifr.Critical Reviews in Food Science and Nutrition,51: 261-268.
Lim C, Sukhawongs S, Pascual F P. 1979. A preliminary study on the protein requirements ofCyprinos carpio(Forskal) fry in a controlled environment.Aquaculture, 17: 195-201.
Laboratory Quality Assurance Division (LQAD). 2008. Isolation and identification ofListeria monocytogenesfrom red meat, poultry,egg and environmental samples.http://www.lqad_quality.org/listeriamonocytogenes.
Monuz-Atienza E, Gomez-Sala B, Araujo C,et al. 2013. Antimicrobial activity, antibiotic susceptibility and virulence factors of lactic acid bacteria of aquatic origin intended for use as probiotics in aquaculture.MC Microbiology, 24: 13-15.
National Kidney Foundation (NKF). 2002. Clinical practice guidelines for chronic kidney disease: evaluation, classification and stratification.American Journal of Kidney Diseases, 39: 1-266.
Nayak S K. 2010. Probiotics and immunity: a fish perspective.Fish and Shellfish Immunology, 29: 2-14.
Nikoskelainen S, Ouwehand A C, Bylund G,et al. 2001. Protection of rainbow trout (Oncorrhychus mykiss) from furunculosis byLactobacillus rhamnosus.Aquaculture, 198: 229-236.
Omitoyin B O, Ajani E K, Adesina B T,et al. 2006. Toxicity of lindane(gamma hexachloro-cyclottexane) toClarias gariepinus(Buchel,1822).World Journal of Zoology, 1: 57-63.
Oresegun A, Alegbeleye W O. 2001.Serum and tissue thiocynate concentration in Tilapia(Oreochromis niloticus)fed cassava peels based diets supplemented with D,L methionine. In: Eyo A A.Proceeding of the 21st Fisheries Society of Nigeria on Fish Nutrition and Fish Feed, Ilorin.
Osuigwe D I, Obiekezie A I, Onuoha G C. 2005. Some haematological changes in hybrid catfish (Heterobranchus longifilis×Clarias gariepinus) fed different dietary levels of raw and boiled jackbean(Canavalia ensiformis) seed meal.African Journal of Biotechnology,4: 1017-1021.
Oyelese A O, Taiwo V O, Ogunsanmi A O,et al. 1999. Toxicological effects of cassava peels on haematology serum biochemistry and tissue pathology ofClarias gariepinusfingerlings.Tropical Veterinarian,17: 17-30.
Oyewale J O. 2011.Blood:different strokes for different animals. 19th May, 2011, an inaugural lecture delivered at University of Ibadan.
Panigrahi A, Kiron V, Kobayashi T,et al. 2004. Immune responses in rainbow troutOncorhychus mykissinduced by a potential probiotic bacterialLactobacillus rhamnosusJCM 1136.Veterinary Immunology and Immunopathology, 102: 379-388.
Perez-Sanchez T, Balcazar J L, Merrifield G L,et al.2011. Expression of immune-related genes in rainbow trout (Onchorhychus mykiss)induced by probiotic bacteria duringLactococcus garvieaeinfection and withdrawal times of oxytetracycline in aquaculture.Reviews in Aquaculture, 7: 77-106.
Pyar H, Peh K K. 2014. Characterization and identification ofLactobacillus acidophilususing biolog rapid identification system.International Journal of pharmacy and Pharmaceutical Sciences, 6:189-193.
Schaperclaus W, Kulow H, Schreckenbach K. 1991.Hematological and serological technique. New Delhi, India. pp. 12-17.
Son V M, Chang C C, Wu M C,et al. 2009. Dietary administration of the probiotic,Lactibacillus plantarum, enhanced the growth,innate immune responses, and diseases resistance of the grouperEpinephelus coiodes.Fish and Shellfish Immunology, 26: 691-698.
Ulukoy G, Kubilay A, Guzel-Seydim Z,et al. 2015. Effect of storage temperature on beneficial microbial load in rainbow trout feed supplemented with kifir.The Indian Journal of Fisheries, 62:137-139.
Ulukoy G, Metin S, Kubilay A,et al. 2017. The effect of kefir as a dietary supplement on nonspecific immune response and disease resistance in juvenile rainbow trout,Oncorhynchus mykiss(Walbaum 1792).Journal of the World Aquaculture Society, 48: 248-256.
Wang Y B, Li J R, Lin J. 2008. Probiotics in aquaculture: challenges and outlook.Aquaculture, 28: 1-4.
 Journal of Northeast Agricultural University(English Edition)2018年2期
- Journal of Northeast Agricultural University(English Edition)的其它文章
- Research on Market Risk Assessment of Dairy Farms: Taking 75 Dairy Farms in Heilongjiang Province as Examples
- Agricultural Exports Competitiveness of Pakistan in Global Market
- New Islanding Detection Method with Better Performance in Presence of Non-resistive Load
- Design of Greenhouse Environment Control System Based on Internet of Things
- Identification and Genetic Diversity Analysis of Chinese Mitten Crab(Eriocheir sinensis) in the Liao River Area
- Evaluation of Post-operative Anti-stress Response of Dexmedetomidine in Dogs
