Smart Prediction for Seamless Mobility in F-HMIPv6 Based on Location Based Services
Rawya Rizk, Heba Nashaat
Electrical Engineering Department, Port Said University, Port Said, 42523, Egypt
I. INTRODUCTION
Location Based Services (LBS) is becoming one of the most important features in mobile devices. It has a number of uses in social networking today as an entertainment service, which is accessible with mobile devices through the mobile network and which uses information on the geographical position of the mobile device. LBS are also used in a variety of contexts, such as indoor object search,entertainment, work, and personal life. It is a wireless-IP service that uses geographic information to serve a mobile user and enlarge the scope of mobile applications [1-4].
Mobility management is an essential technology for keeping track of the users’ current location and for delivering data correctly. The Internet Engineering Task Force (IETF) has proposed Mobile IPv6 (MIPv6) [5] as the main protocol for mobility management at the IP layer. Several extensions such as Fast Handoff for Hierarchical Mobile IPv6 (F-HMIPv6)protocol has been proposed to enhance the performance.
Figure 1 shows the network model of F-HMIPv6. A domain is managed by Mobility Anchor Point (MAP). While entering a MAP domain, the mobile node (MN) receives router advertisements containing information about local MAPs from Access Routers (ARs) within range. The MN obtains two care of addresses (CoAs): an onlink Local CoA (LCoA) and a Regional CoA (RCoA) within the selected MAP domain. Then, a Local Binding Update(LBU) message is sent to the MAP to bind the MN’s LCoA with its RCoA. Upon receipt of a successful Binding Acknowledgment (BA),the MN updates the binding of its RCoA with the home agent (HA) and each corresponding node (CN). As a result, packets destined to the MN are intercepted by the MAP, encapsulated and forwarded to the MN’s on-link address. A movement within the MAP domain (intra domain) merely incurs LBUs at the MAP without further propagation to the HA and CNs.Thus, it significantly reduces the signaling load and micro-mobility related handoff delays. F-HMIPv6 is an effective integration that has been designed to enable a MN to exchange handoff signaling messages with a local MAP and to establish a tunnel between the MAP and New AR (NAR) instead of between the Previous AR (PAR) and NAR [6].
Some literatures introduce seamless handoffs in wireless networks by using prediction techniques have been presented. However,they have rarely addressed issues with predictions of behavior in real deployment. In addition, previous schemes based on F-HMIPV6 usually suffer from three major drawbacks:First, they do not consider the QoS of the traffi c. Second, they only focus on the micro mobility level. Third, they do not take advantage of the information they already have about the user mobility behavior in order to reduce handoff effects.
This paper presents a performance evaluation analysis for original protocol for micro and macro handoff cases. Then solves the problem of quantifying the degradation of quality of services (QoS) a mobile user perceives during macro and micro handoff, and the signaling load costs associated with each case. In this paper, F-HMIPv6 based on LBS(LBS_ F-HMIPv6) scheme is proposed. It considers LBS that uses the available information about MN such as user mobility patterns to predict handoff and improve network’s QoS. This information is used efficiently to reduce handoff latency and improve services.The performance of the proposed scheme is verified by analysis. The comparison of F-HMIPv6 and the proposed scheme shows a significant improvement in the performance of the proposed scheme in terms of packet delivery cost and location update cost under the variation of user density and session-to-mobility ratio.
The reset of this paper is organized as follows. Section II presents the related work. The proposed scheme is presented in Section III.The analytic models are shown in Section IV.Section V presents the simulation results for the prediction system. Section VI introduces the numerical results. Finally, Section VII,presents the concluding remarks.
In this paper, a proposed scheme for smooth handoff over F-HMIPv6 networks is introduced.
II. RELATED WORK
Several extensions of MIPv6 such as Fast Handoffs for MIPv6 (FMIPv6) and Hierarchical MIPv6 (HMIPv6), have been proposed to enhance MIPv6. Combination of HMIPv6 and FMIPv6 motivates the design of F-HMIPv6 protocol. It combines more efficient network bandwidth usage of HMIPv6 and the less handoff latency and packet loss of FMIPv6.
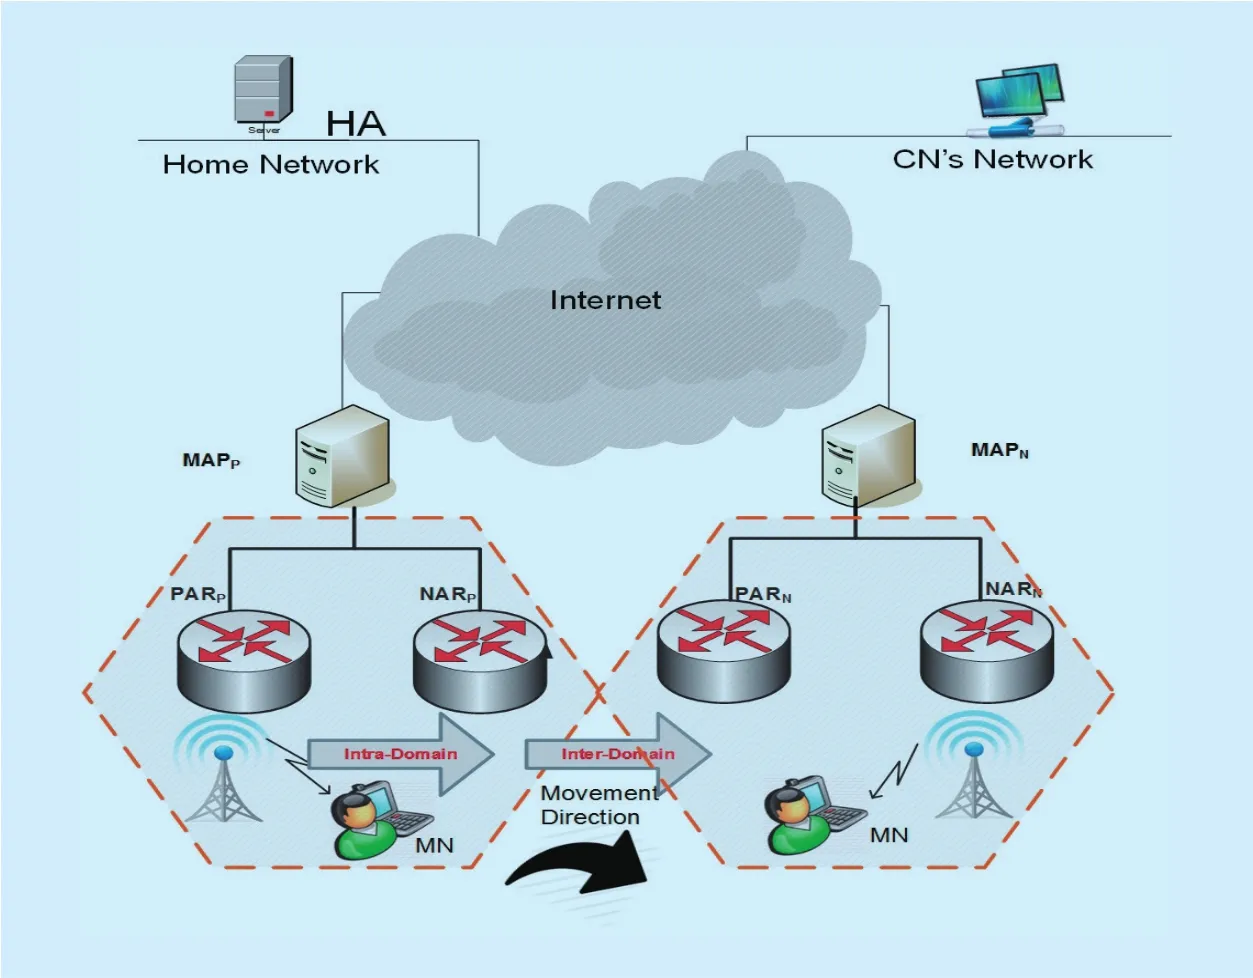
Fig. 1. Network Model of F-HMIPv6.
Some literatures introduce performance analysis of IPv6 mobility management protocols using analytical models have been presented. These literatures involve the performance analysis of MIPv6 [7, 8], the performance for Hierarchical MIP (HMIP), Dynamic HMIP (DHMIP), and Multicast HMIP (MHMIP) [9], the performance of Proxy MIPv6(PMIPv6) [10], and comparison between PMIPv6 and Fast PMIPv6 (FPMIPv6) [11]. In[12], the performance analysis of F-HMIPv6 is presented. The analytical comparison between MIPv6, FMIPv6, HMIPv6, and a combination of FMIPv6 and HMIPv6 are introduced in [13,14]. Enhanced Scheme of F-HMIPv6 (ES-FHMIPv6) that is introduces the enhancement of F-HMIPv6 is presented in [15].
A number of literatures introduce seamless handoffs in wireless networks by using prediction techniques have been introduced. Some prediction techniques estimate the received signal strength value for the ARs and select the best candidate AR [16-19]. In [20], the prediction is based on selection metrics that are collected and considered inputs of a fuzzy decision making system in order to select the best preferable AR. Three prediction schemes are presented. In Adaptive Handoff Prediction(AHP), handoff decisions are performed in each MN independently based on the direction toward APs, and it’s load. In Access Point candidacy value (APCV), the decision-making parameters are data rate and mobile speed. In D-Scan which considers QoS of ongoing applications, all obtained APs are stored in a local AP database. Thus, the scan process finds a certain number of APs with acceptable signal strength.
Some of mobility prediction schemes are based on Markov Chains. In [21], a developed model that is based on Markov chain, predicts the user’s trajectory in terms of a handoff sequence in order to minimize the interruption time and the associated signaling when the handoff is triggered. In [22], a SmartDC comprises unsupervised mobility learner, mobility predictor, and Markov decision process-based adaptive duty cycling is presented. SmartDC estimates the regularity of individual mobility and predicts residence time at places to determine ef fi cient sensing schedules.
In [23], MAHO_FHMIPv6 scheme is presented. It is based on F-HMIPv6 which implements a combined-detection function between MN and MAP and calculates the Normalized Edit Distance is presented to analyze the motion trail and estimate the motion pattern of MN. According to the estimating result, MAP determines the way MN attaches to the new AR so as to reuse some previous handoff information. However, it lacks in analysis since its performance is based on simulation, and it considers only micro mobility. In addition, it considers some known motion patterns such as ping pong, random, and linear instead of real motion.
Previous works in F-HMIPV6 have rarely addressed issues with predictions of behavior in real deployment. They do not take advantage of the information they already have about the user mobility behavior in order to reduce handoff effects. In addition, they only focus on the micro mobility level and they do not consider the QoS of the traffic. In this paper, the user mobility behavior is considered which is based on real motion. It considers LBS that uses the available information about MN such as user mobility patterns to predict handoff and improve network’s QoS. This information is used efficiently to reduce handoff latency and improve services. The paper also presents the analysis of both micro and macro handoffs.
III. THE ARCHITECTURE OF THE PROPOSED LBS_ F-HMIPV6 SCHEME
In this section, the proposed LBS_ F-HMIPv6 scheme is presented. It has the advantages of low latency and fast handoff. In real life,most people usually follow a finite number of paths such as the path from home to work.According to this observation the proposed scheme defines a number of mobility patterns based on user daily behavior. This information is used efficiently to reduce handoff latency and improve services. The user may change his behavior at any moment. For example, if he would like to try something new such as traveling to another town in the weekend. In this case, he follows a new path which is not included in his known mobility profiles. The proposed scheme adapts with such situations by using LBS.
Figure 2 shows the major components of the proposed scheme. It consists of a prediction system in MN which is presented as software package installed in MN’s operating system. This package uses a learning algorithm to gather information about user behavior using LBS. This information is used to create user mobility pro files which can be used to predict the NAR in order to reduce handoff latency.So the prediction system is mainly based on user mobility pro files.
The proposed LBS_ F-HMIPv6 scheme works as follows: First, Layer 2 (L2) in MN indicates that there is available AR, and then it searches the mobility profile stored in MN for a path that contains the current AR’s IP. If a number of matching paths appear as a result of this search, prediction system selects three paths that have highest weights and uses them to predict NAR’s IP and its MAP. In this case,the prediction process becomes successful as it returns the paths containing MN’s current point. Then, MN can register with NAR and send the LBU message to NARs. L2 starts the handoff procedure and Layer 3 (L3) connection is lost. In the end, MN sends BU message to HA. All CNs will continue sending and receiving packets via NAR.
The prediction system of the proposed scheme is implemented in MN to predict the NAR in order to reduce handoff latency. The prediction is based on the information stored in user mobility pro file allocated by LBS. The system is presented as a software package that is installed on MN’s operating system as a necessary step when the network is con figured on the MN’s device for the first time. This software works as a running LBS which aims to collect information about the user and analyze this information to update user pro file.
The prediction system works when the service faces L2 triggering situation in which L2 indicates that a NAR is available, or when it receives a better signal from NARNfollowed by the degradation of the PAR’s signal. This type of events generated by L2 mechanisms,forces the prediction system to invoke AR’s IP prediction algorithm to predict the NAR based on the existing mobility pro file.
The program’s main structure can be represented by the pseudo code in Figure 3, in which the main loop runs forever to present the running service that keeps track of the MN’s different events such as L2 triggering or capturing user behavior.
The prediction system can be divided into two modules: the training module and the AR’s IP prediction module.
i) The training module is presented in Figure 4. LBS information trains the proposed system to understand the user behavior. For example, most mobile users leave their homes in the morning heading to work using the same paths every day. They probably would like to take advantage of the time they waste in transition between work and home. So they use their cell phones/laptops to accomplish work using network services that include dealing with different traffic types.

Fig. 2. The architecture of the proposed LBS_ F-HMIPv6.
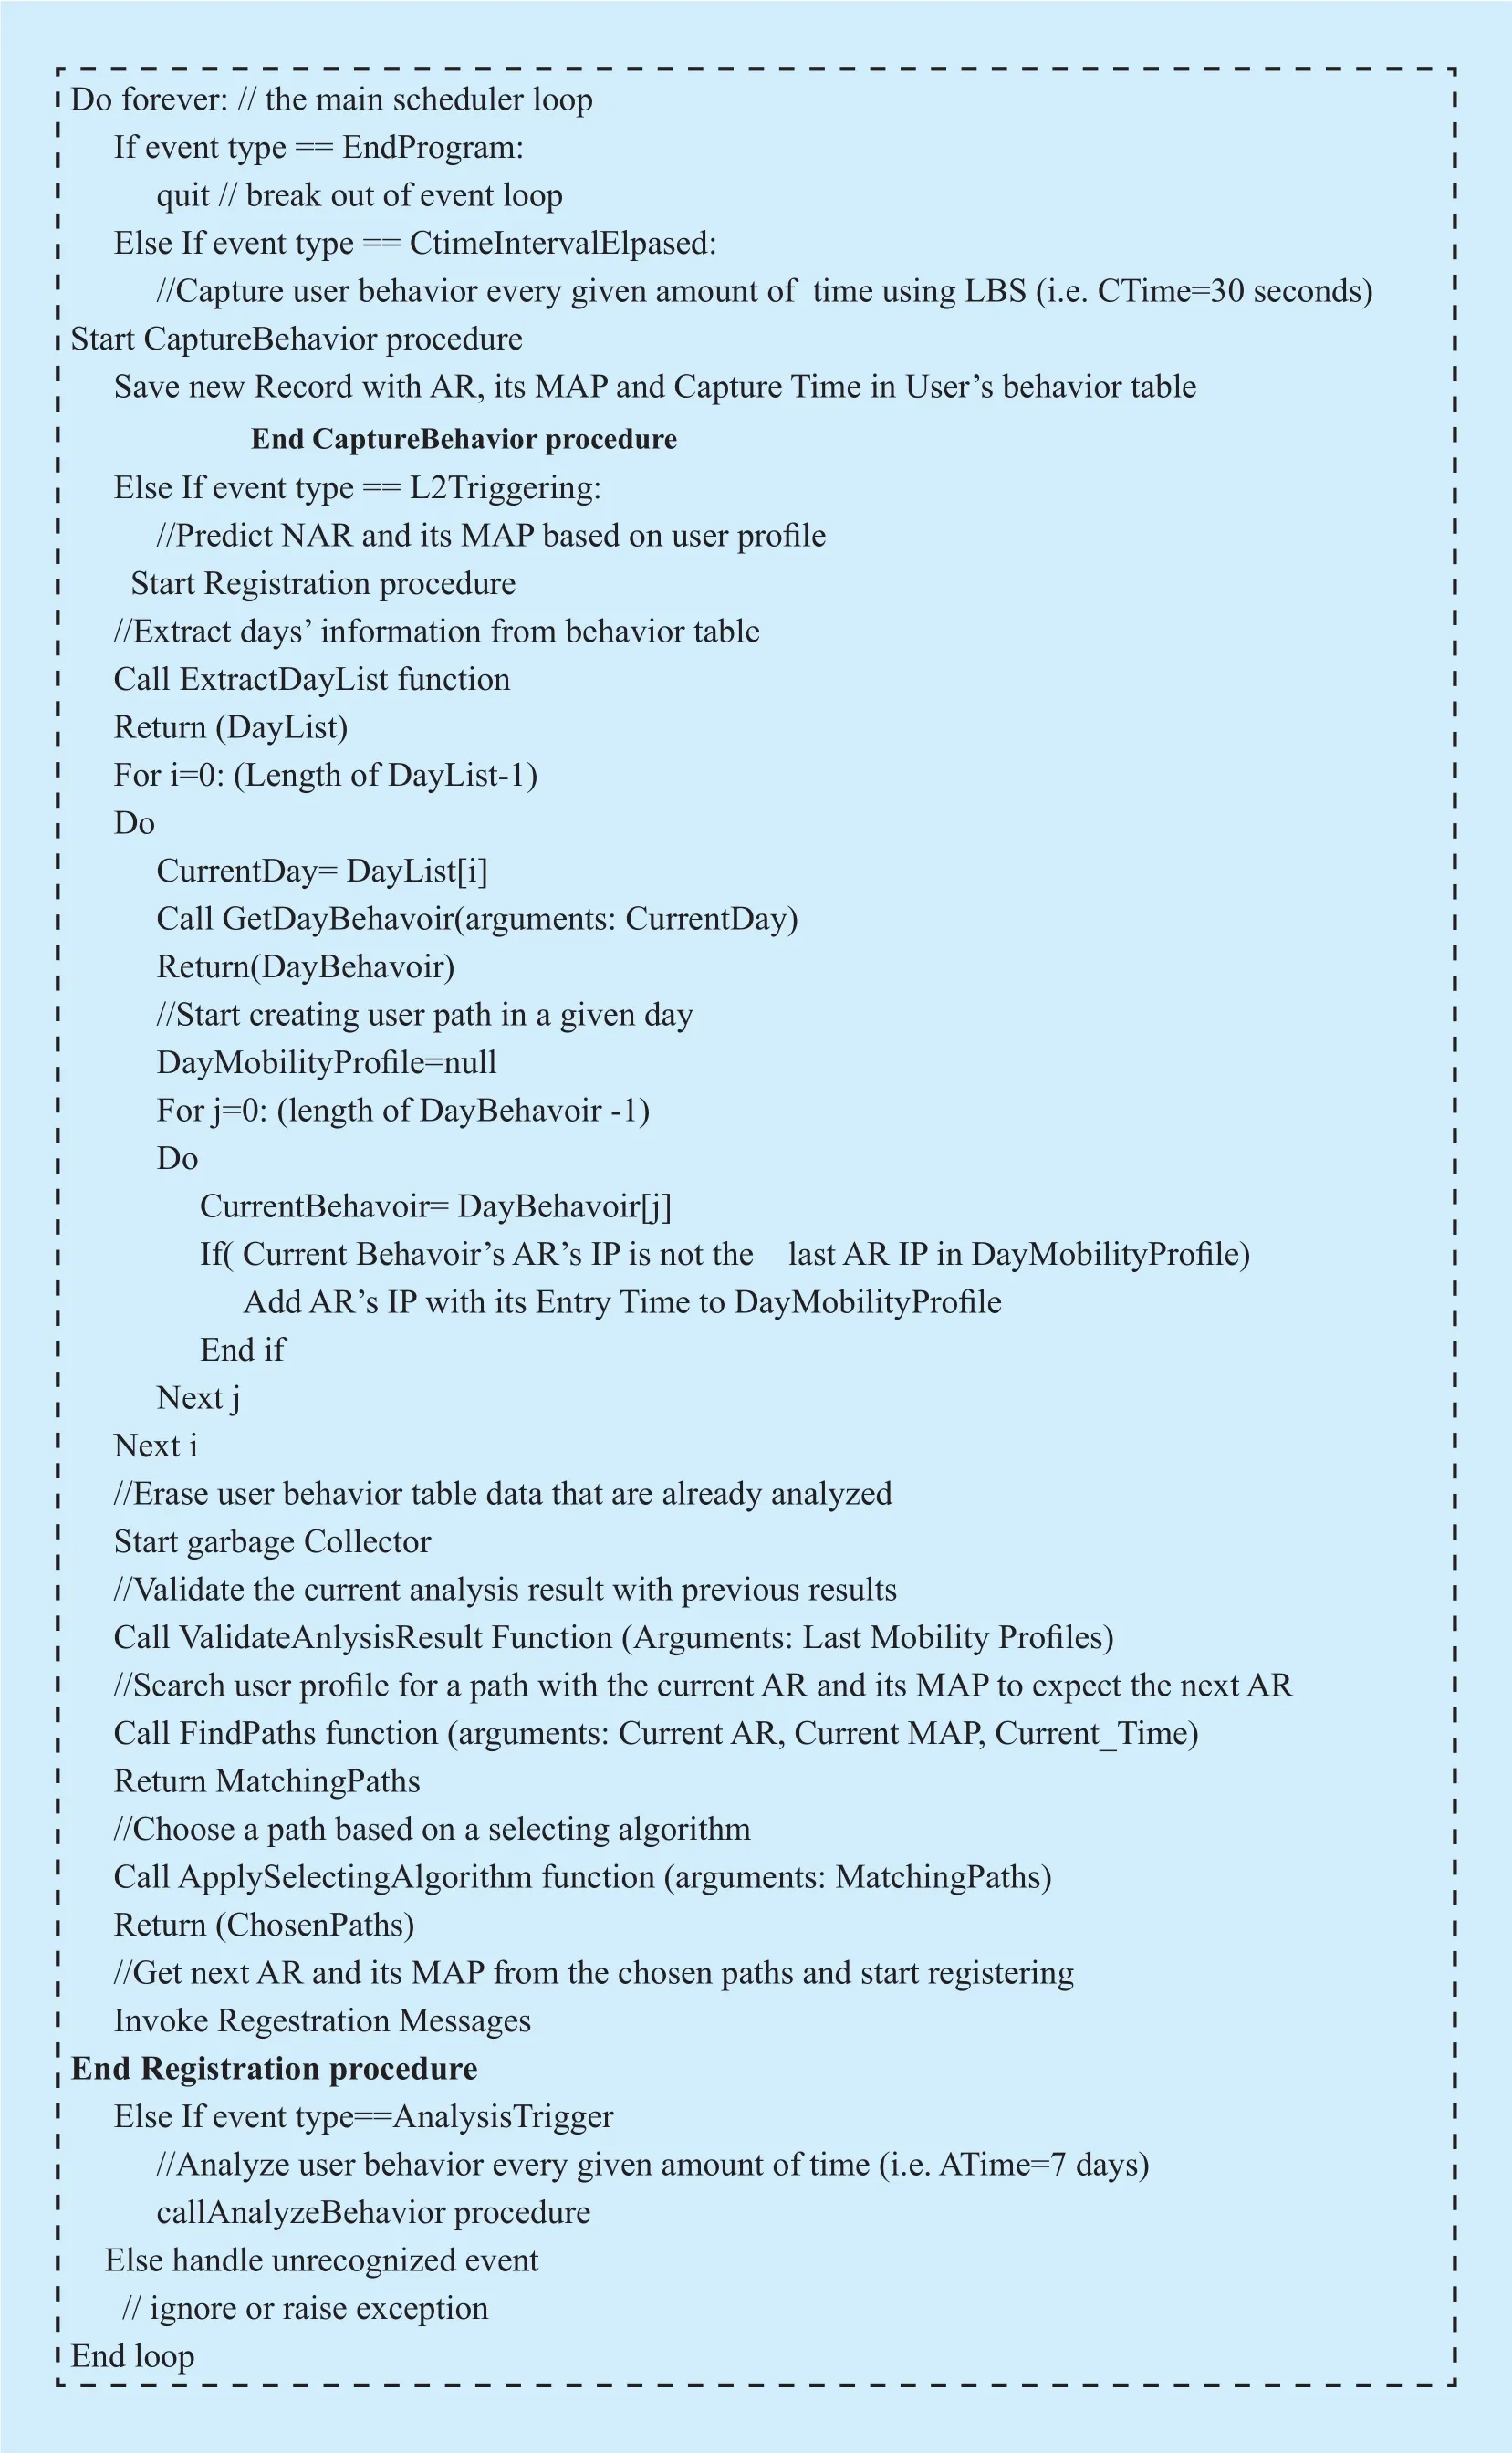
Fig. 3. Pseudo code of main program.
The training system gathers LBS information about the user and concatenating with cur-rent AR’s IP and MAP. The system captures this information every given amount of time called capture time. This information is stored in MN’s memory to build the user behavior table. User behavior table contains records showing changing AR’s IP and MAP along the user’s day. The pseudo code of the “Capture Behavior” event handler is presented in Figure 5.
The second part in the training module is the analysis process. The system uses the gathered information and analyses it to con figure mobility patterns for the user. The analysis process is executed after given amount of time called analysis time.
The training module invokes analysis procedure is shown in Figure 6. In the analysis process, every captured event in the user’s behavior table is analyzed. The output of the analysis procedure would be a mobility profile that shows a list of paths the user follows during the analysis time. For example, on the fi rst day the user leaves home at 6:00 am, and goes to the work. In his way the user crosses the ARs [PARP, NARP, PARN, and NARN] at 6:30, 7:15, 8:00, and 9:00 am; respectively.Then he arrives his work in NARNat 9:00 am,stays at work till 4:00 pm, and then returns to home passing ARs [NARN, PARN, NARP, and PARP].
Then, this path [PARP, NARP, PARN, NARN,PARN, NARP, and PARP] is stored. Each AR with its entry time and the path is linked to its day. This linked path presents a record in the generated user mobility pro file that would contains a record for every day in the analysis period. The mobility profile is the output of the analysis process. In order to have a result with high precision, the generated mobility profile must be validated with the previous mobility pro file which was generated from the last analysis process.

Fig. 4. Training procedure.

Fig. 5. Pseudo code of “Capture Behavior” procedure.
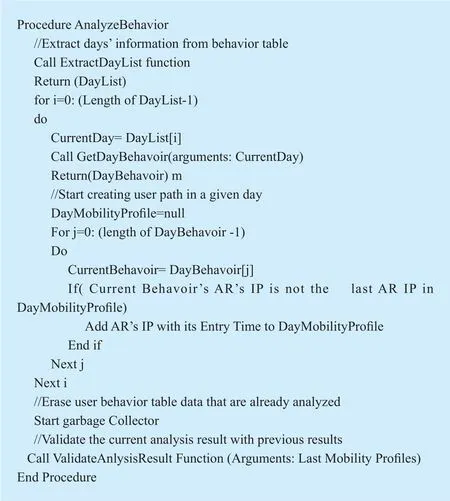
Fig. 6. Pseudo code of “Analyze Behavior” procedure.
Validation process involves comparing the results and shows what paths the user usually takes in his daily life. Validation emphasizes these paths and gives them a higher weight according to how much the user takes these paths. Validation process also takes notice if the user changes his daily behavior. For example, if the user changes his work place, a new path is detected. The program analyzes it and replaces the new path with the corresponding old one. The output of the validation system is the validated mobility profile and this is the pro file in which the system uses to predict NAR’s IP.
ii) The prediction system which is the AR’s IP prediction is presented in Figure 7. In this procedure, the system inquires the mobility profile about the predicted NAR’s IP. This happens when L2 indicates that a NAR is available. In this case, the system asks the mobility pro file if the user has already experienced this AR’s IP at a time which is close to the current. Then, the mobility pro file returns one or more matching paths. A selection algorithm is executed on the returned matching paths to choose three paths. The selecting algorithm takes the paths’ weight into consideration to select the chosen paths. The chosen paths return the predicted NAR’s IP so MN can start registering.
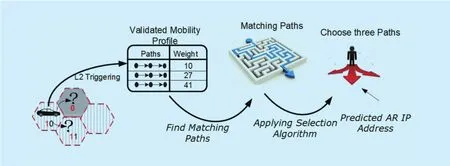
Fig. 7. Predicting mobility path procedures.
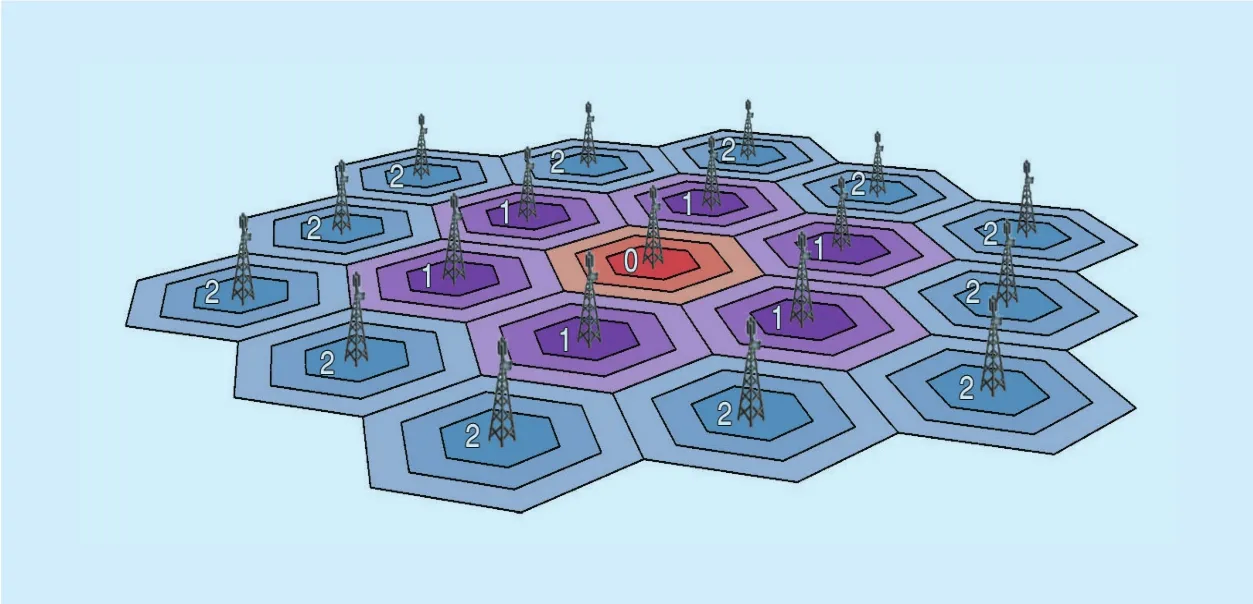
Fig. 8. Hexagonal cellular con figurations in F-HMIPv6 architecture.

Fig. 9. State diagram of MN’s movement.
The handoff prediction system includes three processes: the querying process which is presented in “Find Path” function, the selection process which is presented in “Applying Selection Algoritm” function, and registration process which uses the returned predicted NAR’s IP to register MN with the NAR.
IV. ANALYTIC MODELS
The mobility management procedure is used to implement the cost functions. These cost functions are used to analyze the performance of F-HMIPv6 and the proposed LBS_ F-HMIPv6 scheme. The notation used is given in Table 1.
A cellular network decomposed into hexagonal cells is considered where each cell contains a base station. Each cell is surrounded by rings of cells, except for cells in the outermost ring. Each domain is composed of k rings of the same size. The inmost cell labeled “0”, the central cell. Cells labeled “1” constitute the fi rst ring around cell “0”, and so on. Each ring is labeled in accordance with the distance to the cell “0”. Figure 8 shows an example of a MAP domain with two rings [24].
The Baumann mobility model is considered since that it is proved in [12] that it is appropriate for any type of MN movement. It finds the border crossing rate for which the MN out of an AR and the border crossing rate out of MAP. Furthermore, it finds the border crossing rate for which the MN out of an AR and still stays in the same MAP. When the MN crosses a MAP border, it also crosses an AR border.According to the state transition diagram in Figure 9, the state i (i ≥ 0) is defined as the number of AR that the MN passes within a single access network. The state transition μAR(i,i+1)(0 ≤ i < k) represents the rate of MN’s movement from one AR to another. The transitions μMAP(i,0) (1 ≤ i ≤ k) represent the movement to an AR out of the MAP [8].
If there are k sufficiently large ARs within a MAP, then the border crossing rate of MN may be defined as [8]. The movement rate out of an AR:
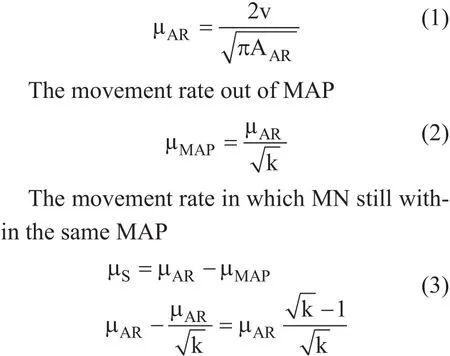
The implementation of cost function consists of implementing location update cost,and packet delivery cost.
4.1 Location update signaling cost
Location update cost is represented by the number of control messages transferred during location update time. This cost can either appear in wireless network or in a wired network. The transmission cost of a control packet between two nodes X and Y belonging to the wired part of a network can be expressedwhile the cost between two nodes in a wireless network can be represent-where dX,Yis the hop distance between the two network elements X and Y,τis the unit transmission cost over a wired link, and z is the weighting factor of the wireless link. Thus, the transmission cost in a wireless link is generally larger than the transmission cost in a wired link [25].
Depending on the type of movement and the mobility management protocol, two kinds of binding updates can be performed: micro handoff (local) and macro handoff (global).The former are movements within a MAP administrative domain, while the latter implies movements between domains. The location update procedures are carried out for micromanagement and macro management. The following assumptions are used; the distance between the PAR and MAP is equal to the distance between the NAR and MAP, and the link layer information (L2 trigger) is used either to predict or rapidly respond to handoff events.
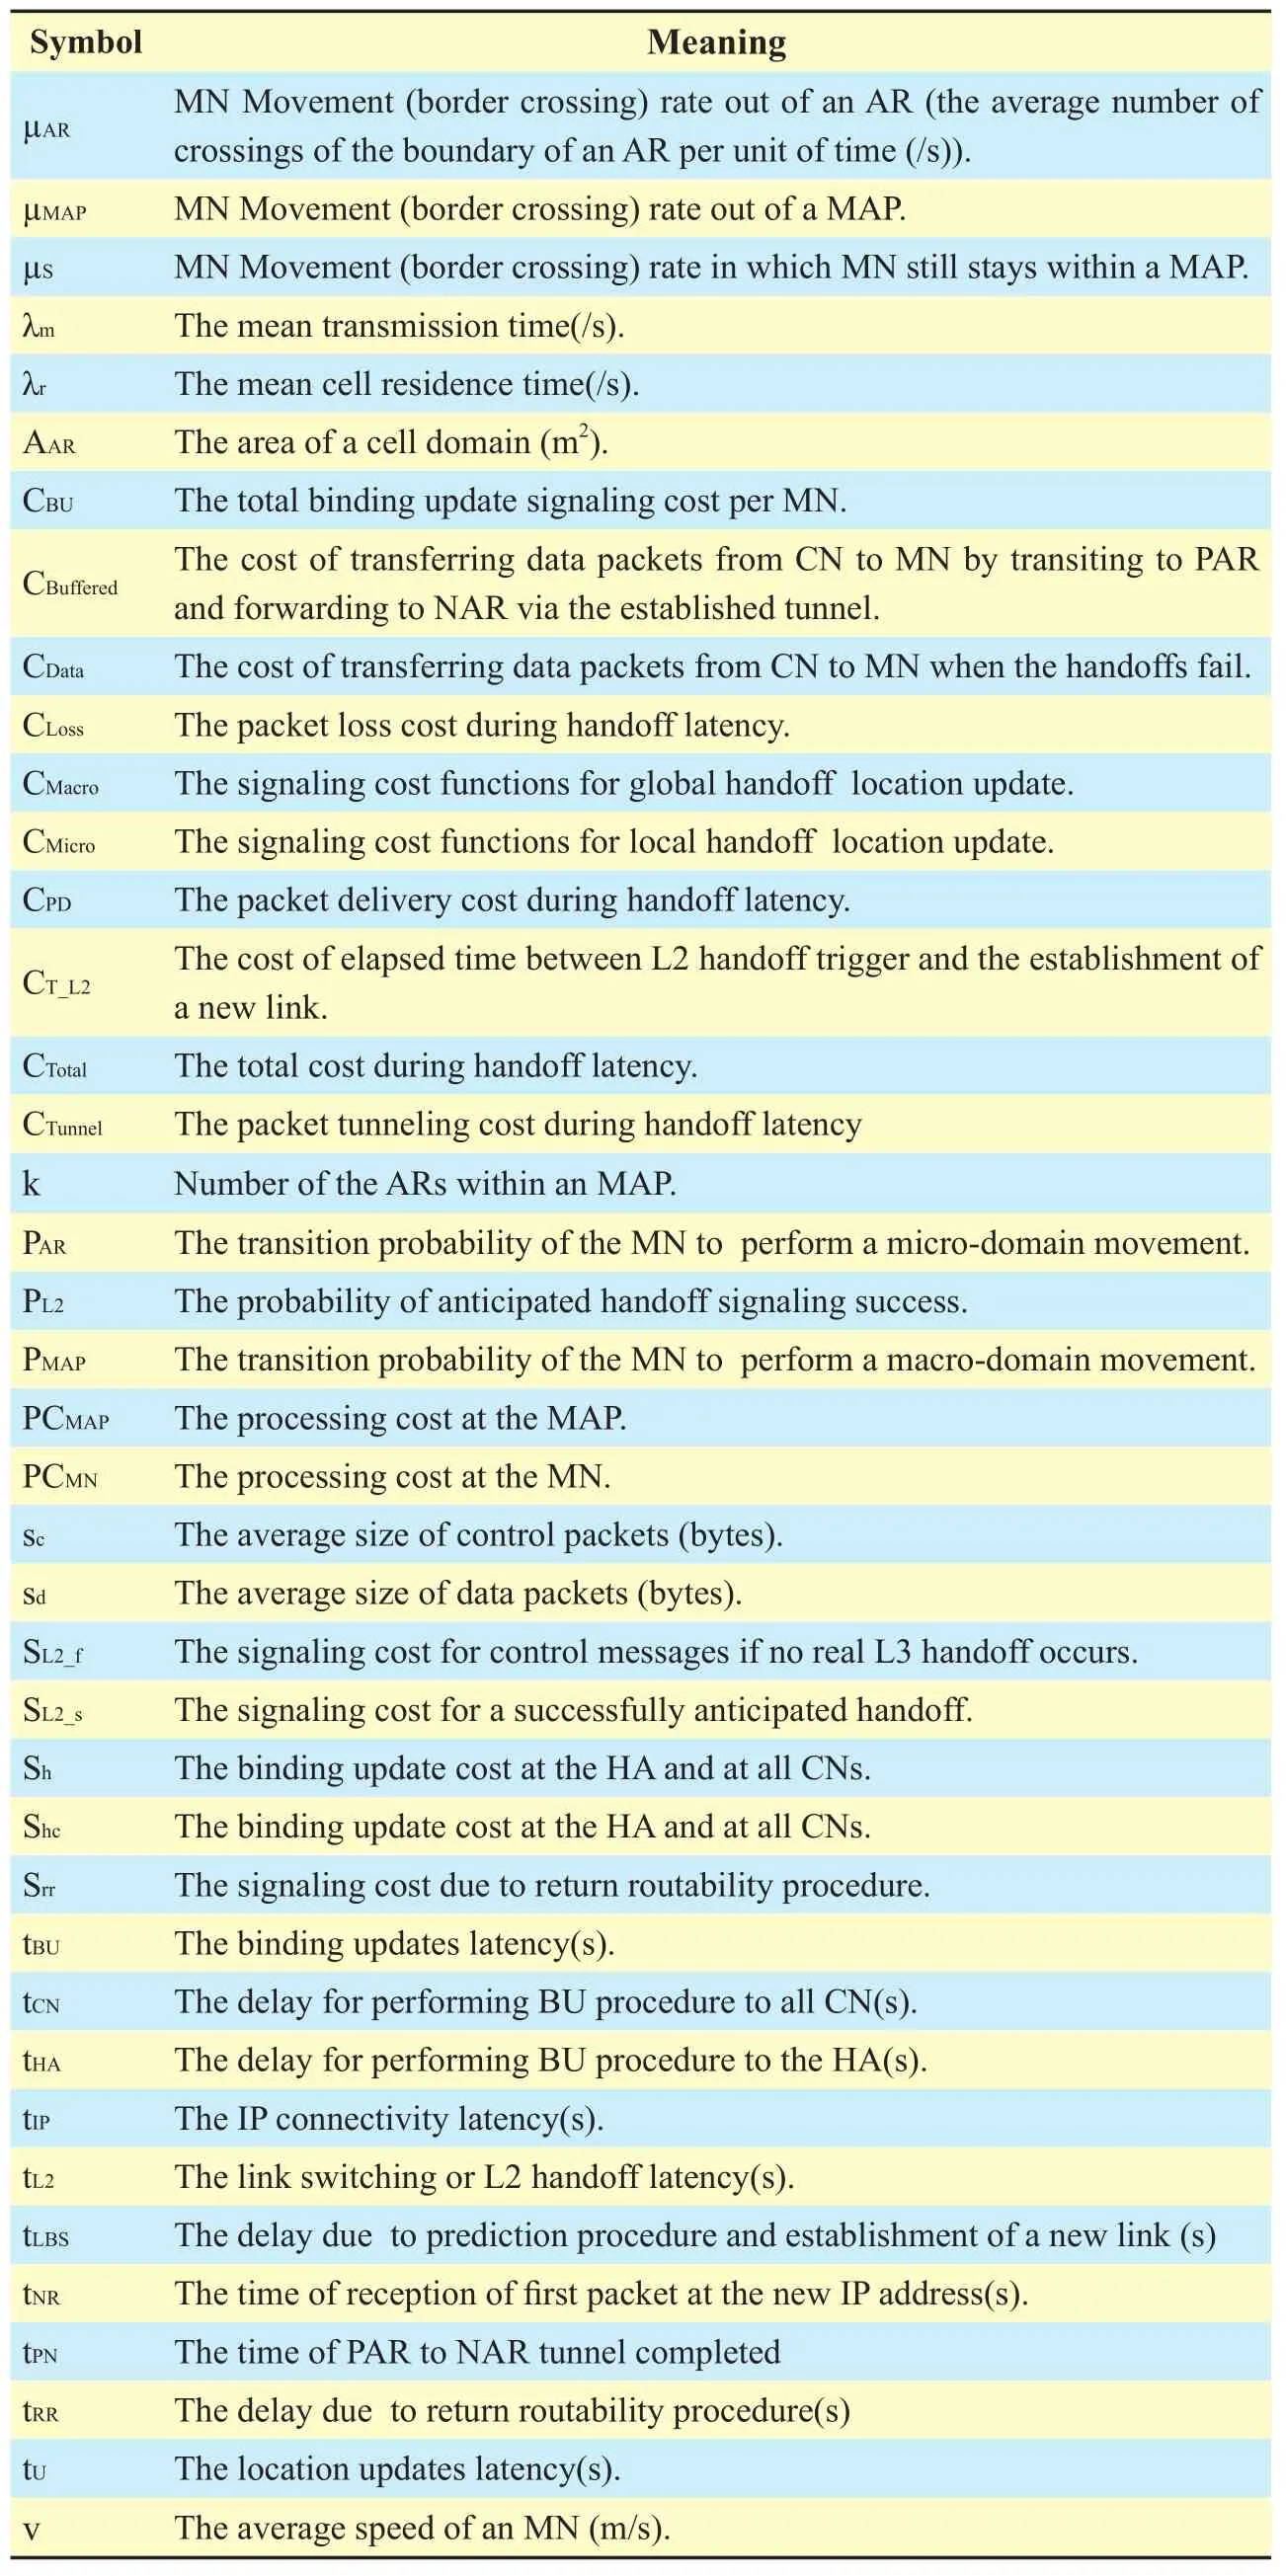
Table I. List of notations.
Based on the signaling load functions for location update; the total binding update signaling cost per MN in terms of session-to-mobility ratio (SMR) with Baumann mobility model is expressed as follows:

4.1.1 Local location update signaling cost for F-HMIPv6
Figure 10 illustrates a sequence of message used in F-HMIPv6 when an MN moves from PAR to NAR within MAP’s domain and the MAP already knows the adequate information on the link-layer address and network prefix of each AR. This illustration is based on the assumption that an MN has entered into a new MAP domain and that MIPv6/HMIPv6 registration procedures were already completed[14].
The F-HMIPv6 signaling cost function for micro handoff CMicrois expressed as follows[12]:

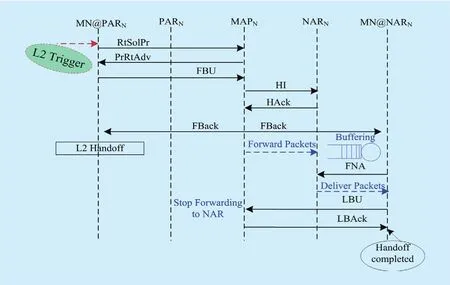
Fig. 10. Signaling messages sequence for Micro handoff in F-HMIPv6 [12].
The expression of SL2_spresents the cost for a successfully anticipated handoff and can be computed as:
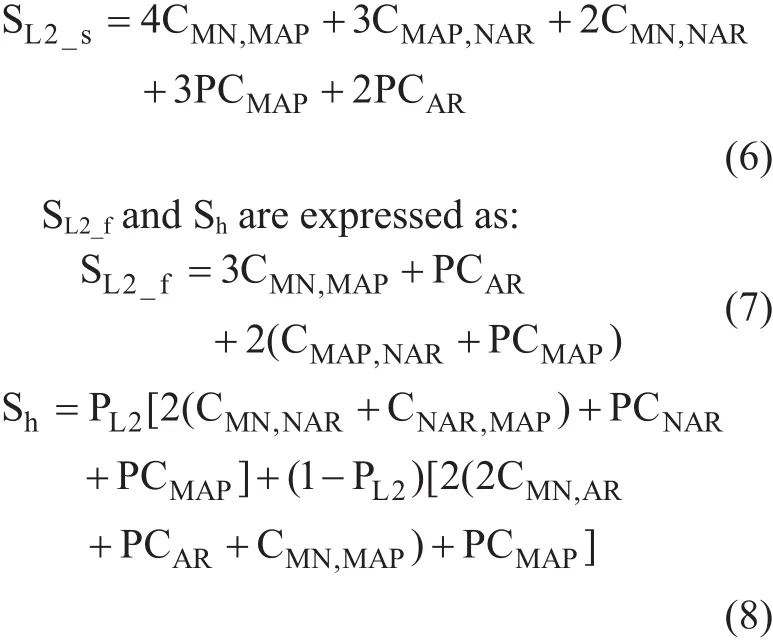
4.1.2 Global location update signaling cost for F-HMIPv6
The signaling cost function for macro handoff CMacrocan be expressed as the total of the signaling cost of the MN at MAPNand Shcwhich is the binding update cost at the HA at all active CNs.

4.1.3 Local location update signaling cost for LBS_ F-HMIPv6
To drive the micro mobility location update cost, the probability PL2of a successful handoff signaling anticipation is assumed to be as large as possible. It reaches 1 when L2 successfully generates handoff trigger. In case of successful handoff signaling anticipation (i.e.PL2=1), the proposed scheme starts invoking the prediction system which either returns a known mobility pattern or unknown mobility pattern.
When the prediction system manages to successfully return a known mobility pattern and predict NAR’s IP and its MAP, the location update cost starts as soon as L2 generates handoff trigger. So, the location update cost is considered to be the maximum cost between the registration cost and the cost of reestablishing new link. Then, the location update cost for predicted mobility pattern CMicro_LBScan be represented as follows:


An additional processing time in the MN is added for storing or retrieving mobility pro file PCMN, which is necessary for the prediction system to predict NAR’s IP. PCMNis measured as a small value comparable with the location update cost. On the other hand, it helps to reduce the packet loss during L3 handoff. In practical experiments, PCMNranges between 30 to 50 milliseconds, as it considers as a simple process to retrieve stored data [26].
The total cost of micro handoff mobility in both cases of known and unknown mobility patterns can be expressed as (14) shown in the bottom at this page, where Pr (NAR successfully predicted) depends on how well the prediction system can predict NAR’s IP and its MAP. It’s mainly depends on user’s behavior.For most mobility users with a fixed daily routine, the probability of successful prediction is as large as possible.
4.1.4 Global location update signaling cost for LBS_ F-HMIPv6
Global location update cost is considered to be the maximum cost between the registration cost and the cost of reestablishing new link.


The total cost of micro handoff mobility in both cases of known and unknown mobility pattern can be expressed as (16) shown in the bottom at this page.
4.2 Packet delivery cost in handoffperiod
The packet delivery cost is defined as the linear combination of packet tunneling cost (CTun-nel) and packet loss cost (CLoss) during handoff latency. Let α and β be weighting factors(where α + β = 1), which emphasize tunneling effect and dropping effect. Then, the packet delivery cost is computed as follows:

It is necessary to compute handoff latency to evaluate packet delivery cost. The handoff latency is divided into three components:link switching or L2 handoff latency (tL2), IP connectivity latency (tIP) and location update latency (tU). tIPreflects how quickly an MN can send IP packets after L2 handoff, while tUis the latency time from the starting point of L2 handoff until an MN receives IP packets for the fi rst time after link switching [8]. It is expected that the handoff latency would vary from micro mobility and macro mobility.
4.2.1 Local packet delivery cost for F-HMIPv6
Figure 11 illustrates the timing diagram associated to micro mobility of F-HMIPv6 and shows that there is a delay before an MN begins to receive packets directly through the NAR. It can be computed through (9), where F-HMIPv6 enables PAR to forward packets to NAR by using a bi-directional tunnel established between them and by buffering all forwarded packets.
So the packet loss cost CLossdue to the time required to establish a tunnel between PAR and NAR is very small value. It can be expressed as:

CDatais the cost of transferring data packets from CN to MN via PA

where η is the transferring cost of data packet.It is greater than the cost of transferring control:

and the packet tunneling cost is given by:

where the location update latency for micro handoff

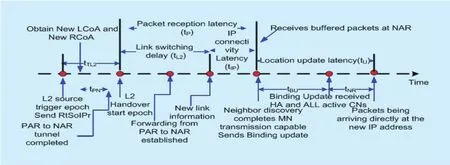
Fig. 11. Handoff latency timeline of local handoff for F-HMIPv6 [10].
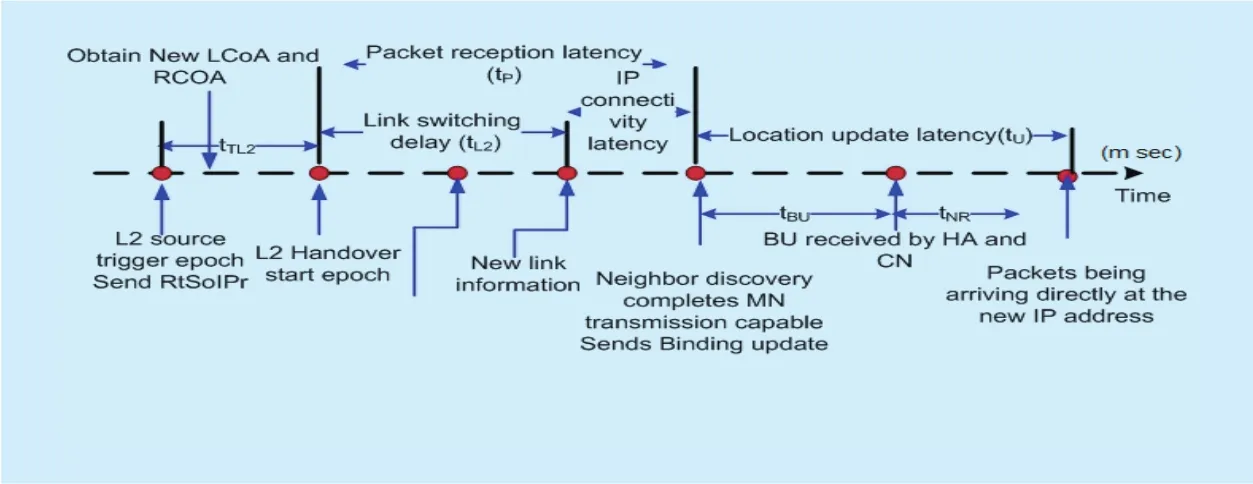
Fig. 12. Handoff latency timeline of global handoff for F-HMIPv6 [10].
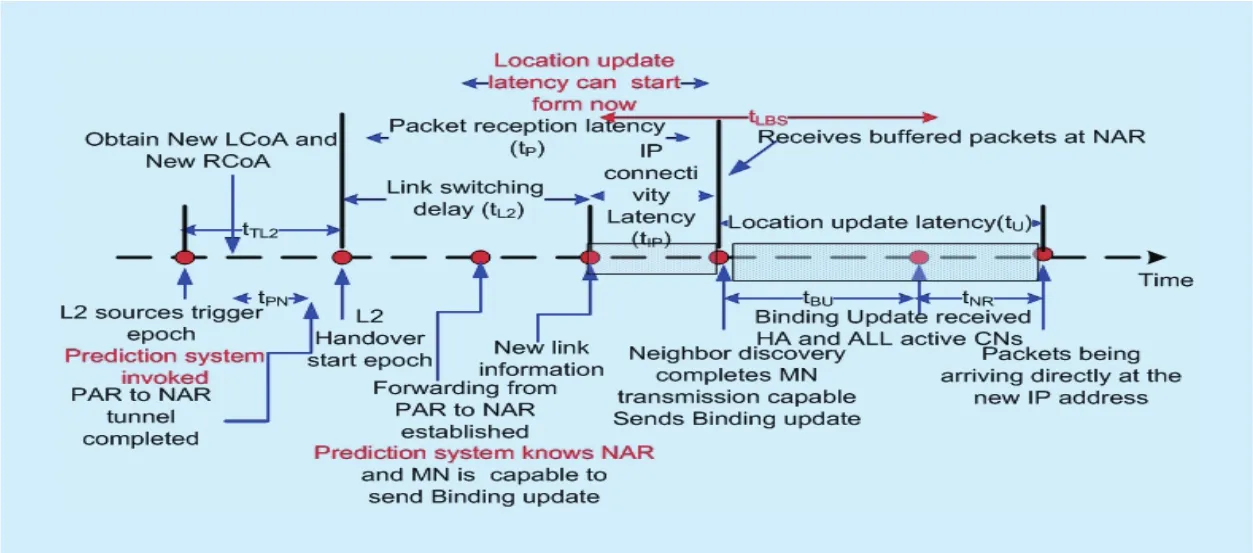
Fig. 13. Handoff latency timeline of local handoff for proposed scheme.
4.2.2 Global packet delivery cost for F-HMIPv6
The timing diagram for macro handoff is presented in Figure 12. There is no forwarding during macro handoff (CTunnel= 0); then, only packet loss cost occurs and it can be evaluated as follows:

where the updating cost contains tHAwhich is the delay for performing BU procedure to the HA, tRRwhich is the delay for return routability procedure, and tCNwhich is the delay for performing BU process to all active CNs.

4.2.3 Local packet delivery cost for LBS_F-HMIPv6
Figure 13 illustrates the timing diagram associated to micro mobility for proposed and shows that there is a delay before an MN begins to receive packets directly through the NAR. As in F-HMIPv6, the scheme enables PAR to forward packets to NAR by using a bi-directional tunnel established between them and by buffering all forwarded packets. The packet loss cost due to the time required to establish a tunnel between PAR and NAR can be expressed as in Equation (18). The packet tunneling cost is given by:

4.2.4 Global packet delivery cost for LBS_F-HMIPv6
Figure 14 presents the timing diagram associated to macro mobility of proposed scheme for known mobility pattern. The elapsed time between L2 handoff trigger and the establishment of a new link is used to make a connection to the NAR and its MAP. So packet loss cost can be expressed as:

where the location update latency as in global location update for FHMIPv6
For known mobility pattern, there would be no buffering, so CTunnelwill be equal to zero.

V. SIMULATION RESULTS FOR PREDICTION SYSTEM
In this section the simulation results for prediction system are introduced. We examined the typical behavior of a mobile user by supposing several scenarios for a certain user.Software program is built to capture MN behavior. Then, the program was tested to ensure the capability of the learning process by testing it with new scenarios that either different or similar to known mobility patterns of the learned scenarios.
To better understand how a MN’s mobility pattern is created, suppose the scenario shown in Figure 15. The mobile user’s residence is located in cell ‘0’, while its place of work is located in cell (2, c). It is considered that, the user leaves home at 08:00 am each morning.During its trip from home to work, the user crosses cells labeled (1, c), (2, e), (2, d) and fi nally arrives another cell labeled (2, c). The user has a break every day at 12:00 pm at the cafe located in cell (2, b). At about 06:00 pm,the user leaves work in the direction of its residence passing through the same cells as in the morning but in the opposite order.
It is assumed that each day is divided into periods that represent the capture times. Capture time is assumed to be 30 min. To decrease the overhead resulting from saving the different paths during the day, 8 hours are ignored that represent the sleeping hours. Then, the remaining 16 hours are divided into 32 capture points. The analysis time is assumed one week to con figure mobility patterns from the capture points. Table 2 shows the points of success or fails of the stored paths during the fi rst week.Only 16 points out of the 32 points are tabulated in order to compress the results. Predicting the correct path is represented by (√), whereas the faults are represented by (x). The faults are distributed according to the random positions that the MN moves during each day. The result of each row represents the average faults per point and the result of each column represents the average faults per day. Then, the average faults during the first week are calculated.The last column represents the average faults during the second week.
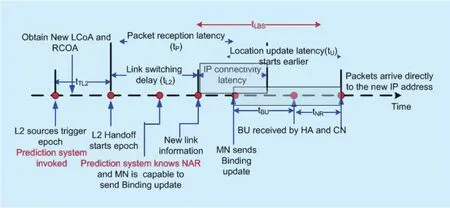
Fig. 14. Handoff latency timeline of global handoff for proposed scheme.
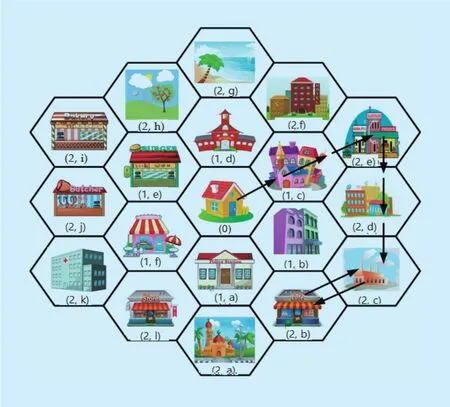
Fig. 15. MN’s movement scenario.
It is shown that the total average faults in the first week is 17.86%, whereas this value is decreased to 16.75% in the second week since the program is acquired more learning and then it updated the stored paths according to the movement of the MN during the first week. The value of average faults during the second week is changed by ±1% during the consequence weeks. Then, 16.96% is considered in our analysis as the value of the percentage of faults during the prediction system.So this value can be used in (14) and (16) as the value for probability of unknown pattern that is required in order to evaluate total macro cost.
Table 3 presents total average handoff faults of LBS_F-HMIPv6 compared with the prediction schemes in [20]. In this table, the average number of failed handoffs in the proposed scheme is compared with the existing prediction schemes AHP, APCV, and D-Scan [20].As shown in the table that, the total average number of failed handoffs in these schemes are 22%, 21%, and 37.2%; respectively. These percentages are considered high with respect to the percentage of failed handoffs in the proposed prediction scheme. The results from[20] are based on five mobility patterns only.However, the average number of faults in the proposed scheme is based on real mobility patterns for two weeks that incorporate 64 capture points. Thus, the obtained results in the proposed LBS_F-HMIPv6 simulate real environment.
VI. NUMERICAL RESULTS
This section presents various analyses results based on the proposed scheme analytical model. It presents a comparison between the proposed scheme and F-HMIPv6 protocol.The results for location update cost, packet delivery cost, total cost, and handoff latency are investigated. There are various parameters that should be considered when studying the performance of the proposed scheme. Parameters such as user’s velocity, packet arrival rate, user density and session-to-mobility ratio have a considerable impact on different types of cost.For example, location update cost depends on the user velocity; the user density influences packet delivery cost, while total cost is affected by SMR. Table 4 presents the values of the system’s parameters. The parameter values for the analysis were referenced from [6]. The experiments performed to evaluate the value of PCMNand the estimated value of processing time in MN was in range 30-50 milliseconds[27].
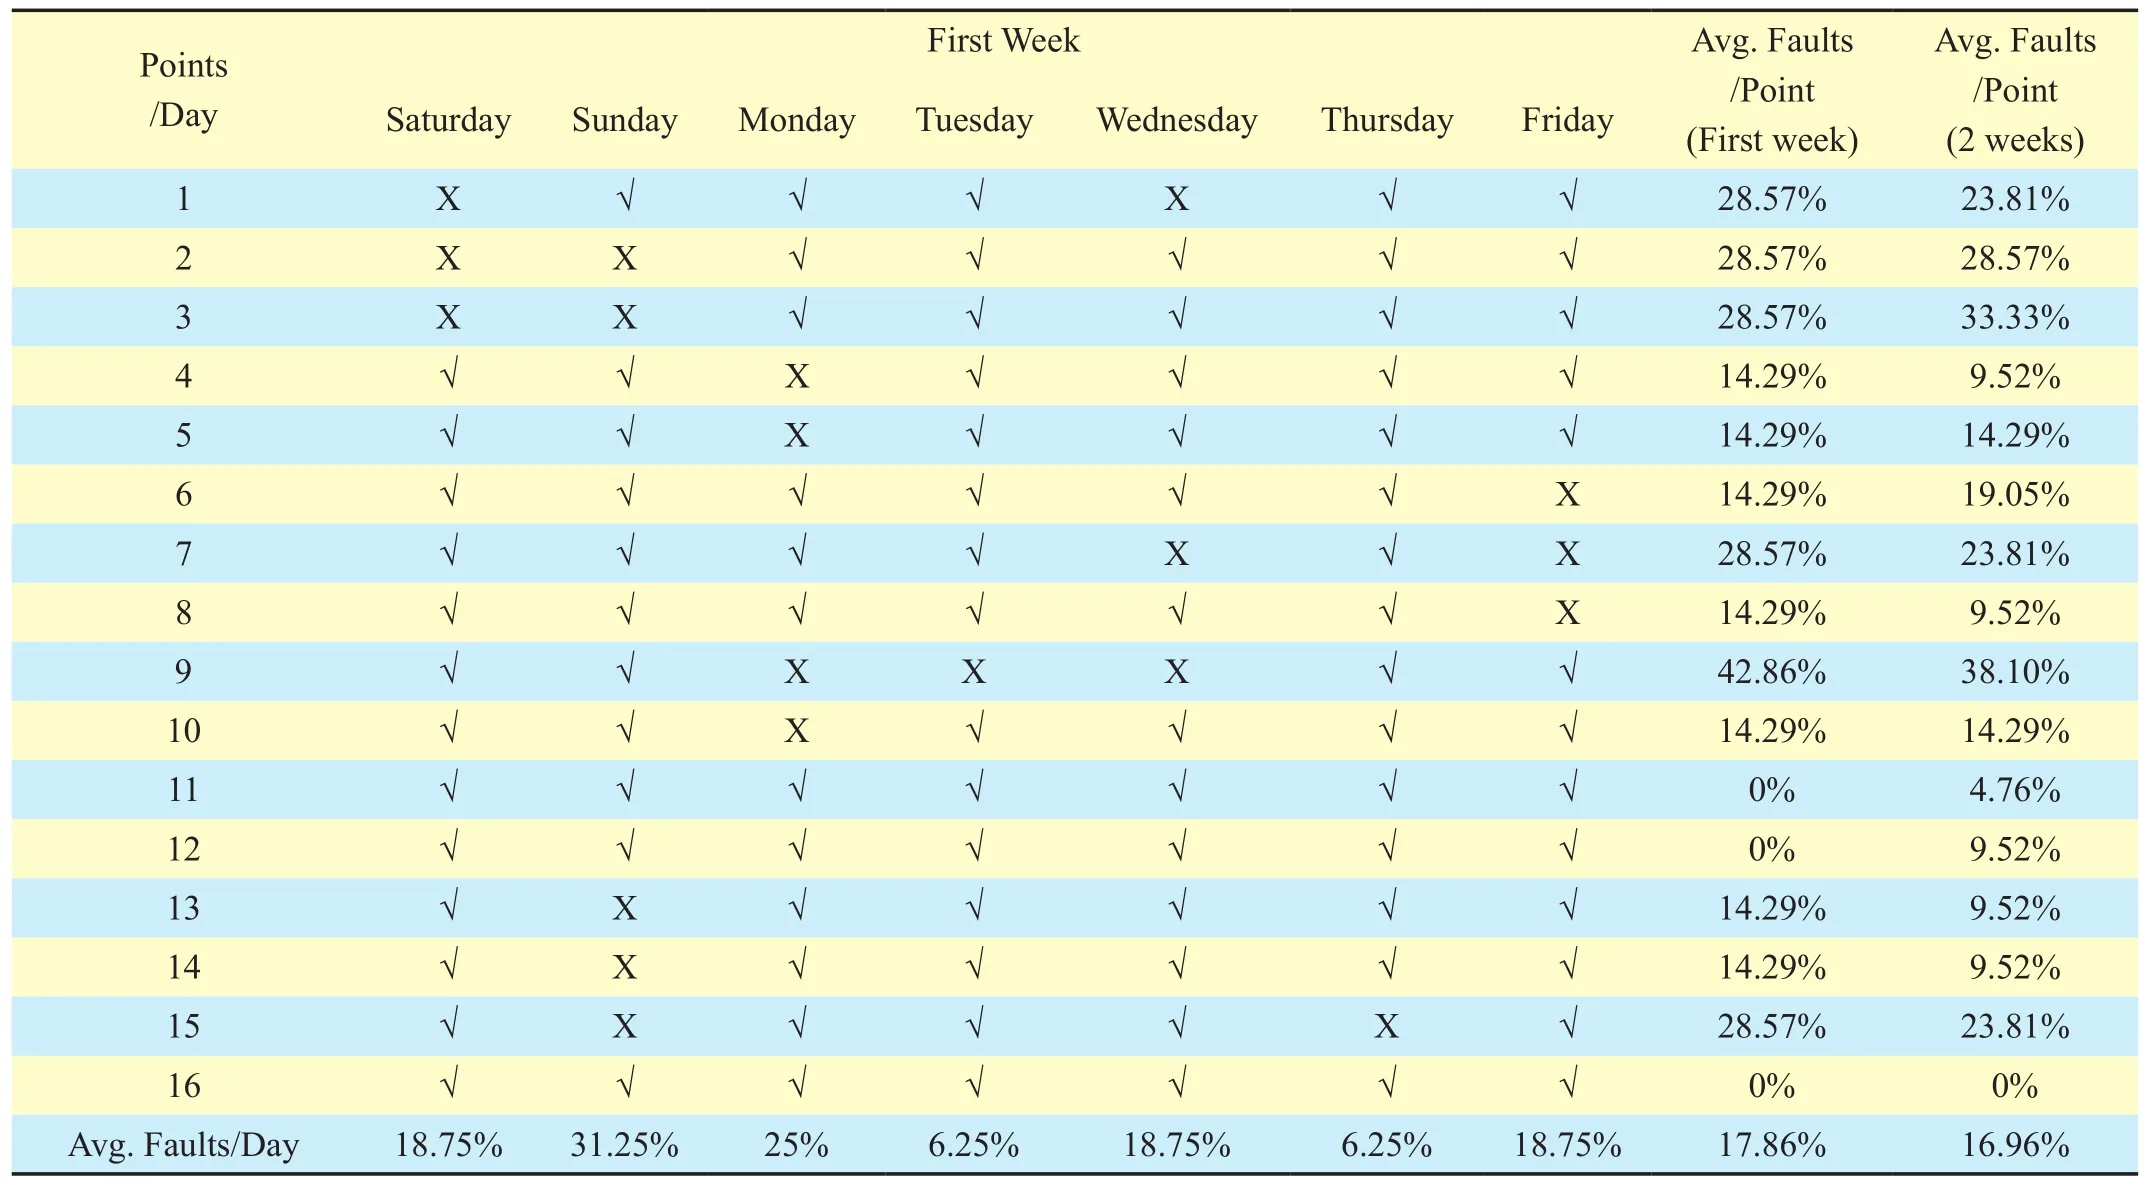
Table II. Points of success and fails.
6.1 Location update cost
Figure 16(a and b) depicts location update cost variation when the MN’s mean velocity is changed with different number of the ARs within an MAP. As expected, the MN performs fewer movements as the average residence time of the MN increases. Therefore, the location update cost is inversely proportional to the average residence time. In the proposed case study, the user density is set as 0.002. Since the MN with a higher average velocity has a higher domain crossing rate, a higher location update cost is required. Therefore, the location update cost increases as the average velocity increases. It is clear that, the location update cost in the proposed LBS_F-HMIPv6 is lower than that of FHMIPv6 for various velocity values. This reduction is due the reduced location update cost for predicted mobility pattern. It is also shown that, the location update cost of a ring with size 1 is larger than that of a ring with the size 3. This is because the MN located in the MAP domain with a small ring size is more likely to perform global binding update procedures.
6.2 Packet delivery cost
In general, the location update cost is affected by the user mobility and not by the user population. On the other hand, the packet delivery cost depends on user density as the MAP needs to determine whether the destination MN belongs to the mapping table or not.The cost of this lookup procedure is generally proportional to the number of MNs in a MAP domain. Therefore, the packet delivery cost increases as the number of MNs in the MAP domain increases. Figure 17 (a and b) shows the packet delivery cost as the MN density(ρ) changes for local and global mobility; respectively. The results show that, the packet delivery cost increases linearly as the number of MNs increases. As expected, the proposed LBS_F-HMIPv6 achieves a lower packet delivery cost than FHMIPv6 for local and global mobility since that the handoff latency is reduced in the proposed scheme.

Table III. Comparison of total average handoff faults percentages between LBS_FHMIPv6, AHP, APCV, and D-Scan schemes.
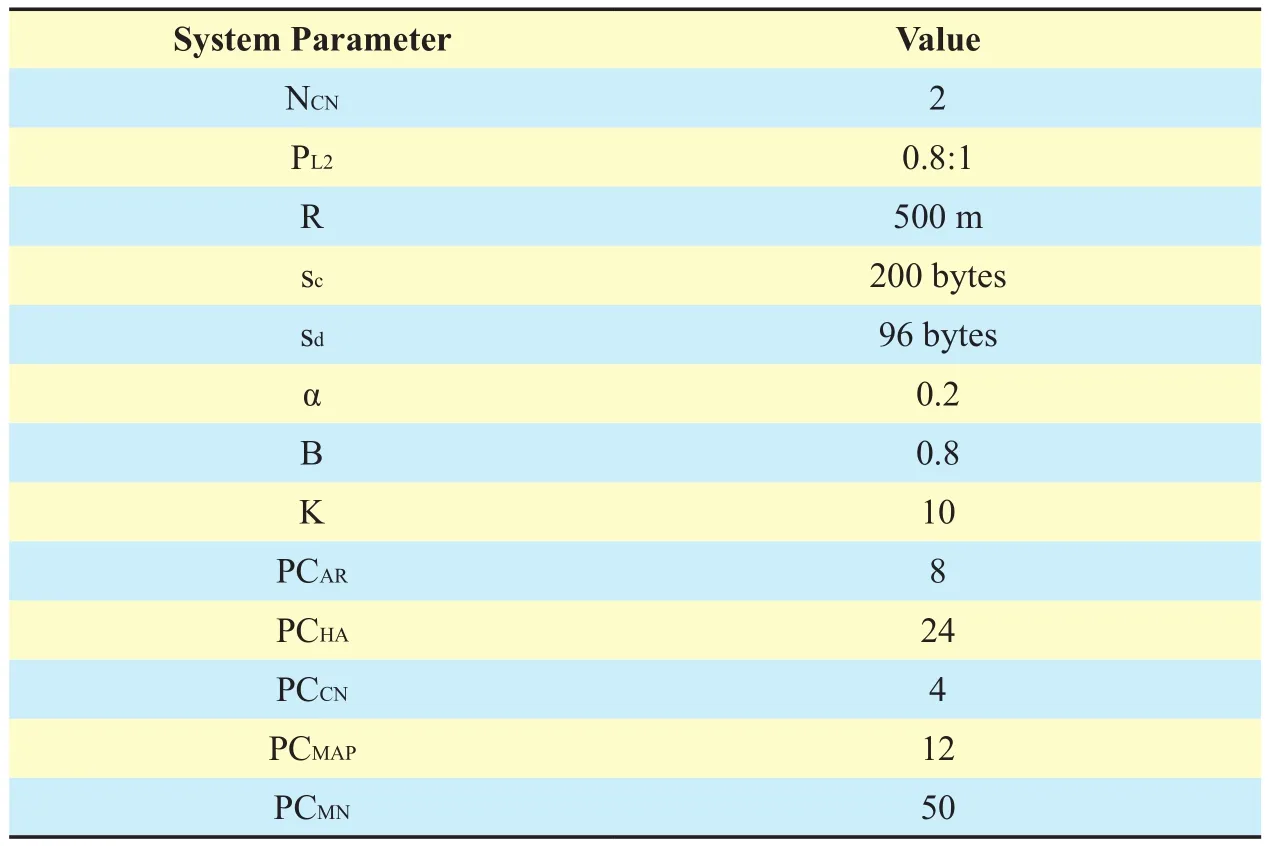
Table IV. The values of system parameters.
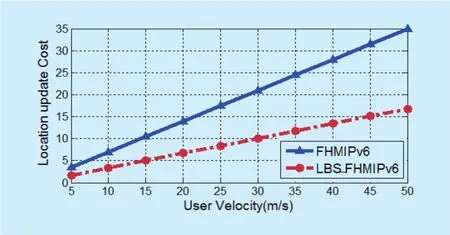
Fig. 16 (a). Location update cost as a function of user velocity at k=1.

Fig. 16 (b). Location update cost as a function of user velocity at k=3.
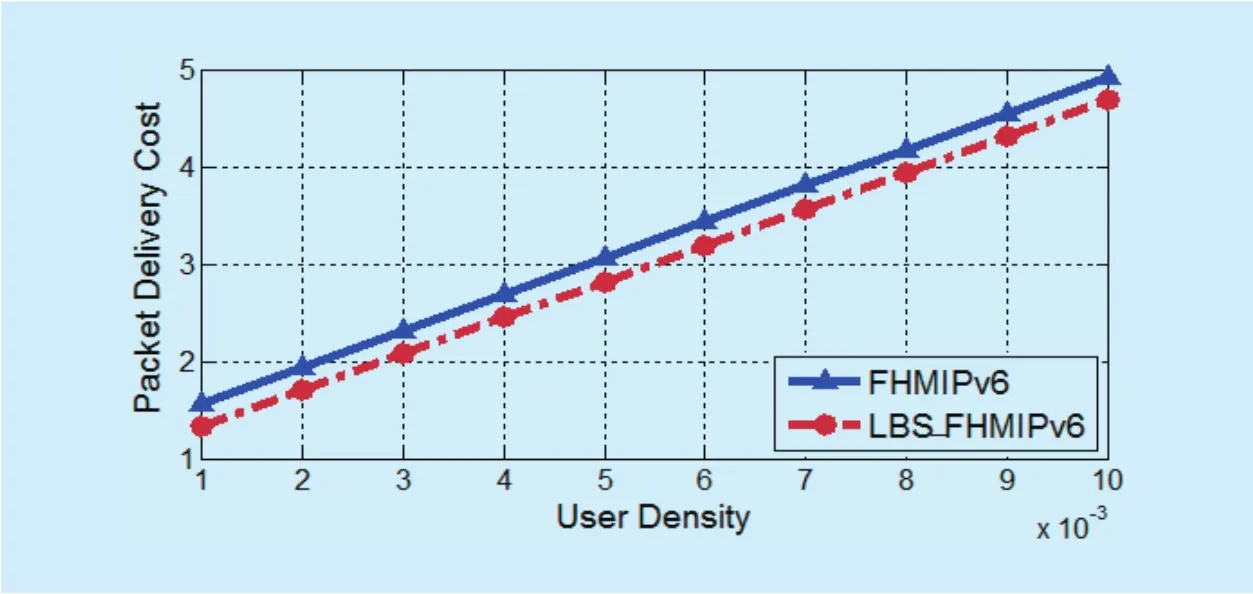
Fig. 17 (a). Packet delivery cost as a function of user density for local mobility.

Fig. 17 (b). Packet delivery cost as a function of user density for global mobility.
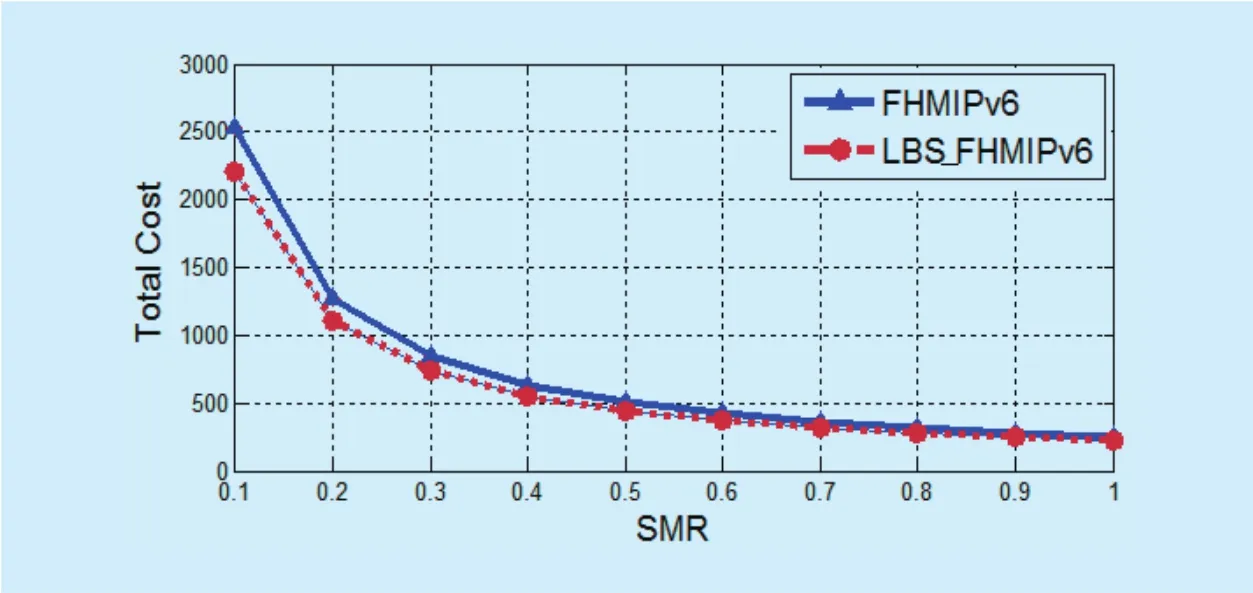
Fig. 18 (a). Total cost as a function of SMR (SMR<1).
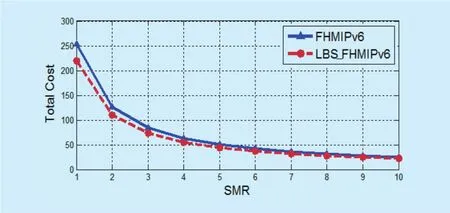
Fig. 18 (b). Total cost as a function of SMR (1< SMR < 10).
6.3 Total cost
Total cost combines the location update cost and the packet delivery cost. Figure 18 (a and b) shows the total cost as a function of SMR in the Baumann model in the case of SMR ≤ 1 and SMR > 1; respectively. The SMR is equal to λm/μAR, which is the session arrival rate divided by the cell crossing rate. As a result, the growing of the SMR implies an increase of the session arrival rate and the total cost increases.In the case of SMR ≤ 1, i.e. λm≤ μAR, the location update cost is more dominant than packet delivery cost in the total cost. When the SMR is larger than 1, the impact of the location update cost on the total cost is reduced, while the packet delivery becomes more effective in the total cost. In both cases, the proposed LBS_F-HMIPv6 achieves a lower total cost than F-HMIPv6.
6.4 Handoff latency
In this section, the handoff latency of the proposed scheme is presented. Since that the handoff latency mainly affects the cost functions, it can be computed through Equations(from 18 to 26). It is compared to F-HMIPv6 and another motion detection scheme in [23]in the case when upper limit of the MN velocity is 50 m/s since it is the considered value in this scheme.
The impact of cell radius is investigated in Figure 19. As shown, the handoff latency is decreased when cell radius is increased.Following this result, the handoff is occurred more frequently when the cell radius goes to smaller. In the LBS_F-HMIPv6, the handoff latency is 270 msec when the cell radius is 50 m and it goes to 110 msec when cell radius goes to 150 m.
User velocity is examined which is used further to determine an appropriate model to represent the changing range of user velocity. Figure 20 (a and b) show the increase in the handoff latency due to an increase in moving speed of MNs. As can be seen, LBS_F-HMIPv6 scheme performs better than F-HMIPV6 even with high MN speed.
The proposed LBS_F-HMIPv6 is compared with another motion detection, that is called MAHO_F-HMIPv6 in [23]. Since MAHO_F-HMIPv6 considers the upper limit of the MN velocity is 50 m/s, this value is considered in the comparison. Figure 21 shows the impact of MN average moving speed on handoff latency for F-HMIPv6, LBS_F-HMIPv6,and MAHO_F-HMIPv6. As shown in Figure 21, the handoff latency for F-HMIPv6 and MAHO_F-HMIPv6 exceeds that of LBS_F-HMIPv6.
VII. CONCLUSIONS
In this paper, a proposed scheme for smooth handoff over F-HMIPv6 networks is introduced. The goal of the proposed scheme is to minimize handoff latency, location update cost, and packet delivery cost. The architecture of the proposed scheme is based on LBS package in each MN and a prediction system.This package is responsible for capturing information about user behavior and using this information to create user mobility profiles.The proposed LBS_F-HMIPv6 scheme is analyzed using cost functions and compared with F-HMIPv6. The probability of the successful prediction system of the proposed scheme is tested via simulation in different scenarios.The obtained prediction value from simulation is used in evaluating the cost functions numerically. The numerical results show that the proposed scheme achieves the smallest cost as it starts the registration process as earlier as possible due to the known mobility patterns that is in turn reduces the handoff latency.LBS_F-HMIPv6 scheme reflects an optimized smooth handoff better than F-HMIPv6 and MAHO_FHMIPv6 motion detection scheme.In addition, it reduces both the location update cost and the packet delivery cost.
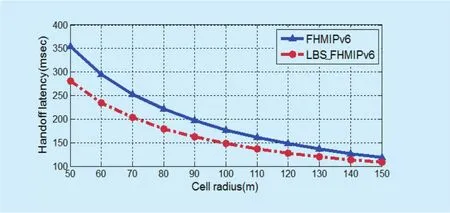
Fig. 19. Handoff latency as a function of cell radius.
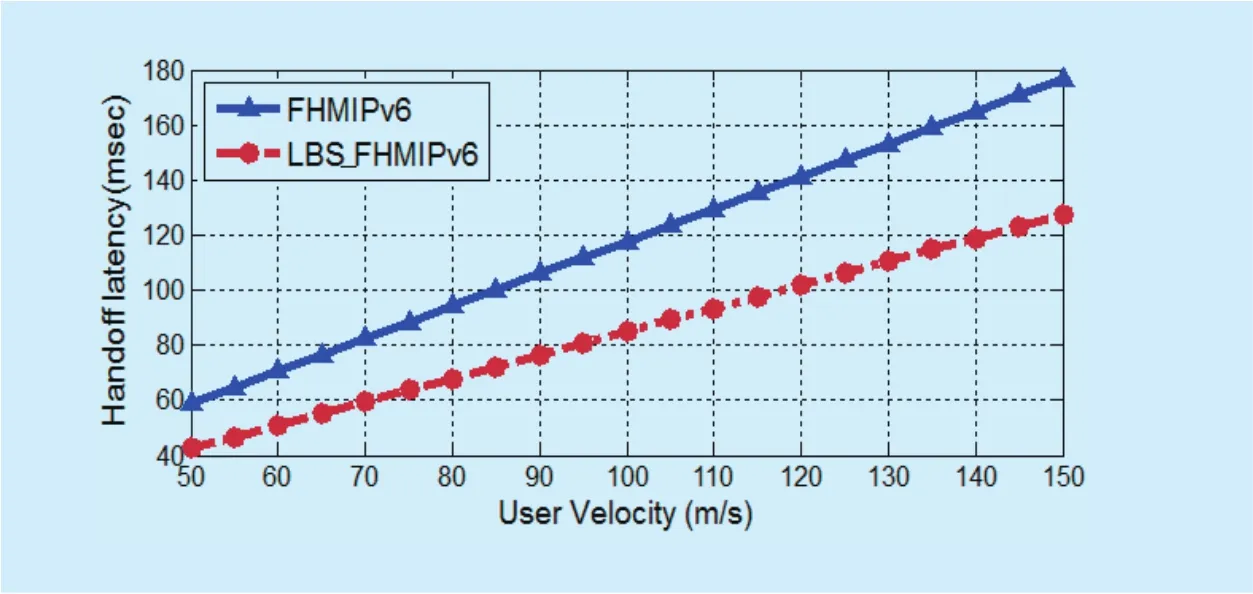
Fig. 20 (a). Handoff latency as a function of user velocity at k=3.

Fig. 20 (b). Handoff latency as a function of user velocity at k=6.

Fig. 21. Handoff latency as a function of user velocity for different motion detection schemes.
References
[1] N. Fei, Y. Zhuang, J. Gu, J. Cao, and L. Yang, “Privacy-preserving relative location based services for mobile users,”China Communications,vol.12, no. 5, 2015, pp.152-161.
[2] M. Yassin, and E. Rachid, “A survey of position-ing techniques and location based services in wireless networks,” Proc. IEEE International Conference on Signal Processing, Informatics,Communication and Energy Systems (SPICES),India, 2015, pp. 1-5.
[3] C. Anagnostopoulos, K. Kolomvatsos, and S.Hadjiefthymiade, “Efficient location based services for groups of mobile users,”Proc.IEEE 14th International Conference on Mobile Data Management (MDM),Italy, 2013, pp. 6-15.
[4] M. Aal-Nouman, O. H. Salman, and H. T.-Rizk,“A new architecture for location-based services core network to preserve user privacy,”Proc.Annual Conference on New Trends in Information & Communications Technology Applications(NTICT),2017.
[5] D. Johnson, C. Perkins, and J. Arkko, “Mobility Support in IPv6,”Internet Soc., Reston, VA, IETF RFC 3775, January 2004.
[6] D. K. Panwar, D. K. Lal, and I. Chaudhary, “Handover latency analysis of mobility management protocols in all-IP networks,”Proc. Advances in Computing, Control, & Telecommunication Technologies (ACT ‘09), 2009, pp. 390-394.
[7] H. Nashaat, R. Rizk, and H. Mahdi, “A robust analytical model of mobile IP handoff with multiple traffic pro file,”International Journal of Wireless Information Network, Springer, vol. 18,no. 4, 2011, pp. 210-223.
[8] H. Nashaat, R. Rizk, and H. Mahdi “Performance analysis of streamed video over mobile IP based networks,”Proc. 9th IEEE/ACS International Conference on Computer Systems and Applications(AICCSA), Egypt, 2011.
[9] N. Kara, “Mobility management approaches for mobile IP networks: performance comparison and use recommendations,”IEEE Transactions on Mobile Computing,vol. 8, no. 10, 2009, pp.1312-1325.
[10] J.-H. Lee, T. Ernst, and T.-M. Chung, “Cost analysis of IP mobility management protocols for consumer mobile devices,”IEEE Transactions on Consumer Electronics, vol. 56, no. 2, 2010, pp.1010-1017.
[11] O. Lee, J. Bonnin, I. You, and T. Chung. “Comparative handover performance analysis of IPv6 mobility management protocols,”IEEE Transactions on Industrial Electronics, vol. 60, no. 3,2013, pp. 1077-1088.
[12] H. Nashaat, R. Rizk and H. Mahdi, “An analytical framework of fast handover for hierarchical MIPv6,”Proc. The World Congress on Computer Science and Information Technology (WCSIT’11),Egypt, vol. 1, no. 2, 2011, pp. 38-44.
[13] C. Makaya and S. Pierre, “An analytical framework for performance evaluation of IPv6-based mobility management protocols,”IEEE Transactions on Wireless Communication,vol. 7, no. 3,2008, pp. 972-983.
[14] M. Skorepa, and R. Klug, “Enhanced analytical method for IP mobility handover schemes cost evaluation,” Telecommunication Systems, vol.52, no. 3, 2013, pp. 1573-1582.
[15] H. S. Yoo, R. Tolentino, B. Park, B. Y. Chang, and S. H. Kim, “ES-FHMIPv6: An efficient scheme for fast handover over HMIPv6 networks,”International Journal of Future Generation Communication and Networking, vol. 2, no. 2, 2009, pp. 38-48.
[16] A. S. Sadiq, K. Abu Bakar, K. Z. Ghafoor, J. Lloret,and S. Mirjalili, “A Smart handover prediction system based on curve fitting model for Fast Mobile IPv6 in wireless networks,”International Journal of Communication Systems, vol. 27, no.7, 2014, pp. 969-990.
[17] S. H. Wady, K. A. Bakar, and K. Z. Ghafoor, “A robust regression model for handover prediction in wireless networks,”Journal of Zankoy Sulaimani - Part A - For Pure and Applied Science, vol.17, no. 2, 2015.
[18] Y. Luo, P. N. Tran, D. Sahinel, A. Timm-Giel,“Handover prediction for wireless networks in office environments using hidden markov model,” Proc.IFIP Wireless Days (WD),Valencia,2013, pp. 1-7.
[19] A. M. Miyim, M. Ismail, R. Nordin, and M. T.Ismail, “Technique for cross-layer vertical handover prediction in 4G wireless networks,”Proc.The 4th International Conference on Electrical Engineering and Informatics (ICEEI),Malaysia,2013, pp. 114-121.
[20] A. S. Sadiq, N. B. Fisal, K. Z. Ghafoor, and J.Lloret, “An adaptive handover prediction scheme for seamless mobility based wireless networks,”The Scientific World Journal, Article ID 610652, 2014, 17 pages.
[21] A. Mohamed, O. Onireti, S. A. Hoseinitabatabaei, M. Imran, A. Imran, and R. Tafazolli, “Mobility prediction for handover management in cellular networks with control/data separation,”Proc. IEEE International Conference on Communications (ICC), London, 2015, pp. 3939-3944.
[22] Y. Chon, E. Talipov, H. Shin, and H. Cha, “Smart-DC: mobility prediction-based adaptive duty cycling for everyday location monitoring,”IEEE Transactions on Mobile Computing, vol. 13, no.3, 2014, pp. 512–525.
[23] H. Yu and M. Tao, “Fast handover in hierarchical mobile IPv6 based on motion pattern detection of mobile node,”Wireless Personal Communications, vol. 61, no. 2, 2011, pp. 303–321.
[24] H. Tuncer, S. Mishra, and N. Shenoy, “A survey of identity and handoff management approaches for the future Internet,”Sciencedirect in Computer Communications, vol. 36, 2012, pp. 63-79.
[25] V. Casares-Giner, V. Pla, and P. Escalle-Garcia,“Mobility models for mobility management,”Springer LNCS 5233, 2011, pp. 716–745.
[26] H. Su-Cheng, L. Chien-Sing, and N. Mustapha,“Bridging XML and relational databases: map-ping choices and performance evaluation,”IETE Technical review, vol. 27, no. 4, 2010, pp. 308-317.
[27] V. Gupta, and S. Dharmaraja, “Reliability and performance modeling of VoIP system with multiple component failure,”International Journal of Reliability and Safety, vol. 7, no. 1, 2011,pp. 79-95.
- China Communications的其它文章
- Uplink Grant-Free Pattern Division Multiple Access(GF-PDMA) for 5G Radio Access
- Cluster-Based Content Download and Forwarding Scheme for Highway VANETs
- Vortex Channel Modelling for the Radio Vortex System
- New Precoded Spatial-Multiplexing for an Erasure Event in Single Frequency Networks
- Microphone Array Speech Enhancement Based on Tensor Filtering Methods
- Multi-Bit Sliding Stack Decoding Algorithm for OVXDM

