Methods for determining unimpeded aircraft taxiing time and evaluating airport taxiing performance
Yu Zhng,Qing Wng
aCivil and Environmental Engineering,University of South Florida,Tampa,fl33620,USA
bCollege of Air Traffic Management,Civil Aviation University of China,Tianjin 300300,China
cCollege of Transportation Engineer,Tongji University,Shanghai 200092,China
Methods for determining unimpeded aircraft taxiing time and evaluating airport taxiing performance
Yu Zhanga,b,c,*,Qing Wanga
aCivil and Environmental Engineering,University of South Florida,Tampa,fl33620,USA
bCollege of Air Traffic Management,Civil Aviation University of China,Tianjin 300300,China
cCollege of Transportation Engineer,Tongji University,Shanghai 200092,China
Aircraft taxiing;Airport performance;Econometric regression modeling;Queue length;Simulation analysis;Taxiway system
The objective of this study is to improve the methods of determining unimpeded(nominal)taxiing time,which is the reference time used for estimating taxiing delay,a widely accepted performance indicator of airport surface movement.After reviewing existing methods used widely by different air navigation service providers(ANSP),new methods relying on computer software and statistical tools,and econometrics regression models are proposed.Regression models are highly recommended because they require less detailed data and can serve the needs of general performance analysis of airport surface operations.The proposed econometrics model outperforms existing ones by introducing more explanatory variables,especially taking aircraft passing and over-passing into the considering of queue length calculation and including runway configuration,ground delay program,and weather factors.The length of the aircraft queue in the taxiway system and the interaction between queues are major contributors to long taxi-out times.The proposed method provides a consistent and more accurate method of calculating taxiing delay and it can be used for ATM-related performance analysis and international comparison.
1.Introduction
Airport surface movement management has attracted extensive interests of US aviation community,given the increased airport surface delay in recent years and consequent excess fuel burn and emissions.While researchers dedicating efforts to develop systems to reduce surface delay,which are similar to airport collaborative decision making(A-CDM)implemented at some EU airports,how to evaluate the outcomes of those systems also needs careful consideration.Surface delay iswidely used to indicate the performance of airport surface movement.It is defined as the excess time needed to taxi-in or taxi-out while compared to unimpeded time that flights take if there is no interference during their taxiing process.US airports are improving their equipment and system so that operational data can be recorded and played back to track taxiing process.Nevertheless,there is no automated tool for computing the unimpeded taxiing time and thus taxiing delay.
For flight operations at airports,‘bottleneck” areas on the surface where congestion could occur include gates,apron area,taxiways,and runways–with the last two elements often referred to as the airport movement area.There are different perspectives in defining taxi-out times in this area of literature.On the one hand,an explicit definition of taxi-out time refers to the amount of time between an aircraft’s pushback from the gate(off-block time)and its takeoff from the runway(wheel-off time).From an airlines’point of view,once an aircraft has left the gate,any excess time from an optimum unimpeded time that occurs before takeoff shall be considered as inefficient,regardless of its occurrence in the ramp or movement area.In addition,this definition only requires two time stamps:off-block time and takeoff time for each flight,which are both readily available in the aviation system performance metrics(ASPM)databases that the author used to obtain flight data.On the other hand,it is usually the airports or airlines themselves that control aircraft movement in the ramp area;air navigation service provider(ANSP)(e.g.the Federal Aviation Administration(FAA)in the U.S.)oversees the movement area.To evaluate the performance of each entity,aircraft movements in two areas need to be separately considered.For major airports with both a ramp control tower and an air traffic control tower,agreements are made on which spots to appropriately take over the control of aircraft from each other.For instance,only three out of 14 available spots on the surface of Philadelphia International Airport(PHL)are utilized between two towers to take over the control of flight movements.1The taxiing time for ANSP,according to this alternative de finition,shall be the time that aircraft spend beyond the handover spots and before takeoff.Which de finition to use is truly dependent upon research objectives and the availability of data.To evaluate taxiing performance by control areas would require more sophisticated data in additional to the available data for this study.Therefore,the taxi-out time in this study is de fined as the difference between off-block time and runway takeoff time.
Unimpeded taxi-out time is de fined as the travel time of an aircraft from pushback from the gate to takeoff on the runway without any interference of other traffic.This time variable is considered as the reference to estimate inefficiencies during the taxi-out phase.Whereas the U.S.and European systems have the same definition of unimpeded taxiing time,2methodologies used to derive this variable are different.The operational inefficiency during the taxiing phase,also defined in this research as additional taxiing time(or taxiing delay),is measured by the excessive time that aircraft take for the taxiing process in addition to the unimpeded reference time.Note that sometimes a certain amount of waiting in taxiing system is desirable for maximizing the utilization of other airside facilities,e.g.to avoid idle periods of runway usage so as to maximize runway throughput1,2.
The objectives of this study are to:(1)Review existing methods of computing unimpeded taxiing time;(2)Compare the main existing methods for representative U.S.airports;(3)Propose new methods for determining unimpeded taxiing time;and(4)Discuss future research needs in this area.
The remaining of this paper is organized as follows:Section 2 reviews the literature and ongoing research on modeling taxiing times and defining unimpeded taxiing time;Section 3 compares the outcomes of existing methods for representative U.S.airports;Section 4 proposes different methods that can be used for estimating unimpeded taxiing time,including the methods combining visualization and statistical analysis and the method with refined econometric regression models.Section 5 concludes the study and provides recommendations for further study.
2.Literature review
2.1.Existing methods used by U.S.and EU ANSPs for estimating unimpeded taxi times
2.1.1.The U.S.APO method
The FAA Aviation Policy and Planning Office(APO)established a process for estimating unimpeded(nominal)taxiing times recorded in the ASPM database(see Appendix A).It is based on two linear equations,one for taxi-in and the other for taxi-out,and contains both taxi-in and taxi-out queue lengths.3The APO process seeks to build a numerical relationship between aircraft on the ground and taxiing time through a linear regression model.Model inputs are derived from the ASPM database.Note that aircraft are not recorded as either being in a queue or even outside the ramp area of the gates;the parameters recorded are a gate-out time and a wheel-off time.These values are used as surrogates for taxi-out time even though an aircraft may spend considerable time within the ramp area after a gate-out message is triggered.Appendix A describes the details of the APO method and Fig.summaries the methodology in a flow chart.The APO method explains taxiing time by departure and arrival queue lengths;however,it does not involve any other contributing factors such as runway configurations,weather conditions,or terminal/gate location.Also,APO method only applies to airline service quality performance system(ASQP)carriers(see Appendix C)and other airlines at airports are assigned with an average value.4As shown in Step 5 in Fig.1,for obtaining the unimpeded taxi-out time,it usually set the number of departing aircraft to be 1 and arriving aircraft to be 0.
2.1.2.Europe performance review unit(PRU)method
Namely,the PRU method developed by EUROCONTROL determines a common unimpeded taxi-out time for a group of flights that share similar characteristics(see Appendix B).Dependent upon data availability,these characteristics include aircraft class and pairs of departure stand and runway end,or aircraft class only(as in a simplified version of this method).A congestion index is calculated for every flight and a congestion index threshold is established for each group.After trimming flights by the threshold value on the congestion index,the truncated mean of remaining flights in the group(i.e.averaging taxi-out times between 10th and 90th percentiles)is calculated as the unimpeded taxi-out time for the group.
Due to data limitation of ASPM systems,there is no available record for runway or stand information.Hence,a simpli-fied version of the PRU method is applied in this study.The simplified version of the PRU method2for calculating the additional taxi-out time is divided into five steps shown in Fig.2.
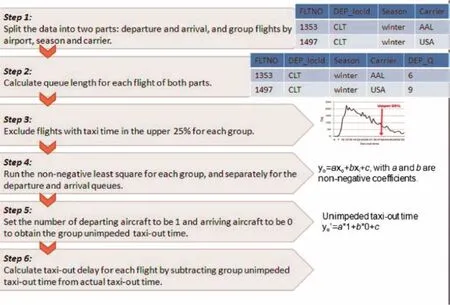
Fig.1 FAA APO method for determining unimpeded taxi-out time.
2.1.3.20th percentile method(P20)
Another method used in this field of literature to calculate unimpeded taxiing times is simply to construct the cumulative distribution function of taxi-out times for each group of flights,grouped by flight carrier,season,and runway con figuration,and then take the value of actual taxi-out times at the 20th percentile as the unimpeded taxi-out time.
2.2.Other methods from literatures
Causal factors contributing to taxiing times identified in the paper by Idris et al.include runway configuration,airline/terminal location,departure demand,departure queue size,weather,and downstream restrictions.5They stated that the runway configuration determines the flow of aircraft at the airport,presents the level of interaction between the flows,and restricts the capacity of arrivals and departures.They also discussed weather and downstream restrictions in view of the fact that adverse weather greatly reduces the capacity of the airport.Although both of the regression models in the FAA APO process and the Idris paper considered arrival and departure queue length as the major contributor for modeling taxiing time,the methods of calculating the queue length are different.

According to the queue length calculation method described in the APO process,the number of flights available on the ground at the time of the reference flight’s gate-out message is considered as the departure queue lengthqo.In Fig.3(a),theqoequals 3,including the flights represented by the two green and one purple arrows.However,while considering passing and overpassing,the departure queue length in that case is 2.Similarly in Fig.3(b),the queue length,according to APO method is still 3 but after considering passing and overpassing,the queue length is 4.
Table 1 shows a comparison using historical operational data.According to the definition by the FAA’s APO model,the departure queue for the NWA flight that gated-out at 7:10 a.m.is 7.Nevertheless,the departure queue for that flight is supposed to be 5,because it passed the two flights DAL and FLG that gated-out at 7:08 a.m.but took off later than the NWA flight.
The queuing model proposed by Idris et al.for taxi-out estimation assumed take-off queue to be the primary factor affecting the taxi-out time of an aircraft,without considering taxi-in queue in the model.They set up different combinations of carriers and runway configurations as subsets.The data of the case study presented in the paper contained a total of 56 subsets.The downstream restrictions were not considered as sep-arate variables but were assumed to be a part of the departure queue.Idris et al.stated that aircraft that experienced long taxi-out times due to passing and restrictions would have long take-off queues.For all the subsets,a probability distribution function(PDF)was developed that gives the probability of a queue forming depending on the number of aircraft present on the airport surface at that particular time.An average taxi-out time was calculated over all possible queue sizes and then a second-order equation was fitted to these values.Their model was compared to the running average model used in the ETMS and showed a reduced mean absolute error.The model predicted 66 percent of taxi-out times within 5 min of actual time and is applicable when the number of aircraft present on the airport surface is known.
TheEnhancedTrafficManagementSystem (ETMS)model6estimates the taxi-out time using the running averages of the previous two weeks.The limitation of this model is that it does not take into consideration important factors affecting the taxi-out time of an aircraft,such as runway configuration.Shumsky7proposed two linear models to predict taxi-out time–a static model and a dynamic model.The static model uses variables such as carrier,runway configuration,weather,and a measure of airport congestion.To explain airport congestion,Shumsky projected two different measurements:the number of push backs in a given time period around the pushback of the reference flight,and the number of departing flights presented on the runway at the pushback time.The results of this study showed that estimations using queue size were better than using the number of aircraft on the runway as a measurement for airport congestion.Shumsky also claimed that the static model was as good as the dynamic model for a short time horizon,such as a 15-min period.Nevertheless,for a longer time horizon,the dynamic model yields superior results.
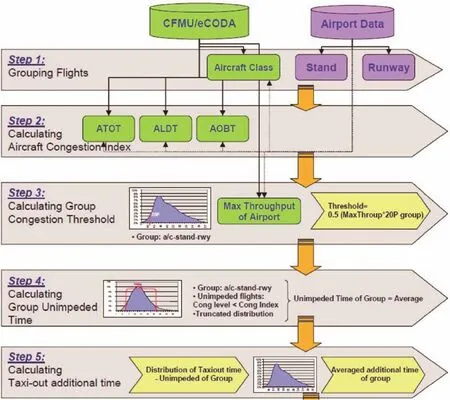
Fig.2 Simplified PRU method for determining unimpeded taxi-out time.
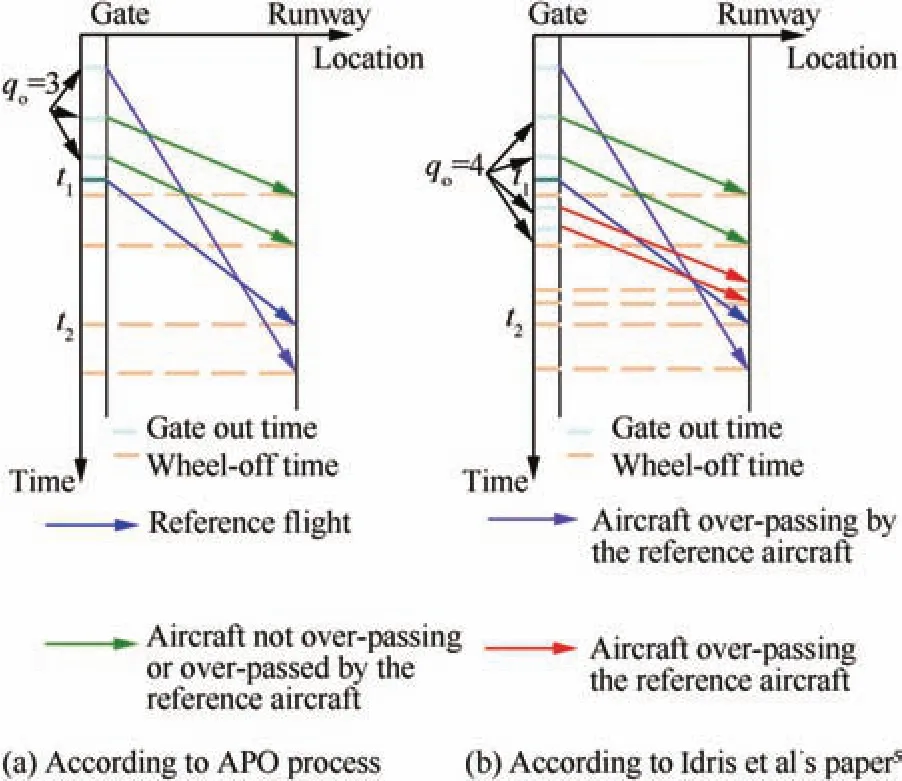
Fig.3 Comparison of queue length calculations.

Table 1 Illustration of different queue length calculation methods.
3.Comparison of three methodsused by U.S.and EU ANSPs
LaGuardia Airport(LGA),Philadelphia International Airport(PHL),and Charlotte Douglas International Airport(CLT)are among the airports with longest taxi delays in the U.S.8and they are selected for comparing the taxi-out times by applying different methods(see Fig.4).The main purpose of this comparison is to test if there is consistent trend of difference between various methods across all different types of airports.We argue that if the difference trend is not consistent,itishard to convince aviation researchers,practitioners,and managers about the taxi time comparison of U.S.and EU airports in the ATM-related performance comparison report.8
The flight data of 2007 are used,as it is the year with the highest taxi times in last decade.Flights of ASQP carriers are grouped according to carrier and season.Groups with a low number of flights(less than 100)are not considered in the comparison.Once an unimpeded taxi-out time is obtained for a group(with the same carrier during the same season),the same value is assigned to all flights in the group,and the weighted unimpeded taxi-out times and standard deviations for the airport are computed,as shown in the first two rows in Table 2.Row 3 and 4 present the minimum and maximum unimpeded taxi-out times across the different groups.
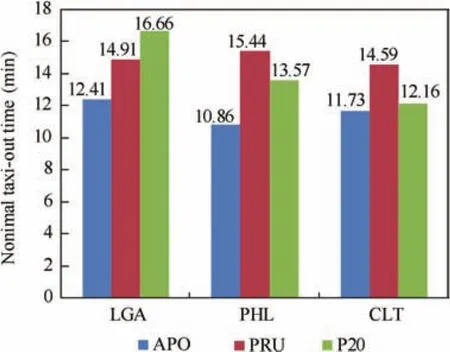
Fig.4 Comparison of average unimpeded taxi-out time in minutes at LGA,PHL and CLT.
The comparison of the three methods for various airports shows that the difference trend of the three methods is not consistent.Furthermore,the three methods of computing unimpeded taxiing time and then taxiing delay does not provide insights on how to develop countermeasures to alleviate that taxiing delay.Thus,in this study,we propose other new methods for obtaining unimpeded taxiing time and taxiing delays.
4.New methods for computing unimpeded taxiing time and taxiingdelays
4.1.PDARS observation
With the applications of advance technologies in aviation,more sophisticated airport surface data become available,including Performance Data Analysis and Reporting System(PDARS)based on data recorded by Airport Surface Detection Equipment,Model X(ASDE-X).PDARS data provides historical surveillance data on surface operations at a few U.S.airports.After an initiated data request,surface trajectories for individual flights are presented with Graphical Airspace Design Environment(GRADE).
An example of multiple flight trajectories at PHL is shown in Fig.5 with two days of traffic on April 8,2010,and May 20,2010.It is noted that flights in historical data are operated in different taxiing routes other than the shortest path assumed in the ADSIM+simulation that will be discussed in next subsection.Taking the same example from terminal B to runway 27L(see Fig.6),the shortest path is for flights to exit the ramp and then directly cross runway 27R to runway 27L(Fig.6(a)).But only a few flights took the shortest taxi route.From the observation,however,most flights taxi around end of runway 27R then approach to 27L to avoid active runway crossing(Fig.6(b)).
After manually observing two days of ASDE-X data,about 100 flights are identified without delay during taxi-out phase or hold for other traffic in the movement area.Flight trajectories and time stamps of these flights are retrieved from PDARS to derive their unimpeded taxi-out time.Tables 3–5 summarizes the numerical results of unimpeded taxi-out time from historical data.
Hitherto,playing back ASDE-X data through PDARS is one method to observe and understand historical flight operations.However,it is very time-consuming to conduct manual observations for a large number of flight operations.

Table 2 Comparison of unimpeded taxi-out time using different methods.
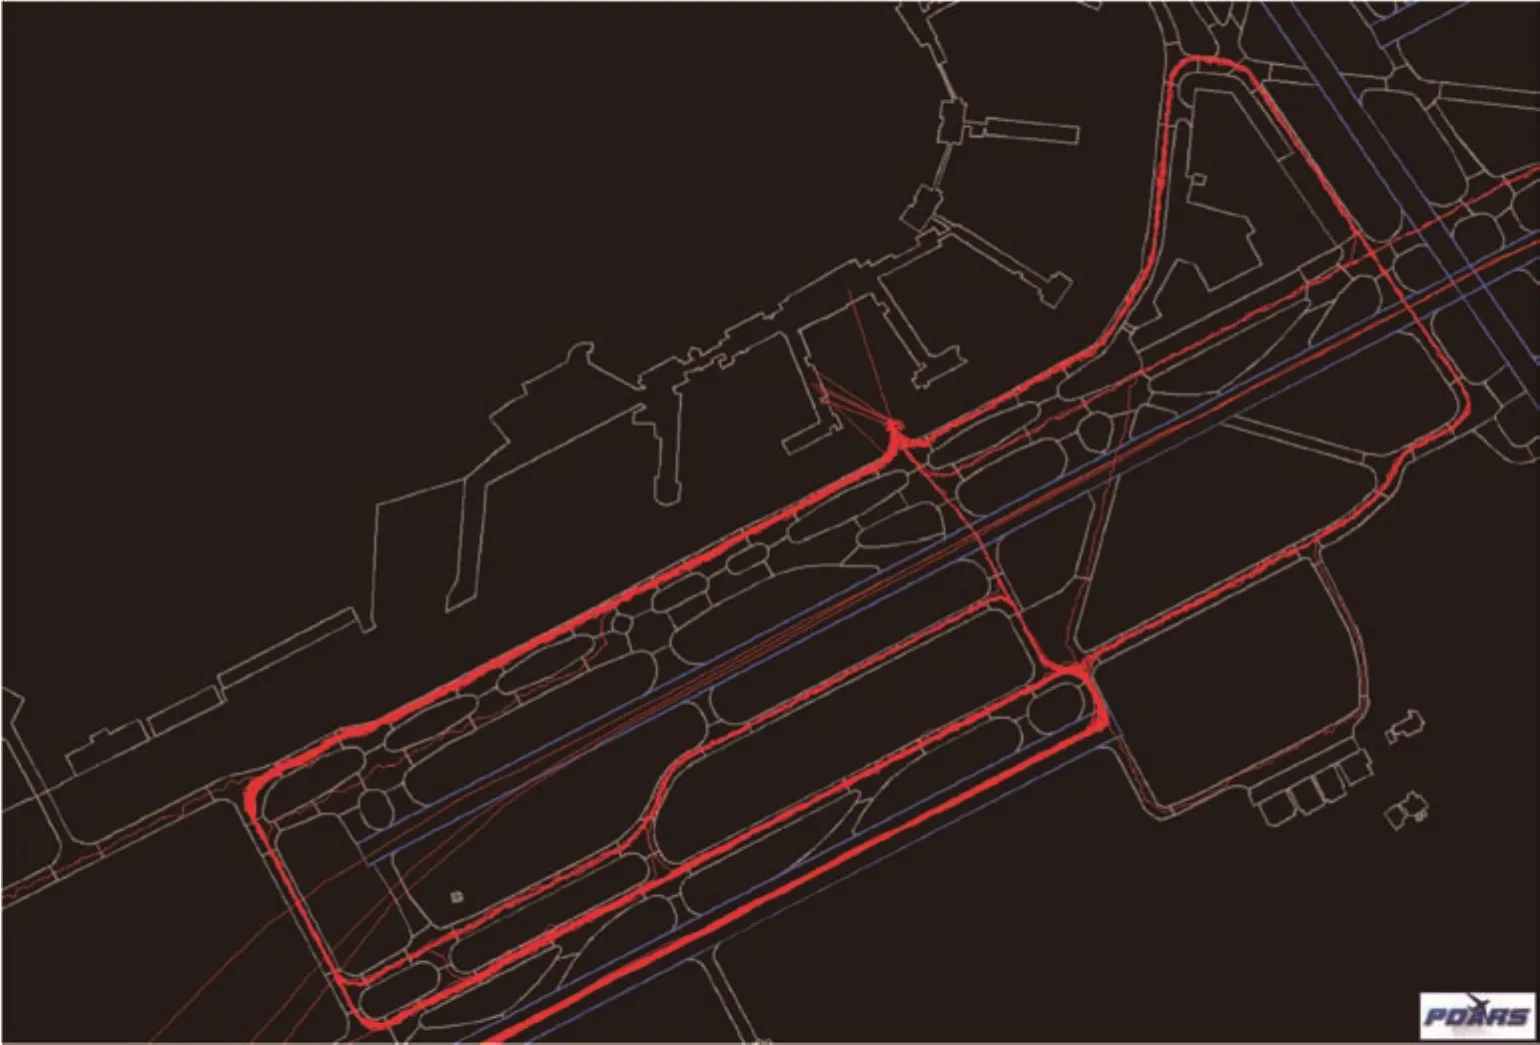
Fig.5 Snapshot of flight trajectories at PHL.
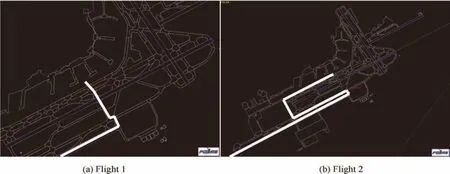
Fig.6 Different taxi routes of two flights with the same gate-runway pair.
4.2.Airport simulation
In addition to observing historical data,qualitative research through simulation is also an efficient way to determine unimpeded taxiing times and derive taxiing delays.According to the definition,unimpeded taxi-out time is defined as the time it takes for aircraft to reach a runway from the gate without stopping or holding;viz.,aircraft taxiing with a consistent taxiing speed could be identified as unimpeded.Thereby,simulation tools can be utilized to determine taxiing distances of any given taxiing routes.With a reasonable estimation of unimpeded taxiing speed,unimpeded taxiing time can be obtained by dividing taxiing distance by taxiing speed.
Advanced Airfield Delay Simulation Model(ADSIM+)is an airport simulation under development by the FAA.A prototype of ADSIM+is used to test the aforementioned simulation method.The precise geographic information of airside facilities,namely runways,taxiways and gates are imported into the model.Fig.7 shows the layout of PHL in the simulation with sample taxiing routes from different gates to runways.
There are seven terminals at PHL(A West,A East,B,C,D,E,and F)and two major runways used for departures.27L|9R,27R|9L,27L are the most frequently used runway configurations.Altogether,there are 28 terminal-runway combinations for different taxiing routes.A schedule of 28 flights is specified in the simulation,with each flight representing an example using distinct terminal-runway combinations.The gate that is the closest to the movement area is identified as reference point for each terminal in this experiment.An example is shown in Fig.7 when a flight is scheduled to leave from a gate in terminal B to takeoff on runway 27L.Taxiing routes are designed based on the shortest path from the gate to the runway.During the simulation,flight movements are simulated in a conflict-free environment so that when one aircraft is taxiing,there is no interference from any other aircraft.Average taxiing speed of 15 knots is assumed for all aircraft in this simulation.
Withthisexperimentaldesign,unimpededtimesare obtained from flights taxiing through each terminal-runway combination.The numerical results for each terminal-runway combination are shown in Table 6.The sample flight taxiing from terminal B to runway 27L indicates an unimpeded taxiout time of 2.30 min for this taxiing route.
Note that the impact of uncertainties at the airport is not included during the simulation.It can be assumed that aircraft pushback from the gate and taxi into the movement area without any interference or delay.The procedure of aircraft pushback and taxiing through the apron area is more complex in reality and further studies are needed to provide a higher resolution of simulation in the ramp area.Future research also includes the impact of different aircraft types and other taxiing route options for each terminal-runway pair.
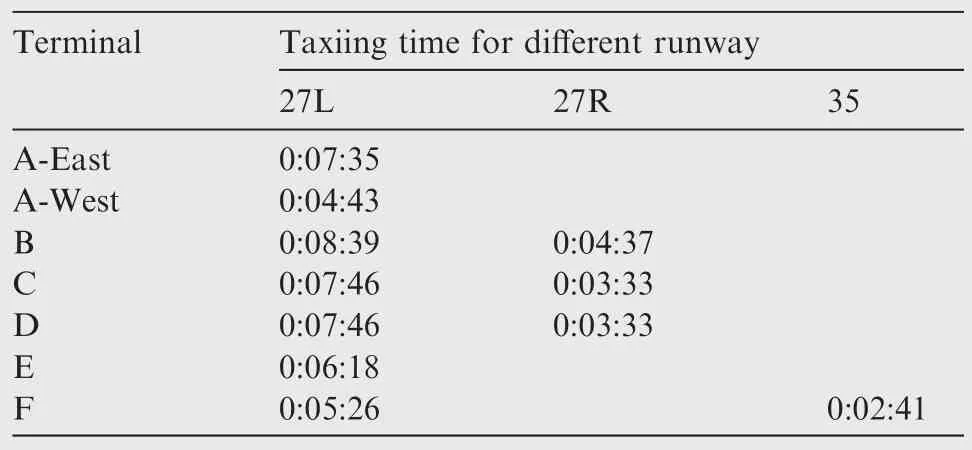
Table 3 Maximum unimpeded taxiing time from PDARS observation.
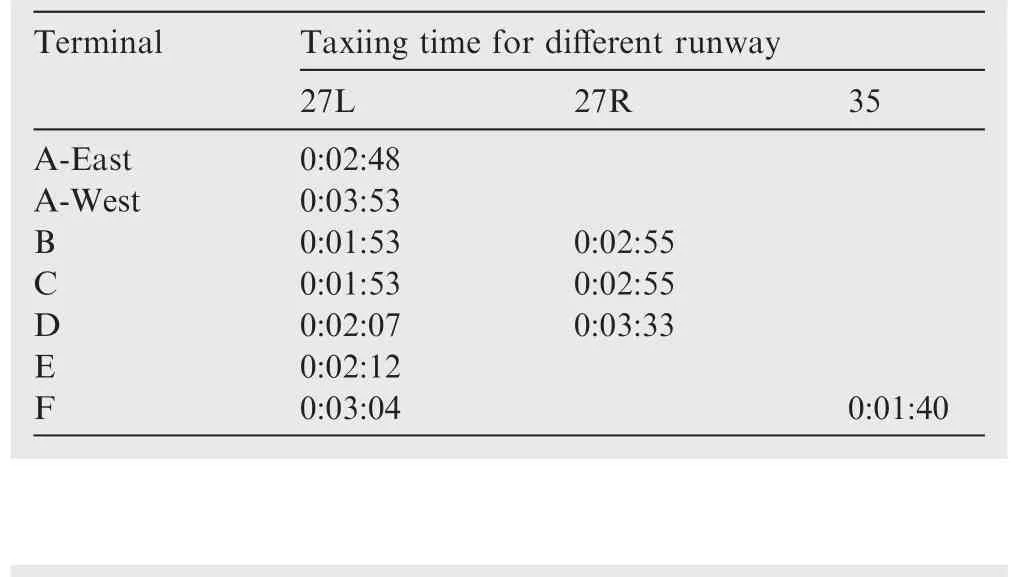
Table 4 Minimum unimpeded taxiing time from PDARS observation.
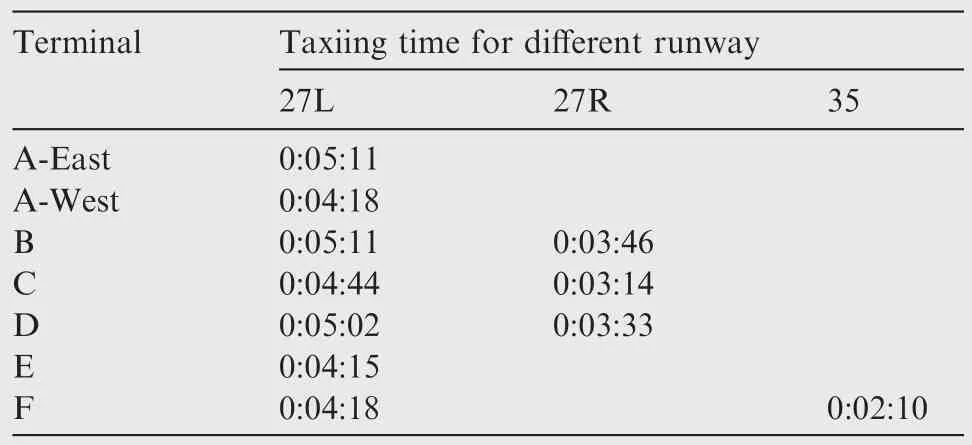
Table 5 Average unimpeded taxiing time from PDARS observation.
4.3.Refined econometricsmodel
In addition to heuristic simulation and observation methods,a sophisticated econometrics regression model is proposed in this subsection to model aircraft taxiing time.First,the author identifies causal factors that contribute significantly to taxiing delay by exploiting available data sources.A log-normal regression model is adapted to model taxiing times followed with a comprehensive set of regression diagnosis and stability test.After that,numerical results are interpreted for a sample group of flights with a mathematical model equation.The aggregated results for all flights are compared among three airports at the end.
The procedure of model development is summarized as following.
(1)Data collection
Flight data,airport information and other factors that contribute to taxiing delay are collected.Individual flight level data from ASPM is retrieved,including OOOI data(Out of the gate,Off the runway,On the runway,Into the gate),published scheduled data,etc.Airport information is obtained through airport websites and other online sources.Other factors,such as historical weather information at airports,are obtained from the database of National Oceanic and Atmospheric Administration.9
(2)Factor identification
This step aims at identifying causal factors of excessive taxiing time and delay.In this area of literature,the number of aircraft on the airport surface is considered to be one of the main contributing factors to excess taxiing delay.5,10A comprehensive examination of other causal factors has been summarized in our previous work.1,11In this study,the same set of factors is included in this model to explore the influence on taxi performance.
(3)Model specification and validation
With collected data and a set of contributing factors,the statistical form of the regression model is determined based on preliminary analysis and a complete procedure of regression diagnostic is followed to specify and validate the model.After that,the test of collinearity is performed to assure the stability of the model.
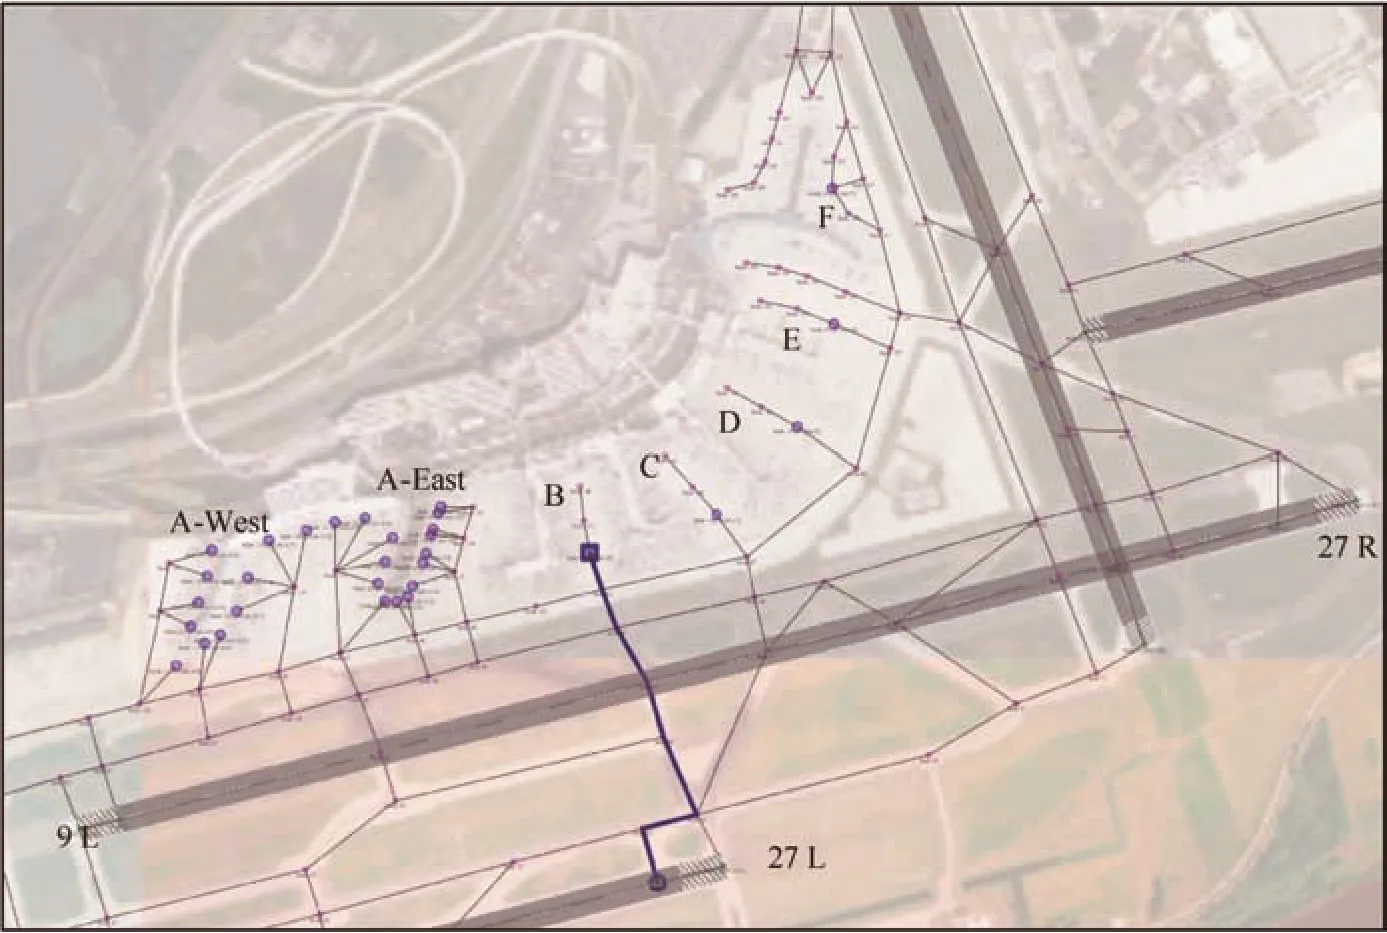
Fig.7 Layout of PHL in the simulation with sample taxi routes.

Table 6 Unimpeded taxiing times for different terminal-runway pairs from simulation.
4.3.1.Contributing factors
(1)Departure and arrival queue length
Departure queue length for each departure is defined as the number of takeoffs that occur ahead of the reference aircraft during its taxi-out process,while arrival queue length for each arrival is represented by the number of aircraft landed and parked at gates ahead of the reference aircraft during its taxi-in process.The variable of queue length is calculated for each flight at each study airport.Only ASQP flights are included in the analysis to provide a consistent comparison with an existing benchmark method.
In addition to the variable of queue length itself,considering the interactions between aircraft,quadratic terms of departure and arrival queues are included in the model to test the significance of quadratic terms in a polynomial regression.
(2)Airport traffic demand
To account for the impact from current airport operations to the reference flight,two variables from ASPM dataset are included in the model to represent airport traffic demand at the moment,viz.EFFDEP which is the count of departures for efficiency computation and EFFARR which is the count of arrivals for efficiency computation.Airport departure and arrival demand in 15 min-intervals are represented by these two variables.
(3)Expected departure clearance times(EDCT)
As one of tactic approaches to assess the imbalance of air traffic demand and airport capacity,EDCT is implemented by assigning runway release time due to Traffic Management Initiatives(TMIs)that require holding aircraft on the ground at the departure airport.4In the ASPM system,EDCT is recorded when the flight was held on the ground past its planned wheels off departure time.In the model,the assignment of EDCT is indicated by a dummy variable for each flight,viz.the variable is set at 1 if the flight is assigned with an EDCT and 0 otherwise.
(4)Runway configuration
For airports with multiple runways,the active runway is based on weather conditions,traffic demand and other factors to optimize the operational efficiency.In the ASPM dataset,such information isrecorded by the runway configuration variable,which lists both departure and arrival runways in use.To account for the impact of different runway configuration on taxiing times,departure and arrival runway configurations are considered separately and multiple dummy variables are introduced to represent the set of frequently-used runway configurations.For each flight,the dummy variable of the active runway configuration is set at 1 and dummy variables for other runway configurations are set at 0.
(5)Taxiing route
Different preferences on taxiing routes could result in inconsistent taxi performance.Ideally,the distance of taxiing route for each flight should be obtained to account for its impact on taxiing time.However,such information is neither recorded in ASPM nor publicly accessible at airports.As an estimate,runway configuration in use is used to indicate different levels of taxiing distance between the terminal and runway end.The estimation is more accurate for some airports with a simple layout,such as LGA,which has only one runway for arrivals and the other for departures.
(6)Weather factors
When weather conditions are less than perfect,the impact on airports and airspace is profound in terms of reduced visibility for pilots and controllers,degraded capability for traffic management and decreased airport capacity.Obtained from National Oceanic and Atmospheric Administration online resource,9a set of weather factors are analyzed in the model,including wind speed(SPD),ceiling of cloud(CLG),visibility at the airport(VSB),temperature(TEMP),precipitation of last hour(PCP01)and average precipitation of previous 6 h(PCP06).
4.3.2.Regression function
To illustrate the technique for carrying out a regression analysis,an example of the regression model at CLT airport is presented in this and next two subsections.The diagram of CLT airport is shown in Fig.8.
Obtained from ASPM database,annual flight data at CLT is first grouped by different seasons,air carriers and aircraft class as these factors are demonstrated to have a profound impact on taxiing times.1,11After grouping,models with the same structure but different parameters are developed for each group of flights.To illustrate this,a group of flights at CLT,‘USA,spring,Jet Small”,which represents all small jet aircraft operated by US Airways during spring is selected as an example.The group contains a total of 19204 flights.Fig.9 depicts the distribution of actual taxi-out time(ACTTO)for all flights within the group.A log-normal distribution is observed from the continuous frequency distribution of actual taxi-out times.Driven by the observation,a log-normal regression method is determined for that modeling in which the dependent variable of the regression function is represented by lg(ACTTO).
4.3.3.Regression diagnostic
The objective of regression diagnosis is to assure that the data meet all regression assumptions prior to implementation so that regression results are valid and accurate.In this part of the study,Yis used to represent the dependent variable lg(ACTTO)andXis used to indicate different decision variables that were introduced in the previous subsection.Before the implementation of regression technique,the following five Gauss–Markov assumptions need to be satisfied to assure that Ordinary Least Square(OLS)is the best linear unbiased estimate(BLUE)12:
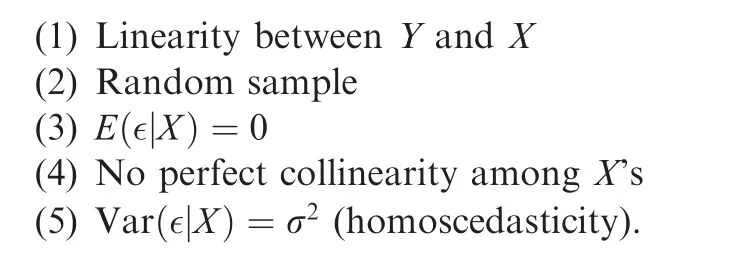
The linearity betweenYandXis examined by simply observing the scatter chart between lg(ACTTO)and each decision variable.As an example,Fig.10 shows the plot of departure queue length versus lg(ACTTO).A linear trend line is also presented in the figure and a high level of goodness of fit is observed withR2=0.741.
It is also observed from Fig.10 that the scatter chatter presents a concave shape between departure queue length and lg(ACTTO).It indicates that taxiing time will not be linearly elongated with the increase of departure queue length.To account for this impact,quadratic terms of queue length are introduced in the regression model.

To test for perfect collinearity,correlations between each two explanatory variables are calculated as in Table 7.QoandQirepresent departure and arrival queue length,EFFDEP and EFFARR indicate departure and arrival demand at the airport.SPD,CLG,VSB,TEMP,PCP01 and PCP06 are different weather factors including wind speed,ceiling of cloud,visibility,temperature,precipitation of last hour and average precipitation of previous 6 h.Dummy variables of EDCT and runway configuration are not listed in the table below where the correlation values are all close to 0.Based on the correlation computation outcomes,it is reasonable to assume that no perfect collinearity among explanatory variables exists because none of these correlation factors is or even close to 1.

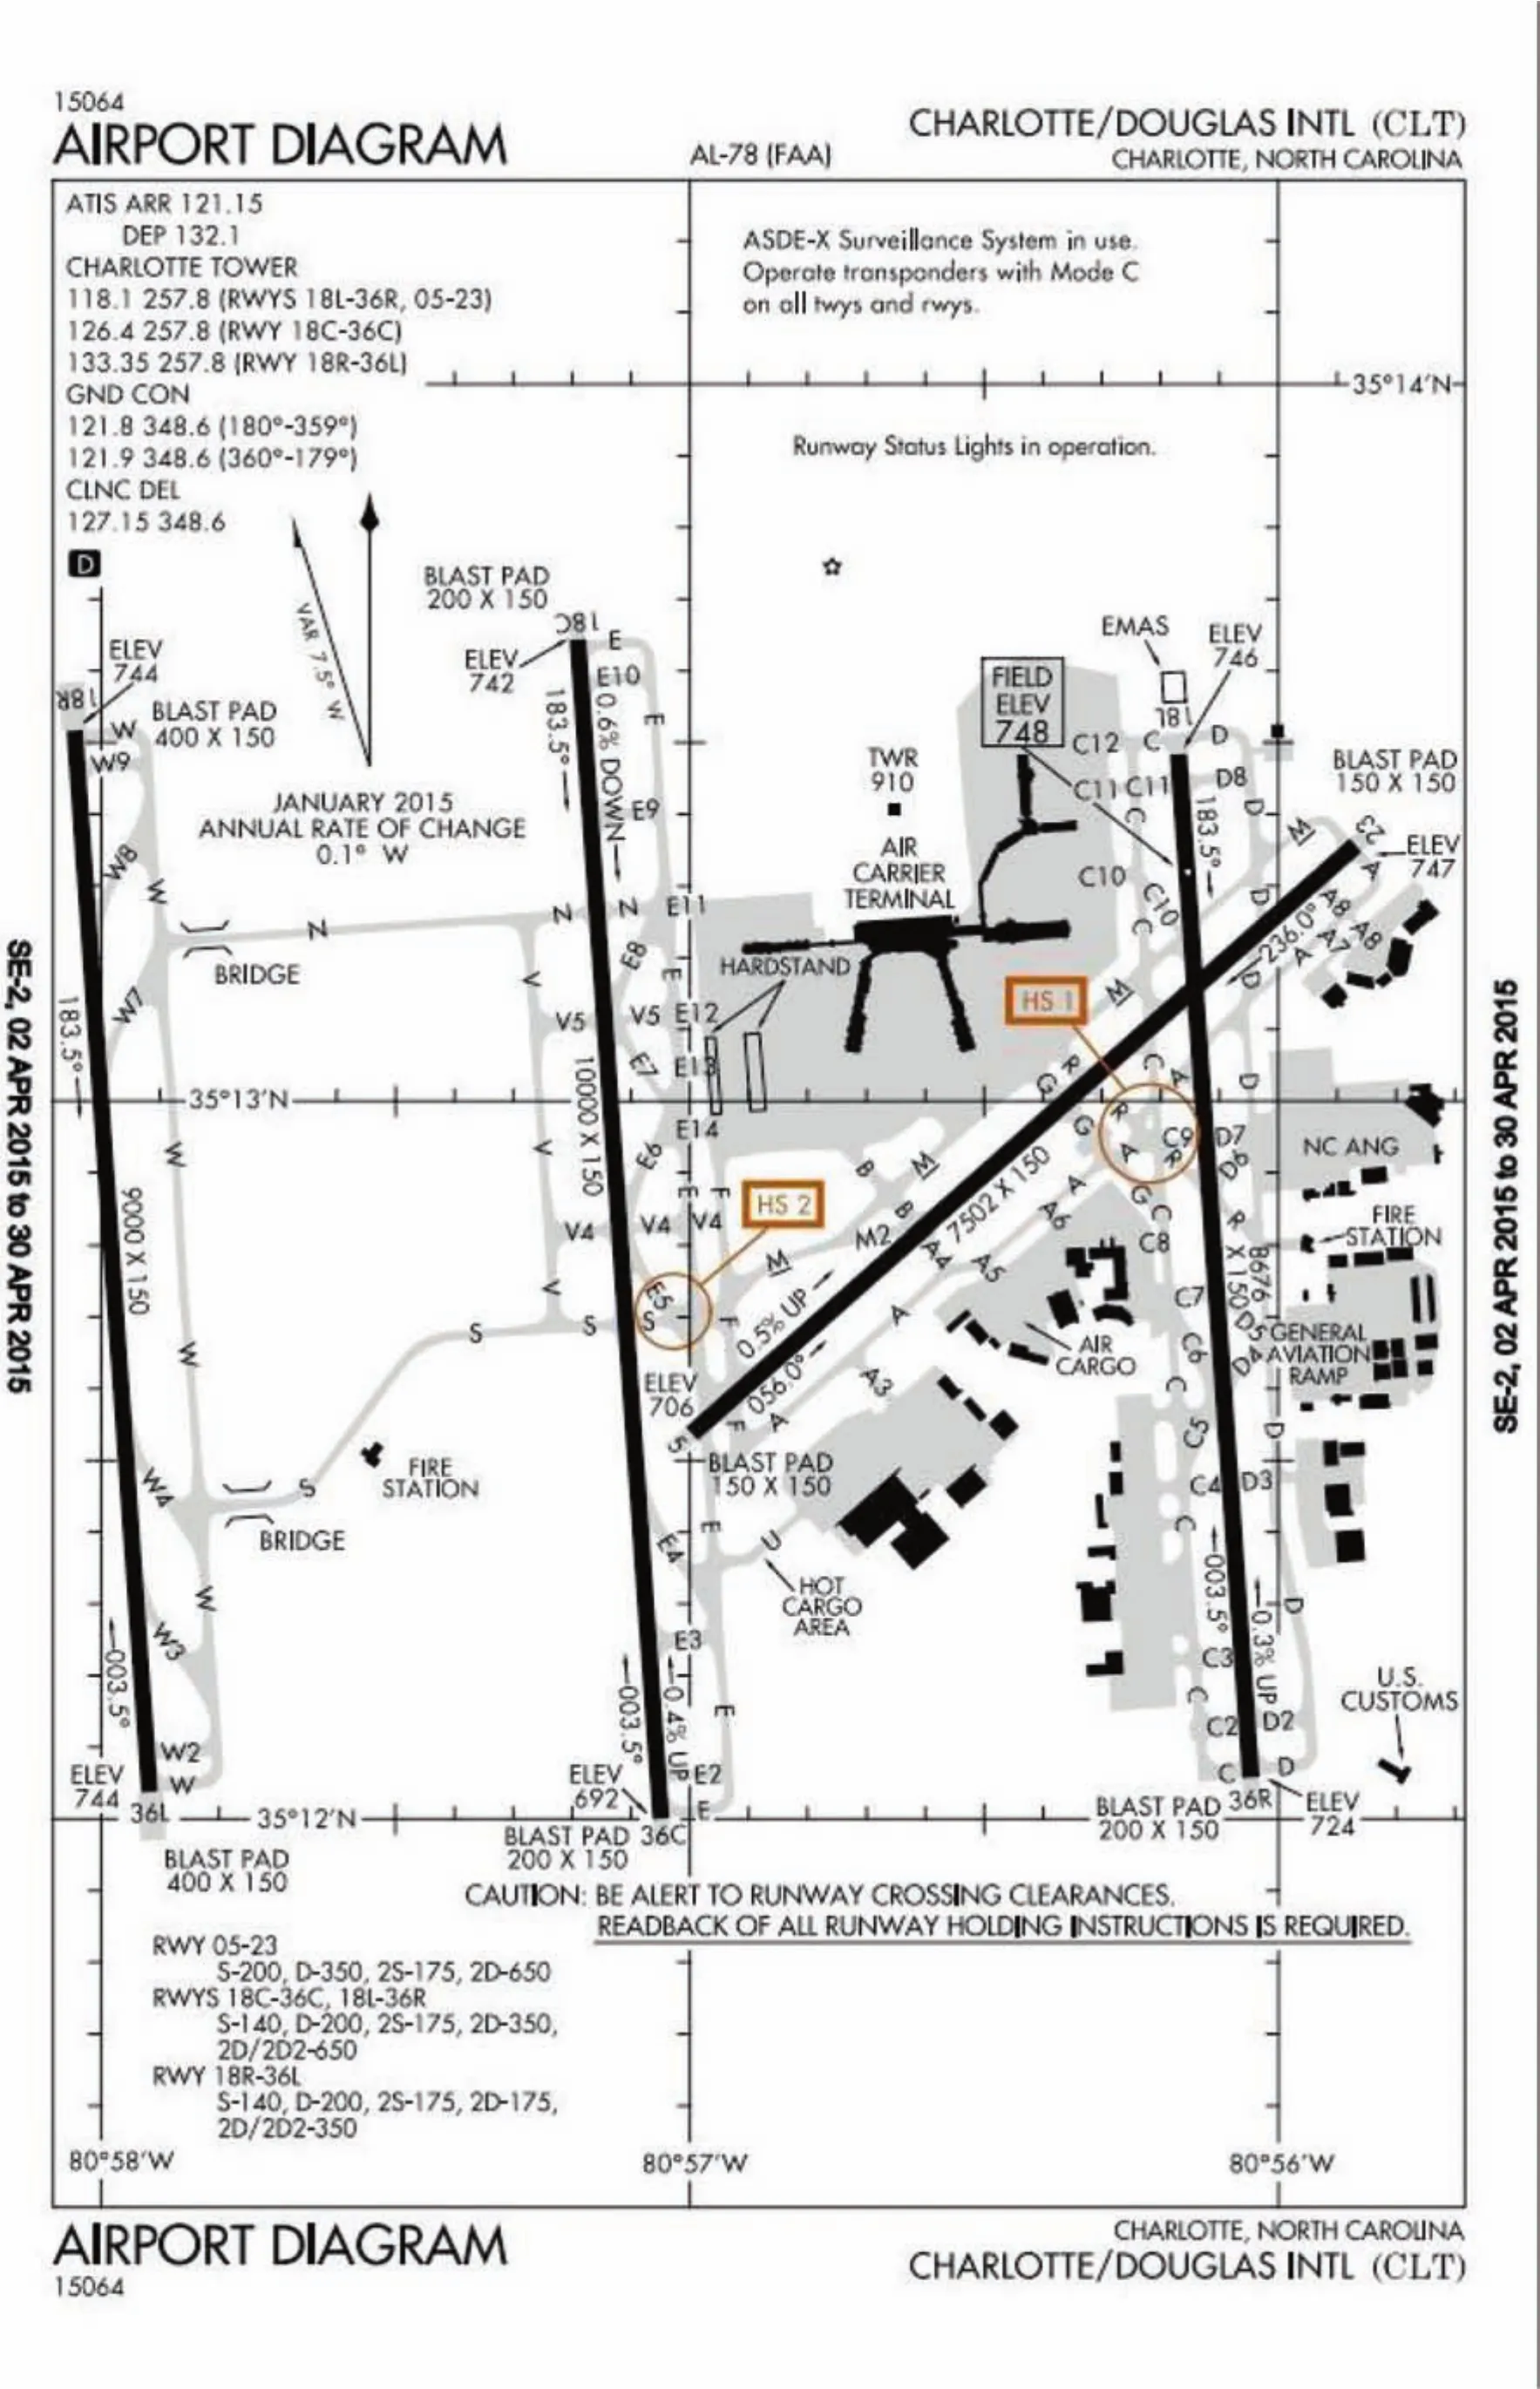
Fig.8 Diagram of CLT airport(from https://upload.wikimedia.org/wikipedia/commons/7/7d/CLT_Airport_Diagram.pdf)

Fig.9 Frequency distribution of actual taxi-out time for selected group of flights.
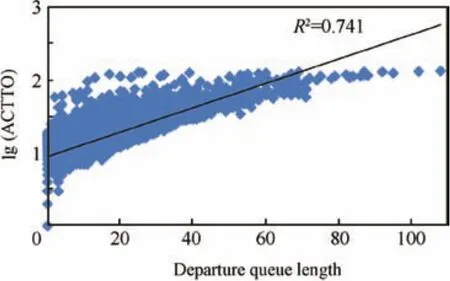
Fig.10 Scatter plot of departure queue length versus lg(ACTTO).
So far,all of Gauss–Markov assumptions are tested and the outputs together imply that OLS can be applied in our model and that it provides the best linear unbiased estimate.In addition,the test of multicollinearity is performed by measuring variance inflation factor(VIF)and condition index (CI)to assure the stability ofthe model.A multicollinearity problem is indicated if a tolerance is less than 0.10 and/or a VIF is higher than 10 and/or a CI is above 30.12With the test results shown in Table 8,it can be suggested that all indexes are within the reasonable range and no multicollinearity problem is detected in the model.
4.3.4.Numerical results
4.3.4.1.Example model equation.Hitherto,all five Gauss–Markov assumptions are demonstrated to be satisfied and the test of multicollinearity is performed to ensure the stability of the model.The output of regression model for the sample group of flights is shown as Table 9.

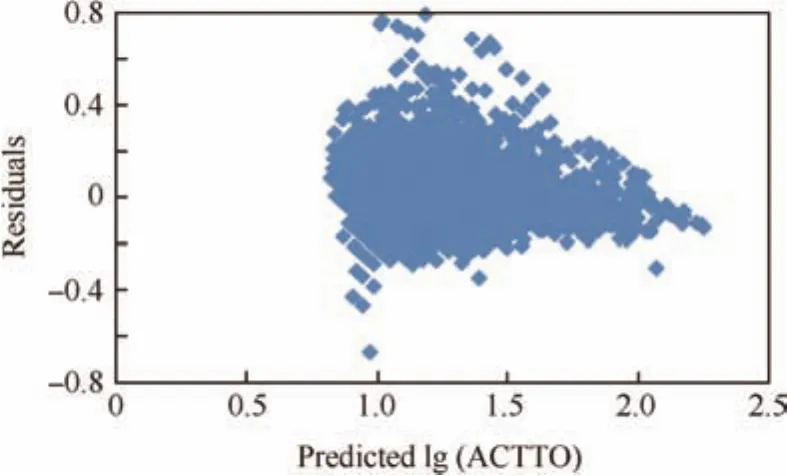
Fig.11 Scatter plot of residuals versus predicted lg(ACTTO).

Table 7 Correlations among explanatory variables.
Overall,the size of all data points evolved in this regression model is 19197,with 390 missing points excluded.A total of 19 independent variables are analyzed in this model.The p value offtest is less than 0.001 that indicates explanatory variables altogether are statistically significant.
4.3.4.2.Comparison results.To provide comparable results,these proposed models are implemented for three airports,LGA,CLT and PHL,respectively.The comparison results are illustrated from two aspects:goodness of fit and average taxiing time.The APO method is set as the reference to demonstrate the performance of a proposed statistical model.In addition,variants of this statistical model with different combinationsofdecision variablesare derived asthe following:
(1)Basic=constant+queue lengths
(2)Basic+EDCT dummy(E)
(3)Basic+Runway configuration dummy(R)
(4)Basic+Queue length quadratic terms(Q)
(5)Basic+E+Q
(6)Basic+R+Q
(7)Basic+E+R+Q
The basic model contains only departure and arrival queue length as decision variables.Six variants of models are derived by adding a mixed combination of EDCT dummy variables,runway configuration dummy variables,and quadratic terms of queue lengths.
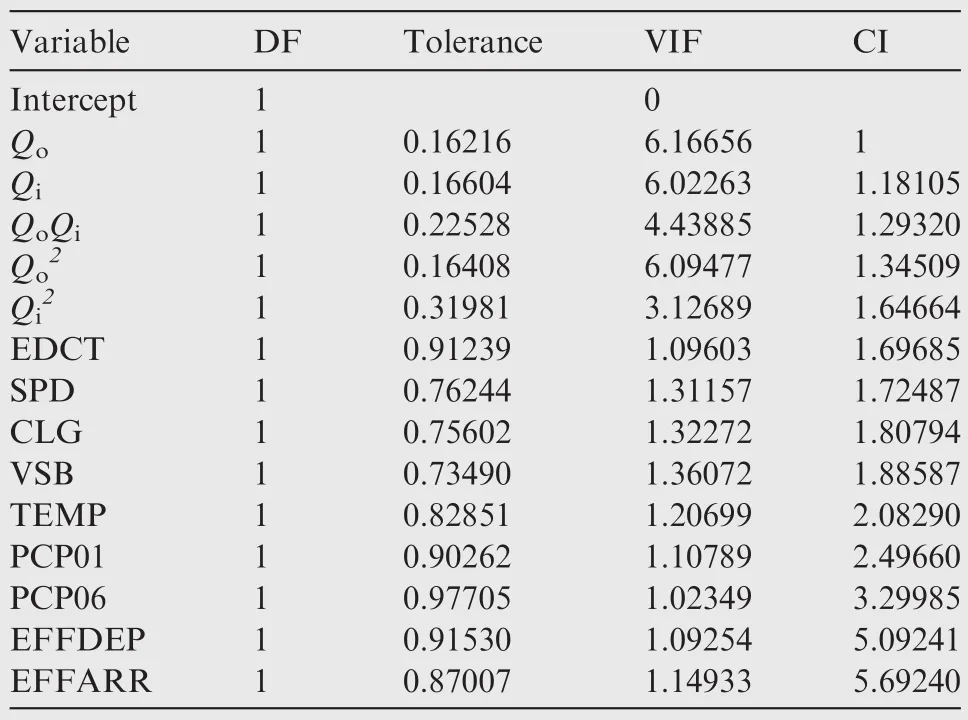
Table 8 Test results for multicollinearity.
(1)R-square value
Based on annual flight data in 2007 from ASPM,flights at each airport are first grouped by carrier and season.There are 63 groups obtained for LGA,56 for CLT and 62 for PHL.Next,the regressions analysis of proposed models is conducted for each group at each airport.Descriptive statistics across all groups are collected together and compared with results from the APO method.As shown in Table 10,the goodness of fit of APO method is quite poor with a much lower value ofR2than any variant of proposed models.For example,the average R-squares of proposed models range from 0.72 to 0.74 among 63 groups at LGA while that of the APO method is only 0.39.The table also shows the regression model with a complete set of decision variables involved,where(Basic+R+E+Q)yields the best goodness of fit with the highestR-squares among all other variants for all three airports.
(2)Unimpeded taxi-out time
Similar as the APO method depicted in Fig.1 and Appendix A,once the modeling of taxi-out time is done,given the estimated coefficients,we set the number of departing aircraft to be 1 and arriving aircraft to be 0 to obtain the group unimpeded taxi-out time and then the average taxi-out time of oneairport.Fig.12 shows the comparison of calculated unimpeded taxiing times by APO method and the proposed model for three different airports,LGA,CLT,and PHL.It is observed that this proposed model leads to a lower value of unimpeded taxiing time compared to the APO method.With a high level of goodness of fit,the proposed model provides a more accurate measurement for taxiing performance,quantifies the impact of various factors to taxiing inefficiency,and supports decision-makers with reliable measurements to improve the operational performance.
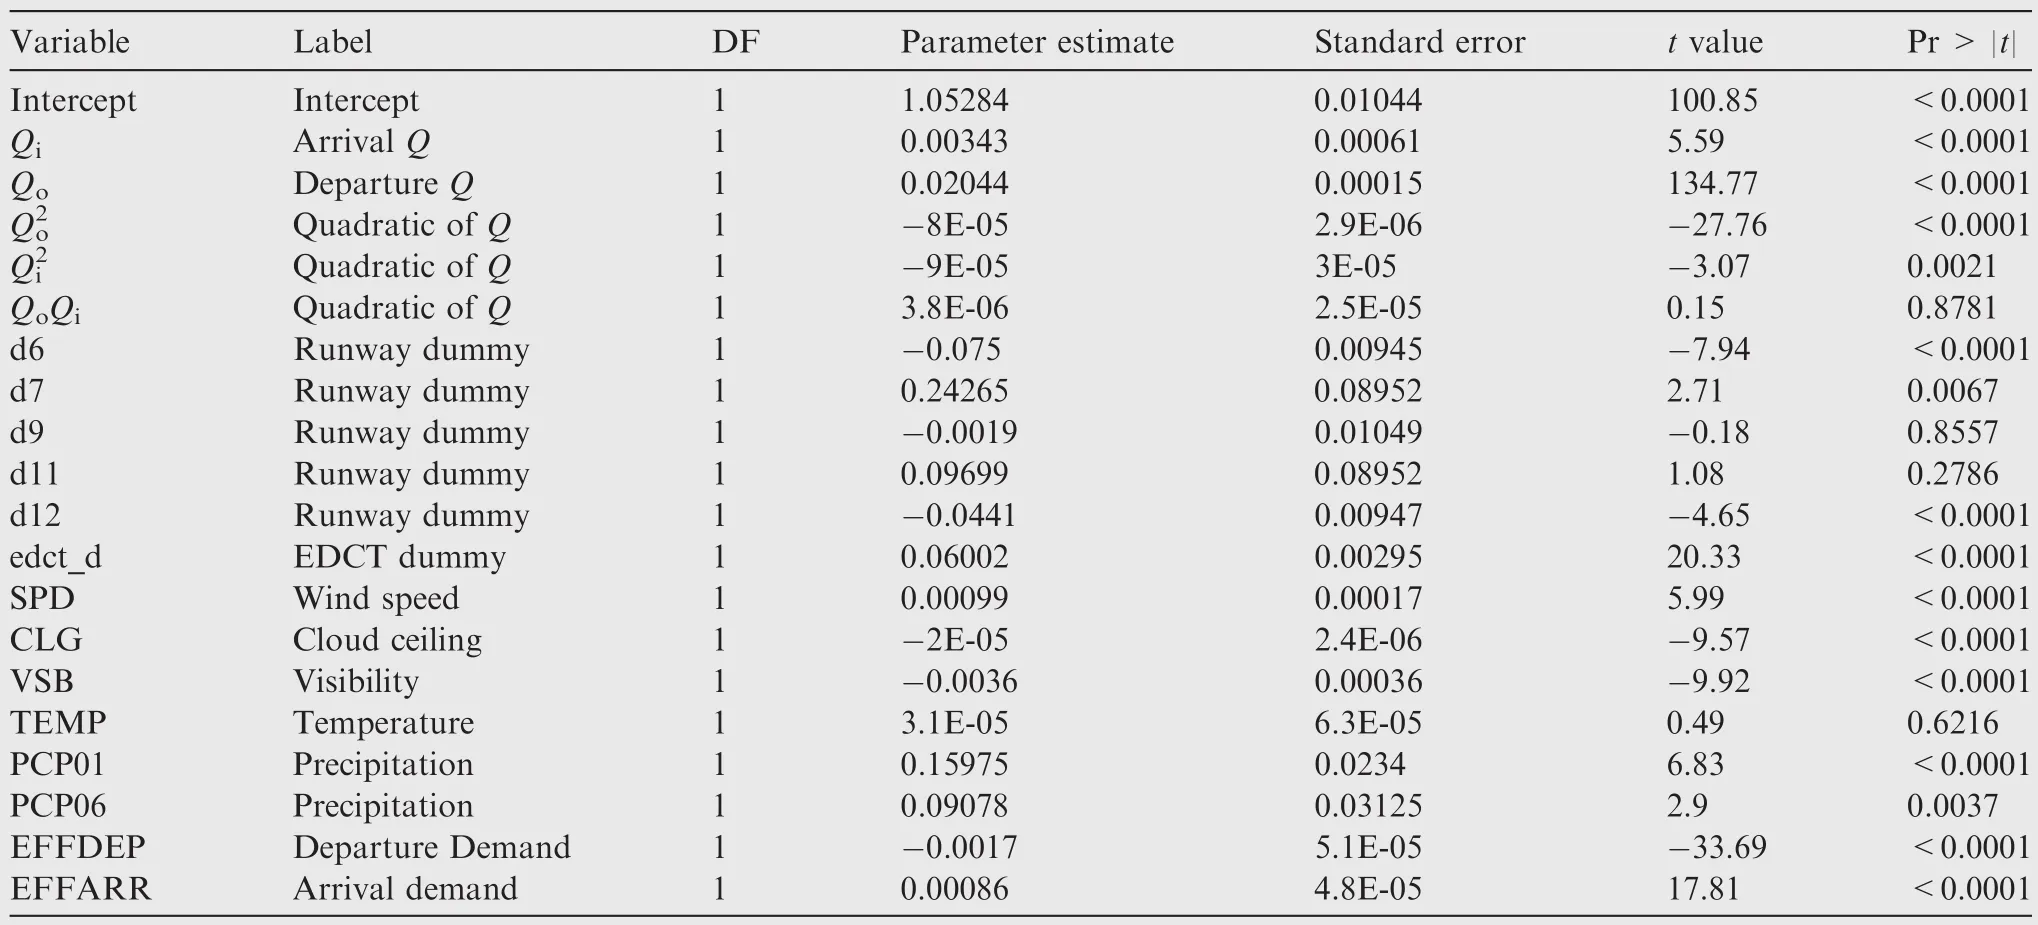
Table 9 Summary of regression output for the sample group of flights.

Table 10 Comparison of R-squares of different models at CLT,PHL and LGA.
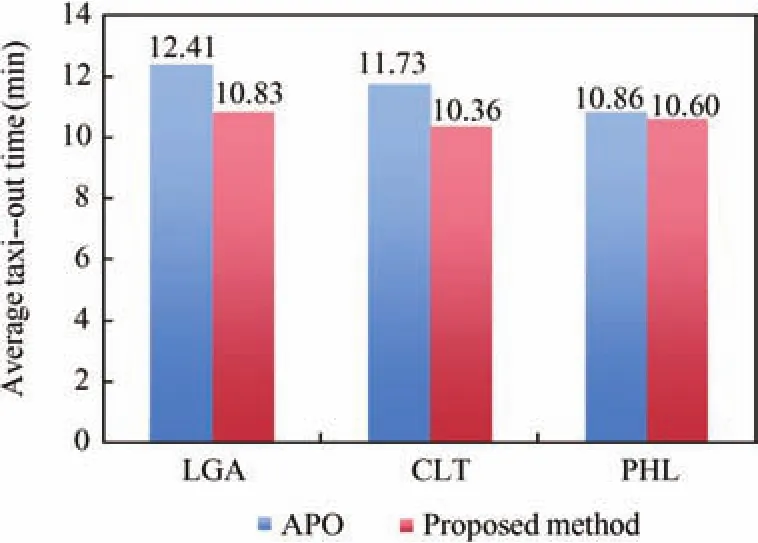
Fig.12 Average taxi-out time by APO method and the proposed method at CLT,LGA and PHL.
5.Summary
Unimpeded taxiing time is the reference time used for estimating taxiing delay,a widely accepted performance indicator of airport surface movement.As noted,the varying methods applied by the FAA and EUROCONTROL are used to measure taxiing efficiency.Hence,this study first compares three methods of determining unimpeded taxi-out times for the same airports.The comparison shows that the APO and PRU methods lead to different unimpeded taxi-out times,consequently different taxi-out levels of efficiency.It is suggested that a clear definition of taxiing time should be defined and a consistent method of determining unimpeded taxiing times should be developed for the evaluation of airport operational performance.
New heuristic methods are explored by the simulation and observation of historical operational data in a geographic platform.However,due to various limitations,such heuristic methods are not yet generally applicable at airports.Hence,based on the FAA APO model,we proposed a refined econometrics regression model to measure taxiing time,i.e.a lognormal regression model,followed by a comprehensive set of regression diagnosis and stability test.Compared to existing methods,the proposed model provides a more accurate measurement for taxiing performance with a high level of goodness of fit.It quanti fies the impact of various factors to taxiing inefficiency and supports decision-makers with reliable measurement to improve the operational performance.
Because of lack of data from European airports,we were not able to conduct a comparison between U.S.and EU airports in this study.We suggest the future ATM performance comparison between the U.S.and EU or maybe some other countries or regions could apply this proposed model to obtain the unimpeded taxiing time and then the taxiing delay.It is also possible to look into the detailed taxiing delay in terms of different time of day and day of week,or different groups to identify the severe taxiing delay scenarios and the major causal factors and explore possible countermeasures for future airport operations.
Acknowledgements
This research was supported by FAA ATO-G under contract DTFAWA-09-P-00245.The authors would like to thank Mr.John Gulding and Mr.Xing Chen from FAA for comments and suggestions and also for providing simulation software(ADSIM+).All opinions stated in this article are those of the authors and do not necessarily represent the opinion or position of the FAA.
Appendix A.U.S.methodology for nominal taxi times
This appendix describes the methodology used for the calculation of nominal(unimpeded)taxi times for the U.S.
(1)Start with a city pair flight with the data items of date(year,month,and day),departure and arrival airport,departure and arrival times(both scheduled and actual),and OOOI times(out,off,on,in).The season parameter is defined as winter(December,January,February),spring(March,AprilMay),summer(June,July,August),and fall(September,October,November).
(2)Split a flight into two parts:departure and arrival.
(3)Departure data include airport,carrier,season,actual gate-out time(entry time into a departure queue),and actual wheels-off time(exit time out of the departure queue).
(4)Arrival data include airport,carrier,season,actual wheels-off time(entry time into an arrival queue),and actual gate-in time(exit time out of the arrival queue).
(5)Set up a bin for each minute of a single day and count how many aircrafts(both departing and arriving)are ahead of the flight at the queue entry time for the departure and arrival queues separately.
(6)Compute for each group an upper quartile(75th percentile)and exclude the upper 25 percent from the estimation computation.This is done to prevent extremely large values from exerting excessive effects on the estimates.This is to estimate optimal taxi times,assuming there is no obstruction on the taxiways.
(7)Run a regression for each subgroup determined by the airport,air carrier,and season,separately for the departure and arrival queues.yo=axo+bxi+c,whereyois a taxi-out time andxoandxiare the number of aircraft taxing out and taxing in,respectively.aandbare regression coefficients witha?0 andb?0.
(8)Only adopt results for which both regression coefficients are positive(the more aircraft,the longer the taxi times).
(9)For the subgroups with non-positive regression coeff icients,do other things with boundary conditions set for the resulting coefficients to be positive.(SAS used has some regression or nonlinear model fitting procedures in which can be specified in the boundary conditions.)
(10)Finally,to obtain the unimpeded taxi-out times,set the number of the departing aircraft at 1 and the arriving aircraft at 0 in the regression equation for the departure queue,meaning that only one aircraft is moving.For the unimpeded taxi-in times,set the number of the arriving aircraft at 1 and the departing aircraft at 0 in the equation for the arrival queue.
(11)The other statistics are for information only as a reference to determine if the unimpeded times are reasonable.
Appendix B.European methodology for unimpeded taxi times
This appendix describes the methodology used by European performance review unit(PRU)for the calculation of the unimpeded taxi times in the taxi-out phase.
Step 1.Each departing flight is categorized according to:
(1)Stand type and location:The type of stand(nose in,etc.)and the location of the stand are likely to affect performance measurement.To account for similar characteristics,individual stands are grouped for the calculation of the unimpeded time described in step 2.As the information on stands is not available from the databases accessible to the PRU,this analysis parameter is subject to data availability from the airport communities.
(2)Departure runway:The inclusion of the departure runway enables stand–runway combinations and,hence,provides additional useful information for performance analyses.
(3)Congestion index:The allocation of a congestion index to each departing flight is important to remove congestion effects in the calculation of the unimpeded surface movement transit times.It is expressed by the number of departures of other aircraft between the time the departing flight went off-block and the actual take-off time of the flight.
Step 2.For each group(stand-runway combination,as available),an unimpeded reference transit time is calculated by taking the truncated mean(the average of all observations in the truncated 10th to 90th percentile set)transit time for all flights within the group with a congestion index below a de fined threshold(i.e.,4 flights or less).
Step 3.For each group(stand-runway combination,as available),the surface movement delay is calculated as the difference between the average transit time(of all flights in this group)and the unimpeded transit time for this group determined in the previous step.
Step 4.To get high-level results,the weighted average of all the individual surface movement delay groups is calculated in a final step.
Appendix C.Carriers in airline service quality performance system(ASQP)and aviation system performance metrics(ASPM)
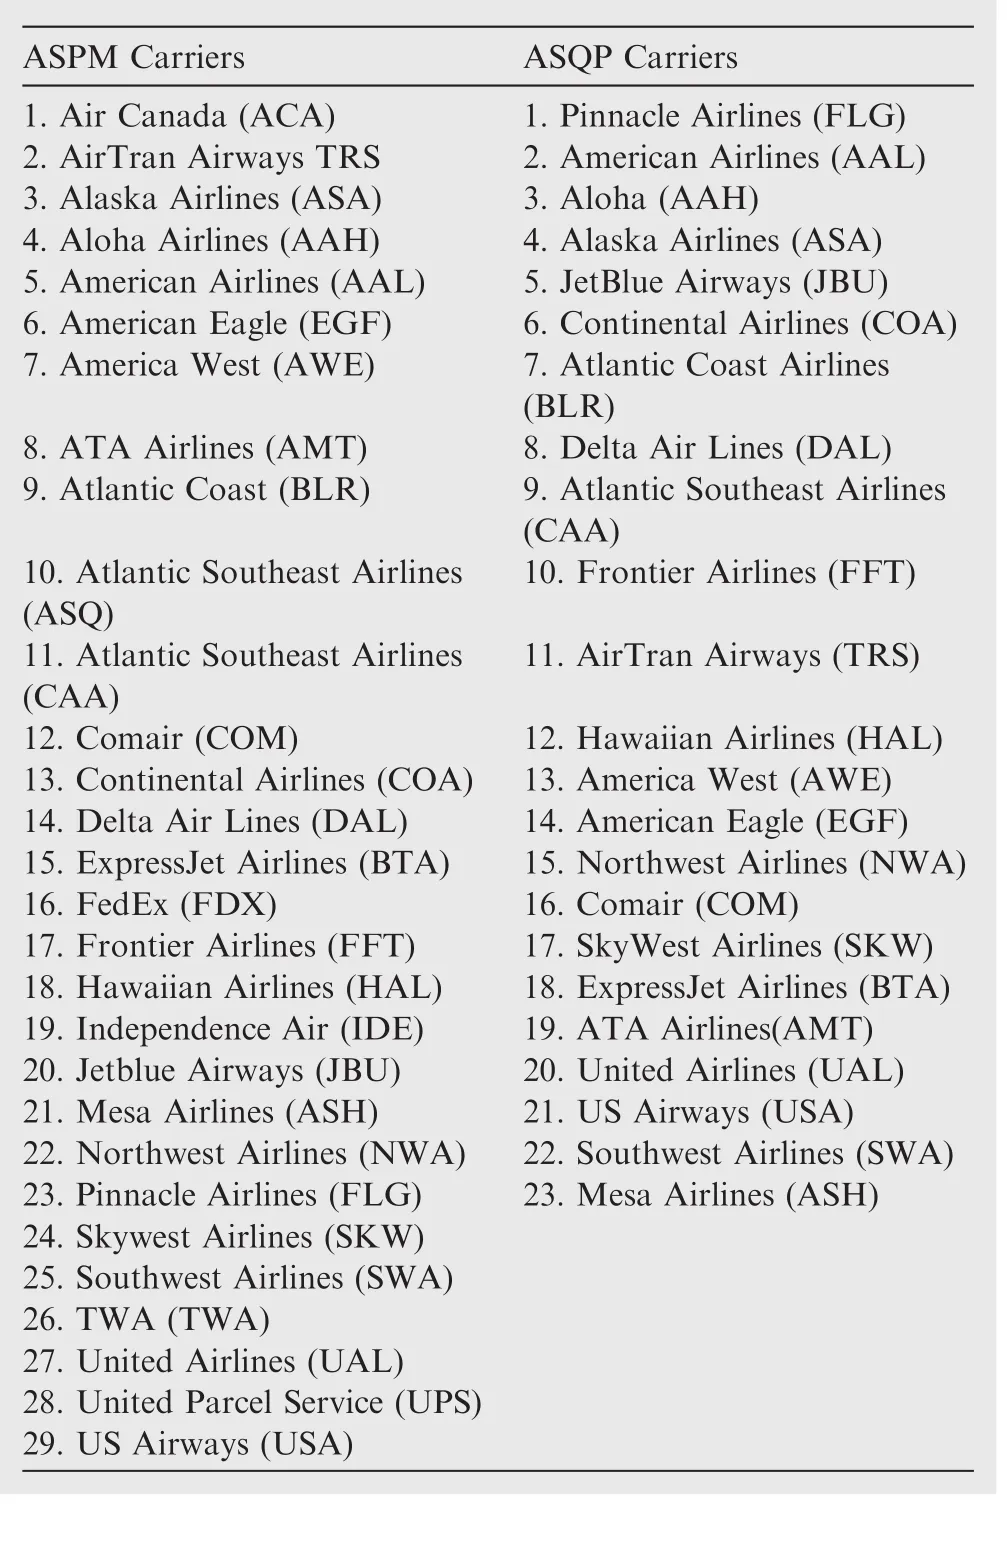
ASPM Carriers ASQP Carriers 1.Air Canada(ACA) 1.Pinnacle Airlines(FLG)2.AirTran Airways TRS 2.American Airlines(AAL)3.Alaska Airlines(ASA) 3.Aloha(AAH)4.Aloha Airlines(AAH) 4.Alaska Airlines(ASA)5.American Airlines(AAL) 5.JetBlue Airways(JBU)6.American Eagle(EGF) 6.Continental Airlines(COA)7.America West(AWE) 7.Atlantic Coast Airlines(BLR)8.ATA Airlines(AMT) 8.Delta Air Lines(DAL)9.Atlantic Coast(BLR) 9.Atlantic Southeast Airlines(CAA)10.Atlantic Southeast Airlines(ASQ)10.Frontier Airlines(FFT)11.Atlantic Southeast Airlines(CAA)11.AirTran Airways(TRS)12.Comair(COM) 12.Hawaiian Airlines(HAL)13.Continental Airlines(COA) 13.America West(AWE)14.Delta Air Lines(DAL) 14.American Eagle(EGF)15.ExpressJet Airlines(BTA) 15.Northwest Airlines(NWA)16.FedEx(FDX) 16.Comair(COM)17.Frontier Airlines(FFT) 17.SkyWest Airlines(SKW)18.Hawaiian Airlines(HAL) 18.ExpressJet Airlines(BTA)19.Independence Air(IDE) 19.ATA Airlines(AMT)20.Jetblue Airways(JBU) 20.United Airlines(UAL)21.Mesa Airlines(ASH) 21.US Airways(USA)22.Northwest Airlines(NWA) 22.Southwest Airlines(SWA)23.Pinnacle Airlines(FLG) 23.Mesa Airlines(ASH)24.Skywest Airlines(SKW)25.Southwest Airlines(SWA)26.TWA(TWA)27.United Airlines(UAL)28.United Parcel Service(UPS)29.US Airways(USA)
1.Zhang Y,Wang Q.Methods for determining airport unimpeded taxi times.Proceedings of transportation research board 90th annual meeting2011.p.1–19.
2.Performance Review Commission and FAA-ATO.2010 U.S./Europe comparison of ATM-related operational performance[Internet].2012[cited 2016 July 18]Available from:http://www.eurocontrol.int/sites/default/files/publication/files/us-eu-comparison-atm-related-ops-performance-final3-2010.pdf.
3.Kondo A.Derivation of unimpeded taxi times.Washington,D.C.:Federal Aviation Administration;2014.
4.ASPM system overview[Internet].Washington,D.C.:Federal Aviation Administration.2016[cited 2016 July 18]Available from: http://aspmhelp.faa.gov/index.php/ASPM_System_Overview.
5.Idris H,Clarke JP,Bhuva R,Kang L.Queuing model for taxi-out time estimation.Air Traffic Control Quarterly2002;10(1):1–22.
6.Volpe National Transportation Systems Center.ETMS,enhanced traffic management system,functional description.Cambridge(MA):U.S.Department of Transportation;2000.Report No.VNTSC-DTS56_TMS-002.
7.Shumsky RA.Dynamic and statistical models for the prediction of aircraft take-off times[dissertation].Cambridge(MA):Operations Research Center,MIT;1995.
8.Performance Review Commission and FAA-ATO.2012 U.S./Europe comparison of ATM-related operational performance[Internet].2013[cited 2016 July 18].Available from:http://www.eurocontrol.int/publications/2012-US-europe-comparison-airtraffic-management-related-operational-performance.
9.NOAA.Nationaloceanicand atmosphericadministration database[Internet].2016[cited 2016 July 18]New York:U.S.Department of Commerce.Available from:http://www.noaa.gov.
10.Liu Y,Hansen M,Gupta G,Malik W,Jung Y.Predictability impacts of airport surface automation.Transpor Res Part C:Emerging Technol2014;44(4):128–45.
11.Zhang Y,Wang Q.Applying regression models to benchmark airport taxiing performance indicators.Proceeding of 11th internationalconferenceofChinesetransportationprofessionals(ICCTP)2011.p.4287–97.
12.Wooldridge JM.Introductoryeconometrics:Amodern approach.Toronto:South-Western Pub;2009.
15 June 2016;revised 4 October 2016;accepted 14 December 2016
Available online 15 February 2017
*Corresponding author at:Civil and Environmental Engineering,University of South Florida,Tampa,fl33620,USA.
E-mail address:yuzhang@usf.edu(Y.Zhang).
Peer review under responsibility of Editorial Committee of CJA.
 CHINESE JOURNAL OF AERONAUTICS2017年2期
- CHINESE JOURNAL OF AERONAUTICS的其它文章
- Dynamics of air transport networks:A review from a complex systems perspective
- ATM performance measurement in Europe,the US and China
- Network analysis of Chinese air transport delay propagation
- Robustness analysis metrics for worldwide airport network:A comprehensive study
- Evolution of airports from a network perspective–An analytical concept
- A data-driven approach to modeling high-density terminal areas:A scenario analysis of the new Beijing,China airspace
