How much control causes tunneling?Evidence from China
Wenting Chen,Shnmin Li,Crystl Xioei Chen
aSchool of Accounting,Guangdong University of Foreign Studies,China
bSun Yat-sen Business School,Sun Yat-sen University,China
cHIT Shenzhen Graduate School,China
How much control causes tunneling?Evidence from China
Wenting Chena,Shanmin Lib,Crystal Xiaobei Chenc,*
aSchool of Accounting,Guangdong University of Foreign Studies,China
bSun Yat-sen Business School,Sun Yat-sen University,China
cHIT Shenzhen Graduate School,China
A R T I C L E I N F O
Tunneling Shareholding ratios Corporate control transfers Related party transactions
We study the dynamic causal effects of the shareholding ratio of controlling shareholder on tunneling behavior in China.We use control-right-transfers as the event to conduct the study.We obtain 394 control-right-transfer samples in China corporate control market from 2001 to 2008.We use related party transactions amount to capture control shareholders’tunneling activities,and make the following findings.Firstly,tunneling behavior is significantly affected by the shareholding ratio of controlling shareholder.Secondly,the relationship between tunneling and shareholding ratio of controlling shareholder takes an N shape(incline-decline-incline).There are at least two turning points in the relationship.Furthermore,firms with shareholding ratios of controlling shareholder that range from 34.46%to 39.01%(8.99–18.04%)exhibit the most(least)severe tunneling.Firm size is significantly positively related to tunneling activities.In addition,the shareholding ratios of the board and the tunneling activities are significantly negatively correlated.These findings imply the shareholding ratio decision of controlling shareholder in control transfers lead to agency problems manifested in China in a particular form of tunneling.
?2016 Sun Yat-sen University.Production and hosting by Elsevier B.V.This is an open access article under the CC BY-NC-ND license(http://creativecommons.org/licenses/by-nc-nd/4.0/).
1.Introduction
Ever since the tunneling behavior of controlling shareholders was first identified,it has been studied extensively.Companies with concentrated ownership structures1Over the past decade,studies have shown that corporate ownership structures are concentrated rather than dispersed in most countries,particularly those with weak investor protections(La Porta et al,1998,1999).typically have one controlling shareholder.2The controlling shareholder is either the shareholder that controls the company and owns 50%or more equity or the shareholder that owns less than 50%equity but dominates the company’s daily operations and decision-making and uses the company’s property by virtue of his superior position.Controlling shareholders can access benefits by either creating or transferring a company’s wealth.When creating wealth,controlling shareholders derive benefits from the general value enhancement that results from improved management,which is known as the alignment(incentive)effect.Conversely,when engaging in wealth transfers,controlling shareholders obtain private benefits by expropriating minority shareholder benefits,which is also known as the tunneling(entrenchment)effect(Shleifer and Vishny,1986;Johnson et al.,2000).It is generally believed that ownership structure affects controlling shareholders’tunneling and alignment decisions and that in turn,tunneling behavior affects firm value.
Most of the research on this topic examines the relationship between ownership structure and firm value,with the assumption that ownership structure(particularly with respect to the difference between control rights and cash-flow rights)affects the controlling shareholders’tunneling behavior,which affects firm value.The general findings in this direction support the inverted U-shaped(or concave)relationship between ownership structure and firm value(Morck et al.,1988;Stulz,1988;McConnell and Servaes,1990).In addition,some research finds that a disparity between control rights and cash-flow rights triggers tunneling activity,which decreases firm value(Lins,2003;Claessens et al.,2002).
Subsequent studies have investigated the relationship between tunneling and firm value and have arrived at results that are consistent with the conclusions discussed above.Tunneling activity and firm value are negatively correlated,and more severe tunneling activity leads to lower firm value(Jiang et al.,2010).
Thus far,no studies have examined the direct relationship between the shareholding ratio of controlling shareholder and tunneling.Although previous studies assume that certain ownership structures will trigger tunneling and eventually affect firm value,none of the previous research directly examines how the shareholding ratio of controlling shareholder affects tunneling.The theoretical models of Johnson et al.(2000)and LLSV(2002)imply that controlling shareholders’equity holdings affect their tunneling behavior,but there is no empirical evidence to support this theoretical conjecture.
In this paper,we aim to of fer a comprehensive study of the causal effects of the shareholding ratio of controlling shareholder on tunneling behavior in China;our primary purpose was to study the direct relationship between the shareholding ratio of controlling shareholder and tunneling activity.We use control-rightstransfer events to study the research question in the China corporate control market from 2001 to 2008.Theoretically,we modify and extend the theoretical models of Johnson et al.(2000)and LLSV(2002).We explicitly study the direct relationship between the shareholding ratio of controlling shareholder and tunneling.We then of f er empirical findings and analysis to verify our theoretical conjectures.
Our primary findings are as follows:(1)tunneling activities are likely to be a consequence of the controlled shareholding ratio,whereas the shareholding ratio of controlling shareholder is not significantly impacted by tunneling activities;(2)in addition to being a monotonic or quadratic function relation,the relationship between tunneling activities and the shareholding ratio of controlling shareholder is a cubic function relation,an ‘‘incline-decline-incline”trend(an N-shaped)relationship;and(3)firms with shareholding ratios of controlling shareholders in the 34.46–39.01%range have the most severe tunneling activities,whereas firms in the 8.99–18.04%range have the least tunneling activities.
We make five major contributions to the literature(Johnson et al.,2000;Bae et al.,2002;Bertrand et al.,2002;Baek et al.,2006;Urzu′a I,2009;Atanasov et al.,2010;Jiang et al.,2010;Siegel and Choudhury,2012;Buchuk et al.,2014,and Piotroski and Zhang,2014).First,we provide direct evidence of the relationship between the shareholding ratio of controlling shareholder and tunneling behavior.Second,we construct a theoretical model to depict the cubic function relation between the two variables.Third,we design a set of multiple regression models both to capture the relationship between the two variables and to test our theoretical conjecture.Fourth,we complement the current literature by conducting the study using control-righttransfer samples.Finally,we find that there are two turning points of the shareholding ratio of controlling shareholder that trigger more severe or less severe tunneling activities.
The remainder of the paper is structured as follows.Section 2 reviews the current literature,and Section 3 introduces the institutional background and data.Section 4 presents the theoretical model and the hypotheses.In section 5,we design a set of regression models to test the theoretical conjecture and the hypotheses.Section 6 contains the robustness test,and Section 7 concludes the paper.
2.Literature Review
Morck et al.(1988)first define the ‘‘entrenchment effect” as a decrease in the value of corporate assets when managed by a manager with high levels of control rights and low levels of cash-flow rights.La Porta et al.(2000)find that Czech markets have been plagued by massive expropriation from minority shareholders and introduce the concept of ‘‘tunneling” to describe the expropriation of assets from both firms and mutual funds by controlling shareholders.More specifically,La Porta et al.(2002)define ‘‘tunneling” as the activity of controlling shareholders who divert firm profits to themselves before distributing the remainder as dividends.Such diversion or tunneling can take the form of salaries,transfer pricing,subsidized personal loans,nonarm’s-length asset transactions and even outright theft.Researchers(La Porta et al.,2000,2002;Johnson et al.,2000)generally refer to tunneling activity as a situation in which controlling shareholders transfer a company’s property or profit counter to the interests of minority shareholders by virtue of their superior control positions.We adopt this latter definition.
The literature focuses on the relationship between the structure of ownership control and firm value(La Porta et al.,2000,2002;Claessens et al.,2002;Lemmon and Lins,2003;Of f enberg,2009;Jiang et al.,2010).Claessens et al.(2002)find that firm value increases when the controlling shareholder has commensurate cash flow ownership,which is,of course,consistent with a positive incentive effect.However,firm value decreases when the control rights of the controlling shareholder exceed its cash-flow ownership,which is consistent with the tunneling effect.Faccio and Lang(2002)and Lins(2003)report similar findings.Chan et al.(2003)suggest a non-monotonic function relation between the cash-flow ownership of the controlling shareholder and firm value.Morck et al.(1988)present an inverted U-shaped(Claessens et al.,2002)relationship between managerial control rights and firm value.Stulz(1988)depicts a concave relationship between managerial control rights and firm value,and McConnell and Servaes(1990)provide empirical support for such a concave relationship.Shleifer and Vishny(1997)suggest that when managerial control rights exceed a certain level,the controlling shareholders prefer to gain private benefits through tunneling;their findings also support the inverted U-shaped relationship between a controlling shareholder’s control right and firm value.The general findings on this topic are consistent with the inverted U-shaped or concave relationship between the managerial control right and firm value,which implies that a managerial control right is positively related to firm value before reaching a certain level,at which it becomes negative and tunneling begins.As discussed above,most current studies focus on the effects of a managerial control rights on firm value instead of the effects of the shareholding ratio of controlling shareholder on tunneling behavior.
Indeed,few studies directly examine the relationship between the controlled shareholding ratio and tunneling.It is generally believed that the relationship between tunneling and the shareholding ratio of controlling shareholder is not stable and may be affected either by time or by company operations(Xi and Yu,2006;Bai and Wu,2008).Johnson et al.(2000)deduce a theoretical model with implications for a concave relationship between the shareholding ratio of controlling shareholder and tunneling behavior;however,there is no empirical evidence to support this theoretical conjecture.In this paper,we consider transfers of control rights involving public Chinese companies as events and then study how a highly concentrated ownership structure and tunneling behavior influence one another.
We choose to use transfers of control rights through equity transfer agreements as our key events because when control rights are transferred,controlling shareholders will carefully reselect the shareholding ratio to maximize their private benefit(La Porta et al.,2002).The current controlling shareholder transfers control rights to the bidder that offers the largest ‘‘bribe” (including possibly illegal actions)instead of to the bidderwith the greatest ability to maximize performance(Bayne,1963;Jennings,1956).Thus,the controlling shareholder’s behavior would lead to unsuccessful acquisitions because of the controlling shareholder’s greed in attempting to maximize private benefits when transferring control rights(Kahan,1993;Bebchuk,1994).Bae et al.(2002)show that controlling shareholder blocs’acquisition prices are established to enhance those blocs’value,to the detriment of minority shareholders.Prior studies also show that controlling shareholders’incentives to obtain the private benefits of control are closely related to the proportion of ownership held during the period of a control rights transfer and therefore,they have a significant influence on firm value after that transfer(La Porta et al.,2002;Bayne,1963;Jennings,1956;Kahan,1993;Bebchuk,1994).Thus,the transfer of control rights is a major event through which controlling shareholders can pursue tunneling.

Table 1 Ownership structure of public companies in China from 2001 to 2008.Data source:China Stock Market Accounting Research(CSMAR).
3.Institutional background and data
3.1.Institutional background
As an emerging financial market,China has highly concentrated firm ownership and lacks a comprehensive legal system to protect the interests of minority investors(Aharony et al.,2000;Allen et al.,2005;Fan et al.,2007;Jiang et al.,2010;Berkowitz et al.,2015).More specifically,regulators in China have a long tradition of protecting state interests and little experience with litigation driven by private plaintiffs(Allen et al.,2005;MacNeil,2002).As a rapidly developing transitional economy,China is an excellent laboratory in which to study the direct relationships between the controlling shareholders’tunneling behavior and firm value.
A special feature of China’s corporate control market consists of state-owned enterprises(SOEs).Green(2003)reports that the Chinese stock market was organized by the government as a vehicle for SOEs to raise capital and improve their operating performance.To make this vehicle effective,the state aimed to retain sufficient equity interests to control public firms.Thus,the ownership of public Chinese companies is heavily concentrated in the hands of the state.As shown in Table 1,from 2001 to 2008,the ownership structure of public companies changed from 81%state-owned shares,15%legal person shares and 4% private shares to 58% stateowned shares,35%legal person shares and 7%private shares.The ratio of shares owned by the state is decreasing.But the sum of shares owned by both the state and legal person still accounts for a significant share(more than 90%)of the ownership structure.
Table 2 shows the development of China’s corporate control market from 2001 to 2008 using our sample.During our sample period,China’s corporate control market grew rapidly.From 2001 to 2008,the number of transfers of corporate control increased from 30 to 134,with the highest number(134)in 2008.In addition,in July 2005,the Chinese government announced a policy to convert non-tradable shares3Non-tradable shares refer to block shares(state-owned shares and legal person shares)that could not be traded in the market before 2005(Jiang et al.(2010)).into tradable shares.This ‘‘Share Segregation Reform” policy aimed to achieve a balance among the interests of non-tradable shareholders and tradable shareholders through a consultative mechanism and therefore to eliminate differences in the share transfer system in the A-share market.Generally,non-tradable shareholders of listed companies had to pay a certain consideration(compensation)to holders of tradable shares(typically minority shareholders)to secure the liquidity rights of their share blocs.As of October 30,2006,the capitalization of reformed companies comprised more than 94%of the total Shanghai and Shenzhen stock markets.The policy had been completely implemented by the end of 2007.Thus,the market began to bloom in 2005 and reached its zenith in 2008.

Table 2 China’s corporate control market development from 2001 to 2008.Data source:CSMAR.

Table 3 The tunneling activity of public companies from 2001 to 2008.This table presents the tunneling activity of public companies of China from 2001 to 2008.We use Ln(RPT)to measure tunneling severity.The higher the RPT,the more sever the tunneling.Data source:CSMAR.
In China,tunneling by controlling shareholders is commonly observed(Tang and Wei,2002;Li et al.,2004;Wang and Zhang,2004).Unlike most developed markets,China’s controlling-shareholder activity is much more consistent with the tunneling effect than with the alignment effect because of China’s immature market for corporate control and its imperfect legal system and because the ownership structures of public Chinese companies are heavily concentrated in the hands of the state(70%on average)(Green,2003),as discussed above.Thus,the influence of a highly concentrated ownership structure on tunneling behavior is an important topic to investigate both to improve the level of investor protection and to develop an appropriate regulatory framework.
Our primary measure of tunneling is the related party transactions(RPT)amount.Previous studies suggest that related party transactions are popular means of tunneling(Bae et al.,2002;Joh,2003;Baek et al.,2006;Cheung et al.,2006,2010;Jiang et al.,2010).Liu and Lu(2007)indicate that tunneling behavior in China primarily occurs in the form of loans from controlled companies to majority shareholders,in addition to other types of related-party transactions.Peng et al.(2011)also find that related-party transactions were used to effect tunneling activities in China from 1998 to 2004.
As noted previously,over the past decade,tunneling has been commonly observed in China.Table 3 shows public Chinese companies’tunneling activities from 2001 to 2008.
Tunneling activities were widespread from 2001 to 2008;the highest Ln(RPT)value reached 19.78 in 2008.In 2007,the China Securities Regulatory Commission amended the ‘‘Administration of the Takeover of Listed Companies Procedures”and revised the regulation of public company acquisition according to its newly revised ‘‘Securities Law” to improve the efficiency of the country’s capital markets.
In another study,Gao and Kling(2008)analyze the tunneling data for public Chinese firms from 1998 to 2002 and find that improvements in corporate governance have prevented operational tunneling.However,Li(2010)studies the tunneling effect from 2002 to 2007 and finds that privately controlled public companies engage in more tunneling despite having better corporate governance.
3.2.Data description and preliminary analysis
We select sample companies that have had control rights transferred through equity transfer agreements from January 2001 to December 2008.We search for the name and ownership of each of the top ten shareholders disclosed in the CSMAR Database.4Website:http://www.gtadata.com/.Next,we collected the financial data and corporate governance data obtained from the CSMAR Database,including ‘‘The Mergers and Acquisitions of Public Companies in China Database,” ‘‘China’s Corporate Governance Structure Database”and ‘‘Shareholders of China’s Public Companies Research Database”.Stata 14 software is used as for processing the data.
Our data selection criteria are as follows:
(1)We select public companies that witnessed their controlling shareholder change during the sample period.
(2)For companies that were the subject of two or more control rights transfers in a three-year period,we select only the last event as a sample event to exclude the stack effect.
(3)To avoid a situation in which the company’s actual controlling shareholder did not change,we eliminate companies in which control-rights transfers occurred between a parent company and either a subsidiary company or an affiliated(sister)company.
(4)We eliminate financial companies from our analysis.
(5)We eliminate companies for whom the transactions have not been completed or were terminated.
(6)We eliminate companies that had transactions that were free of charge.
(7)We eliminate companies that have individual data missing and/or that have abnormal extremes.
We obtain 394 control-rights-transfer samples during the study period.
Table 4 reports descriptive statistics for the sample companies in the sample period.
Table 4 shows that public companies with control transfers had an average non-negative cumulative abnormal return(‘‘CAR”)of 0.0088,which indicates that on average,the reaction of the market to control transfers was positive during the sample period.The mean RPT value,the average tunneling activity value is 19.0122,which indicates that our sample firms exhibited noticeable tunneling activity during the sample period.The average shareholding ratio of controlling shareholder(HLD)is approximately 0.3541,and the average board size is greater than 9.The average return on assets(ROA)is 0.0452.The average debt ratio is 0.5224.The average firm size is 21.2559.It is notable that most firms have substantial RPT on their balance sheets.
To examine the dynamic relationship between the shareholding ratio of controlling shareholder and tunneling behavior,we divide the sample into 10 deciles based on the shareholding ratio of controlling shareholder during the pre-event period(T-1),and we compute Ln(RPT)at time T(the event year).The results are reported in Table 5.
Table 5 reports the RPT values of the 10 controlled shareholding deciles for the control transfer samples.Decile 6 has the highest RPT values,whereas decile 1 has the lowest RPT values,which indicate that firms with shareholding ratio of controlling shareholders in the 34.46–39.01%range have the most severe tunneling activity,whereas firms in the 8.99–18.04%range have the least tunneling activity.Tunneling increases first and then decreases as the shareholding ratio of controlling shareholder increases until the 9th decile,at which point tunneling increases again,which clearly indicates that the relationship between the shareholding ratio of controlling shareholder and tunneling activity is not simply monotonic.
Prior research reports not only that there is an inverted U-shaped relationship between firm value and the shareholding ratio of the controlling shareholder(Claessens et al.,2002;Li et al.,2004)but also that the change in firm value is caused by tunneling behavior;however,there is no clear evidence of how tunneling behaviors change with the shareholding ratio of controlling shareholder.From the above findings,we can infer not only that the shareholding ratio of controlling shareholder and tunneling activities are not related in a monotonic or quadratic function relation but also that there is more than one turning point in the trend.

Table 4 Descriptive statistics.Ln(RPT)is to measure tunneling severity.Other firm characteristics are as follows:(1)HLD represents the shareholding ratio of the controlling shareholder;(2)ROA is the return on total assets and measures the overall operation performance;(3)LEV is the asset-liability ratio and represents the financial risks of the company;(4)SIZE is the logarithm of the firm’s total assets and represents firm size;(5)Boardsize is the size of the board of directors,and different board sizes have different balancing abilities with respect to the activity of the controlling shareholder;(6)Boardhold is the shareholding ratio of the board of directors;(7)CAR is the cumulative abnormal return measured with a value-weighted market model estimated over the period[-42,126].All variables are averaged across the period and across firms.All observations are processed by excluding singular values(we winsorize all continuous variables,except the dummy variables,at the 1st and 99th percentiles).
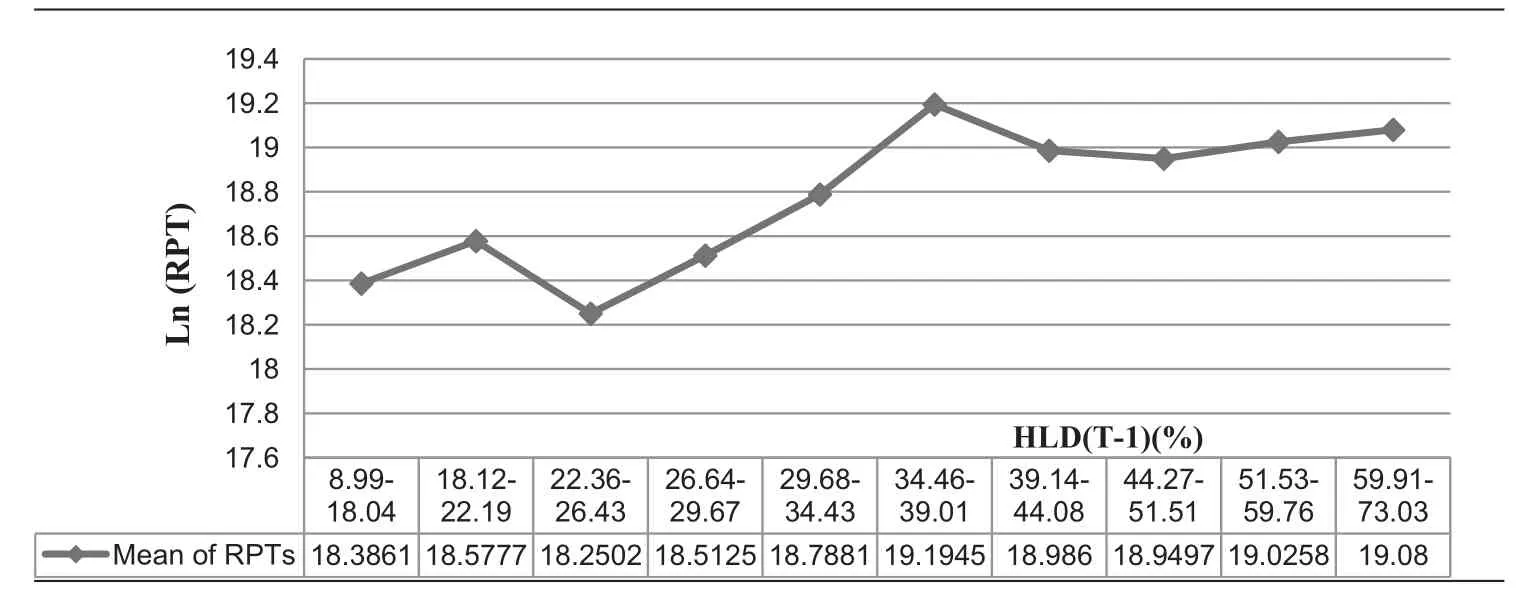
Table 5 The tunneling behavior under different ranges of shareholding ratio of controlling shareholder.The sample is divided into 10 deciles based on the shareholding ratio of controlling shareholder in the preevent period(T-1),and the RPT are computed at time T(the event year)for the Transfer samples.
Therefore,we should employ a more comprehensive design to study the effect of the interaction between these two variables.
4.Theoretical model and hypotheses
Johnson et al.(2000)and LLSV(2002)establish a basic theoretical framework for tunneling behavior.
We extend the models of Johnson et al.(2000)and LLSV(2002)to control rights transfer events.Specifically,in one extension,we divide the entire sample into two subsets—Good Transfers and Bad Transfers—and study the direct relationship between the two variables in these two sub-samples.We consider this extension to be one of the contributions of this study.
Assumptions:
(1)The controlling shareholder owns share α of the firm,and outsiders own share(1- α).
(2)The total assets of the target firm are denoted by TA,and the CARs related to the control transfer are denoted by R.
(3)The controlling shareholder usurps s of the total assets(TA)of the target in the control transfer.
(4)The cost of tunneling(usurping s)isand a higher value of k represents either weaker corporate governance regulation,a weaker legal system or both(i.e.,it is less costly to usurp assets from the target).
(5)The cost of tunneling is greater than zero but less than the total stealing amount to trigger tunneling;that is,which implies that 0
The controlled optimization problem may be written as follows:

differentiating Eq.(1)with respect to α yields the following:

When the CARs of control transfers are greater than zero(R>0),we obtain the following:
(Rs-R*TA)< 0 because s< TA and R>0
when α is small,0≤ s≤ k,s/k ≤ 1,we obtain the following:
when α is large,k<s≤2k,1<s/k≤2,we obtain the following:
Therefore,our first hypothesis is as follows:
H1.The relationship between the tunneling behavior and the shareholding ratio of controlling shareholder exhibits a ‘‘decline-incline” trend,which resembles a U shape graphically(see Fig.1).
As discussed above,corporate governance laws and mechanisms are underdeveloped in China.If corporate governance rules were more developed,the tunneling behavior of controlling shareholders would be punished.The cost of tunneling decreases sharply when controlling shareholders own most of the shares of the target.In this instance,we define the cost of tunneling as follows:
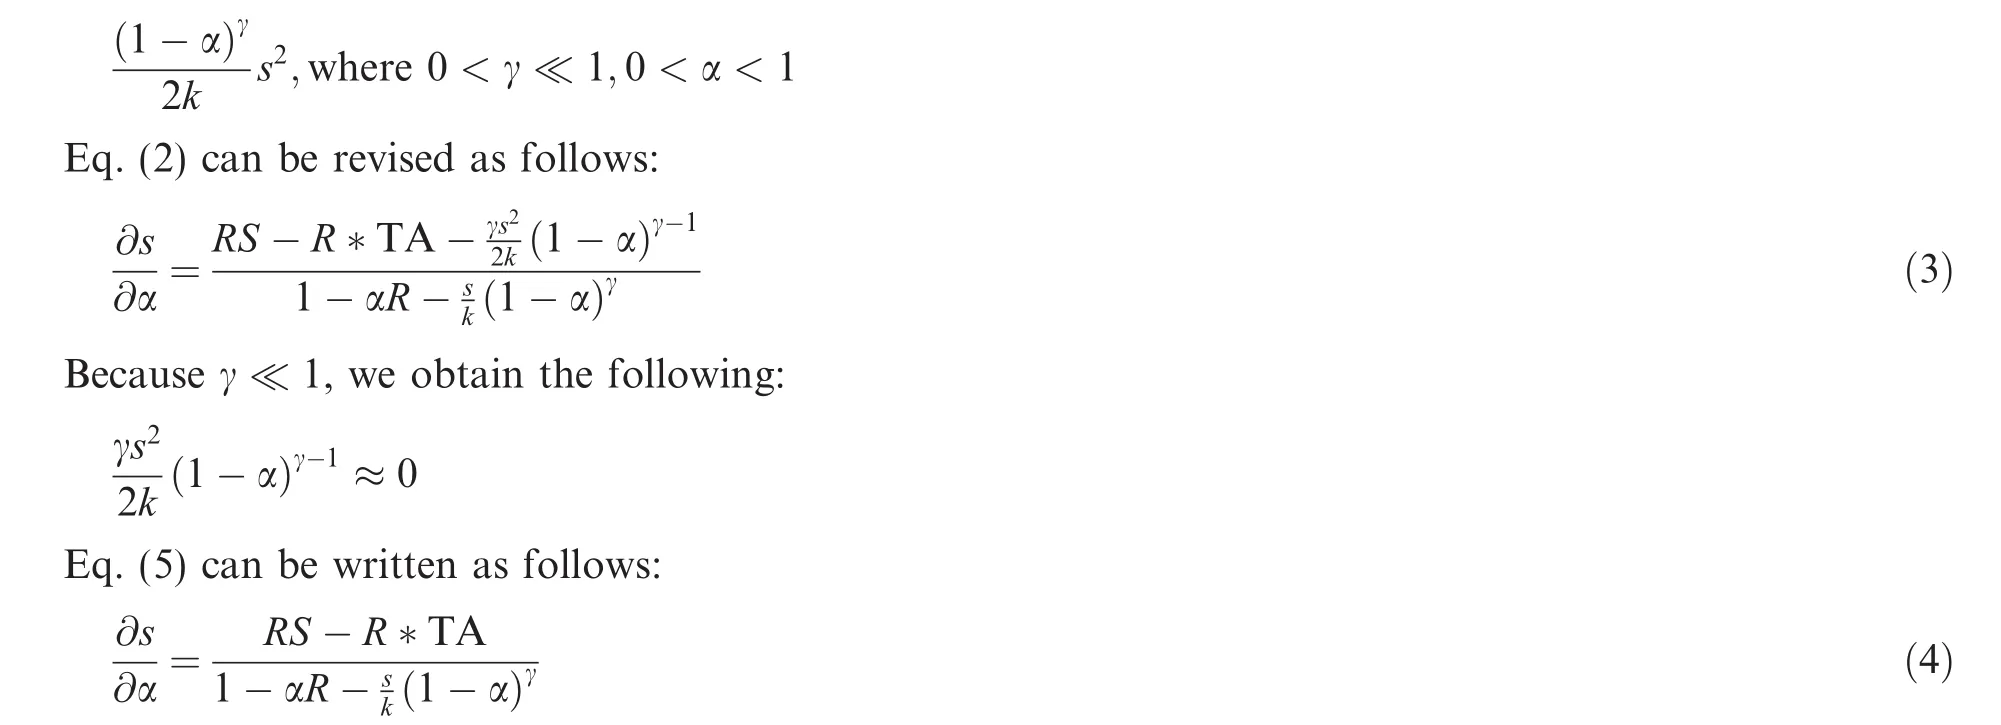
When the CARs of a control transfer are less than zero(R<0),we obtain the following:
which implies that Eq.(4)is greater than zero,or> 0.
Thus,we present another important hypothesis:
H2.Given that controlling shareholders in China control more than 80%of the shares of firms on average,the relationship between the tunneling and the shareholding ratio of controlling shareholder exhibits an‘‘incline-decline-incline” trend,which resembles an N-shape graphically(see Fig.2).
Our theoretical conjectures above extend the findings of previous studies and offer a more complete picture of the relationship between the shareholding ratio of controlling shareholder and tunneling behavior.
To test the validity of our theoretical conjectures,we use control-rights-transfer events of publically listed Chinese companies as the setting in which to empirically test the relationship between the shareholding structure and tunneling activities empirically.
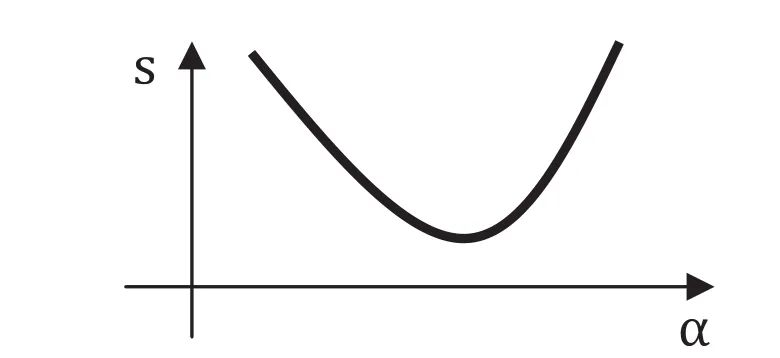
Figure 1.The quadratic function relation between the shareholding ratios of controlling shareholders and the tunneling activities.
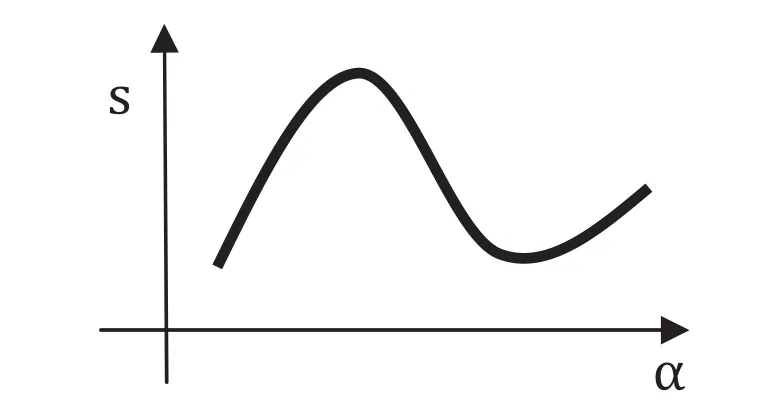
Figure 2.The cubic function relation between the shareholding ratios of controlling shareholders and the tunneling activities.
5.Model specification and empirical results
The findings above indicate that tunneling activity is significantly affected by the shareholding ratio of controlling shareholder and that the relationship between tunneling activity and shareholding ratios is not simply monotonic or quadratic.
We borrow the method of La Porta et al.(1998)and construct a multivariate analysis model to examine the dynamic relationship.Our primary proxy for tunneling is RPT amount.5Previous studies show that it is difficult to measure tunneling accurately.The proxies for tunneling are according to either the value implications or the RPT.We also use other tunneling proxies(PBC)for robust tests.The data source for RPT is the CSMAR database.CSMAR database provides deallevel information on RPT for all A-share listed firms in China since 1997.For each transaction,CSMAR database provides information about the type of transaction,the relationship between the listed firm and its counter party,and the amount of money involved in the transaction.We include only RPT in which a listed firm experienced a control transfer and the information on the amount is provided.
Jiang et al.(2010)and Li et al.(2004)indicate that the factors affecting tunneling behavior include the size of a company’s board of directors,the ratio of independent directors and other corporate governance characteristics.Therefore,we use governance characteristics as control variables to differentiate the effects of a company’s governance characteristics on tunneling from other factors.
Based on our preliminary data analysis in Section 3 and theoretical conjecture in Section 4,we design Model 1 to tests the monotonic function relation.
Model 1:

where:
Ln(RPT)is a measure of the level of tunneling severity of the controlling shareholder;
HLD represents the shareholding ratio of the controlling shareholder;
ROA is return on total assets and measures the overall operational performance of the company;
LEV is the asset-liability ratio and represents the financial risk of the company;
SIZE is the logarithm of the firm’s total assets and indicates firm size;
Boardsize is the size of the board of directors;different board sizes have different balancing capabilities rel
ative to the activity of the controlling shareholder;
Boardhold is the shareholding ratio of the board of directors;
Indbsize represents the ratio of independent directors on the board of directors;
Ceoduality represents whether the posts of general manager and chairman of the board of public companies
are held by the same person,where 1 represents the general manager and chairman of the board being the
same person and 0 represents the general manager and chairman of the board being separate individuals;
Normal represents whether the public company has a normal trading status,where 1 represents the com
pany with a normal trading status and 0 represents non-normal trading status;
State represents the actual type of the company’s controlling shareholder,where 1 represents a state-owned holding and 0 represents a holding that is not state-controlled;
Mindex refers to the area’s degree of marketization—which will affect the level of corporate governance—in which we use the market index(1997–2007)created by Fan et al.(2009),with 2008 following the index of 2007;and
Industry is an industry dummy variable,and according to the industry classification standard of the China Securities Regulatory Commission(2001),we set 21 dummy variables(excluding the financial industry,the manufacturing industry classified by the second category,and other industries classified by the main category standard).
Model 1 tests the monotonic function relation between the two variables that can be inferred from previous studies.If β1is significant and negative,the shareholding ratio of controlling shareholder negatively influences tunneling activity.If β1is significant and positive,the shareholding ratio of controlling shareholder positively affects tunneling activity.
Next,we add the square of the shareholding ratio of the controlling shareholder(HLD2)to the Model for testing the quadratic function relation.It is our second model.
Model 2:

HLD2represents the square of the shareholding ratio of the controlling shareholder.
The other control variables are the same as in Model 1;Model 2 is the second stage for testing the quadratic function relation between tunneling and the shareholding ratio of controlling shareholder.
If,for the control transfer sample,the coefficient of HLD2is significantly positive,and there is a U-shaped relation between tunneling and the shareholding ratio of the controlling shareholder.Thus,we can confirm H1.
Finally,we add the cube of the shareholding ratio(HLD3)to the Model for testing the cubic function relation.It is our last model.
Model 3:
HLD3represents the cube of the shareholding ratio of the controlling shareholder.
All other variables are defined as in Models 1 and 2.
Model 3 is designed to test the cubic function relation between tunneling and the shareholding ratio of the controlling shareholder.If,for our control transfer sample,the coefficient of HLD3is significantly positive,there will be an N-shaped relation,and we can thus confirm H2.
Table 6 presents the results of Multiple regression analysis of the shareholding ratio and the tunneling of controlling shareholders.For Model 1,the coefficient of HLD is significantly positive.It indicates that tunneling activity and shareholding ratio of controlling shareholder are positively correlated,and bigger shareholding ratio of controlling shareholder leads to more severe tunneling activities.For Model 2,the coefficient of HLD2is significantly positive.This result confirms H1 of our theoretical conjecture,which posits that the quadratic relationship between the shareholding ratio of controlling shareholder and tunneling is a U shape.For Model 3,the coefficient of HLD3is significantly positive.This result indicates that the cubic function relation between the shareholding ratio of controlling shareholder and tunneling is an N shape(inclinedecline-incline),which confirms H2 of our theoretical conjecture.The coefficients of Size are significantly positive in all three Models.It means the bigger the company,the more tunneling activities.The leverage(LEV)and the ratio of independent directors(Indbsize)are positively related to tunneling behavior of control shareholders,while the shareholding ratio of the board and the tunneling activities are significantly negatively correlated.It shows that the more shares the board holds,the less tunneling activities happen.
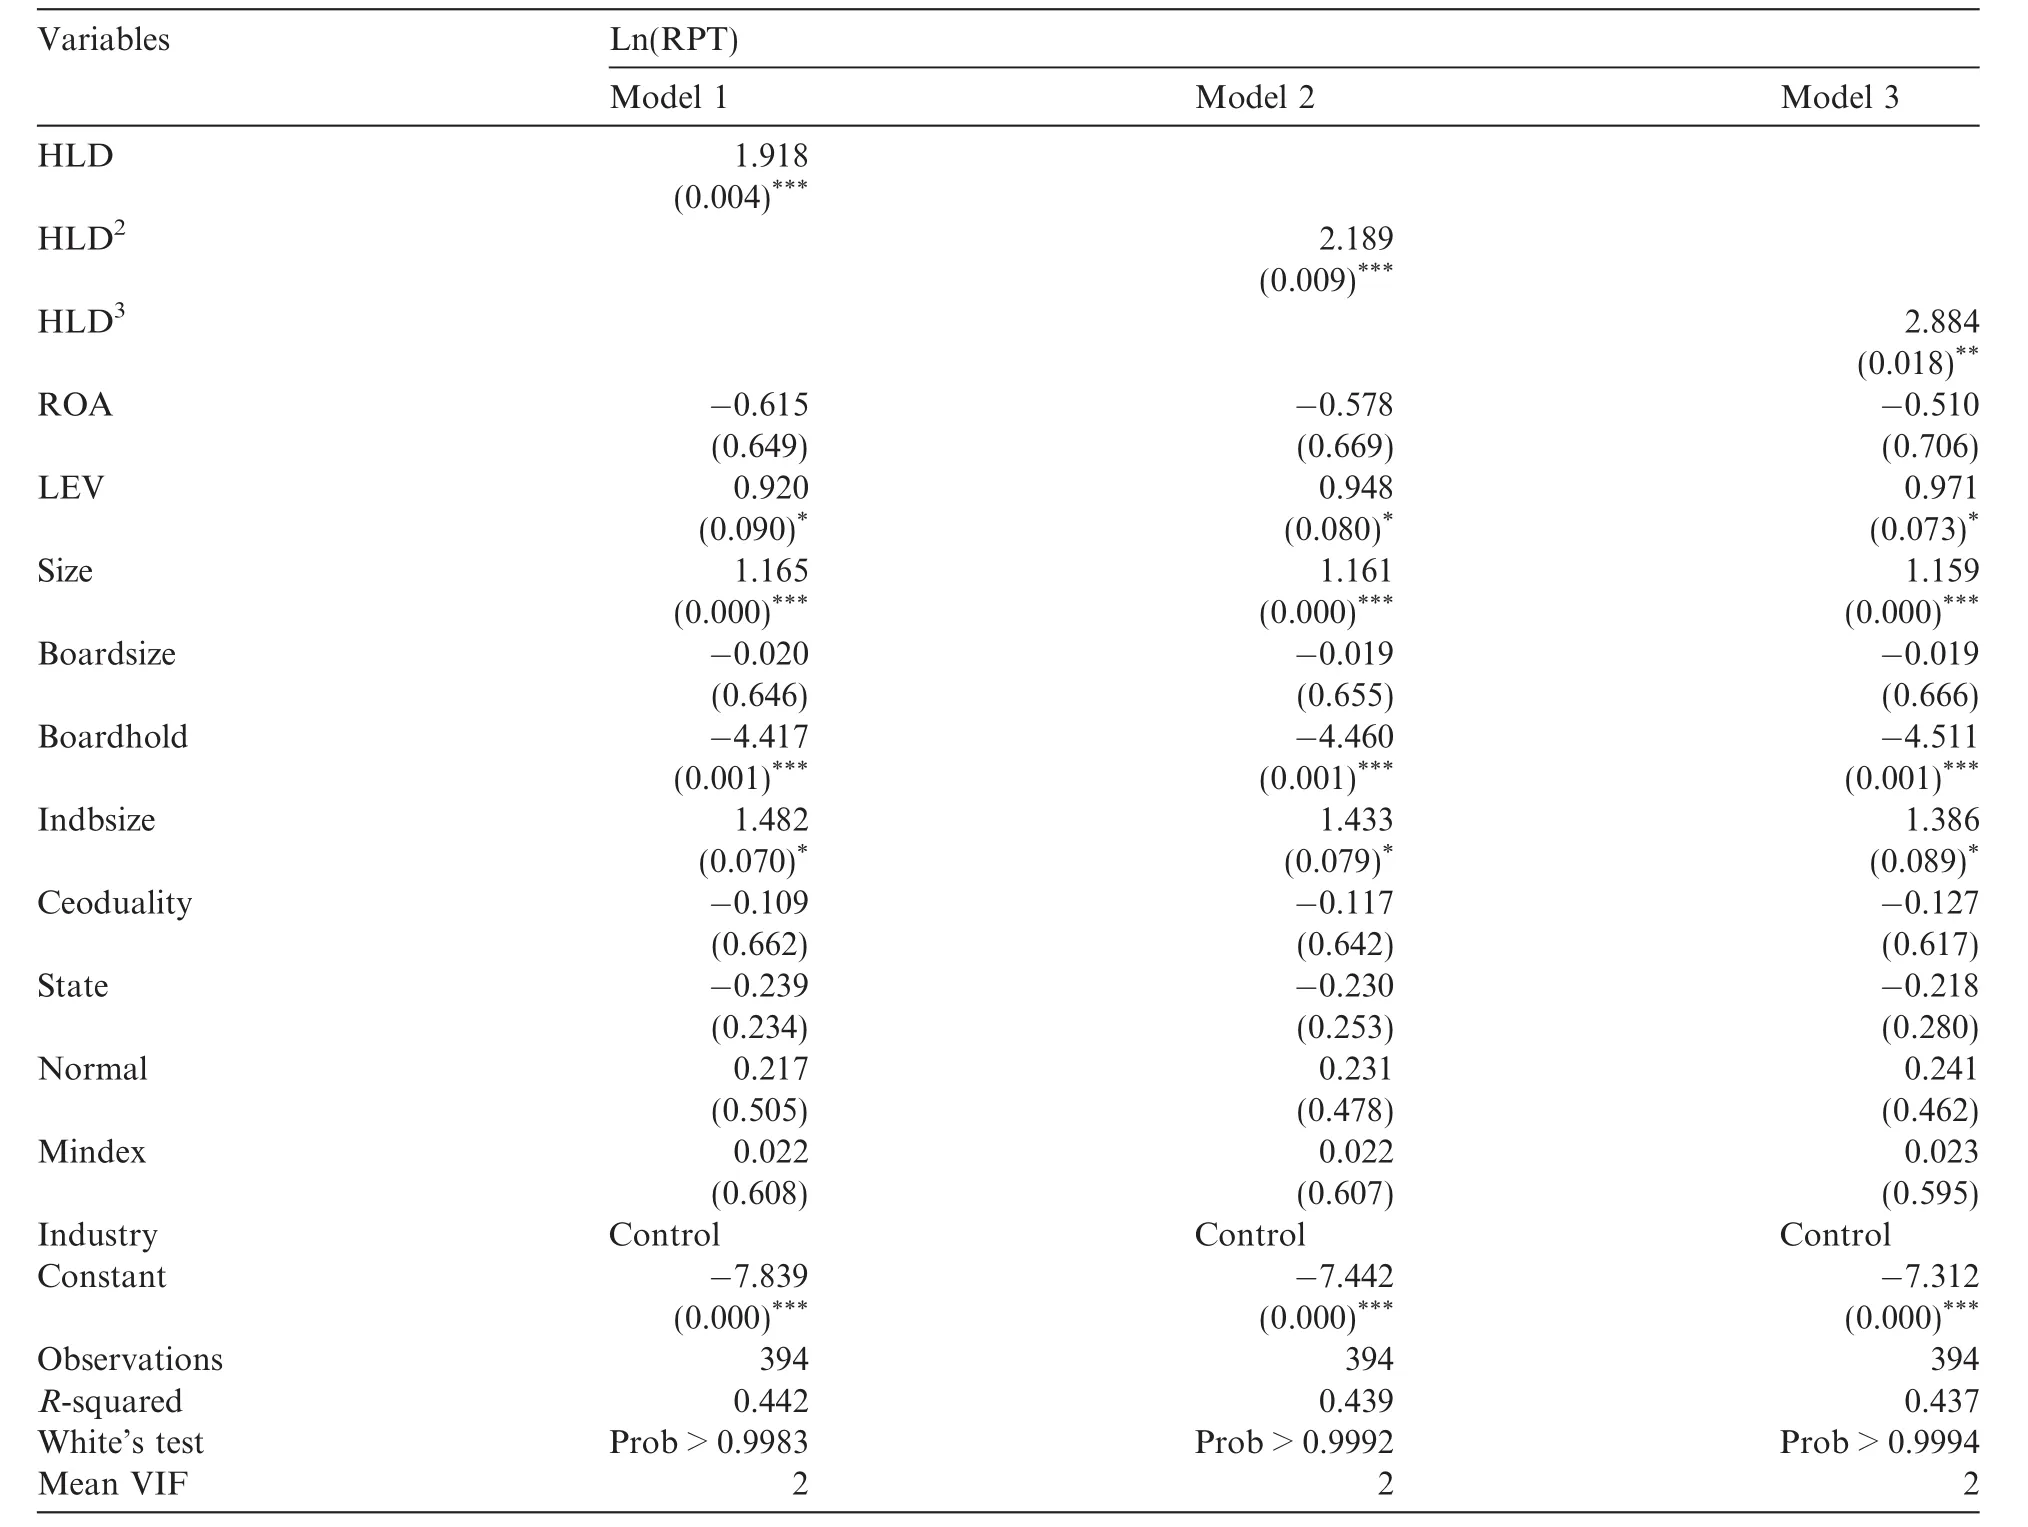
Table 6 Multiple regression analysis of the relationship between shareholding ratio and tunneling of controlling shareholders.Model 1 tests the monotonic function relation between the two variables.Model 2 tests H1,the quadratic function relation between the two variables.Model 3 tests H2,the cubic function relation between the two variables.RPT is a measure of the level of tunneling severity of the controlling shareholder;HLD represents the shareholding ratio of the controlling shareholder;ROA is return on total assets and measures the overall operational performance of the company;LEV is the asset-liability ratio and represents the financial risk of the company;SIZE is the logarithm of the firm’s total assets and indicates firm size;Boardsize is the size of the board of directors;different board sizes have different balancing capabilities relative to the activity of the controlling shareholder;Boardhold is the shareholding ratio of the board of directors;Indbsize represents the ratio of independent directors on the board of directors;Ceoduality represents whether the posts of general manager and chairman of the board of public companies are held by the same person,where 1 represents the general manager and chairman of the board being the same person and 0 represents the general manager and chairman of the board being separate individuals;Normal represents whether the public company has a normal trading status,where 1 represents the company with a normal trading status and 0 represents non-normal trading status;State represents the actual type of the company’s controlling shareholder,where 1 represents a state-owned holding and 0 represents a holding that is not state-controlled;Mindex refers to the area’s degree of marketization—which will affect the level of corporate governance—in which we use the market index(1997–2007)created by Fan(2009),with 2008 following the index of 2007;and Industry is an industry dummy variable,and according to the industry classification standard of the China Securities Regulatory Commission(2001),we set 21 dummy variables(excluding the financial industry,the manufacturing industry classified by the second category,and other industries classified by the main category standard).HLD2represents the square of the shareholding ratio of the controlling shareholder;HLD3represents the cube of the shareholding ratio of the controlling shareholder.

Table 7 Hausman specification test.
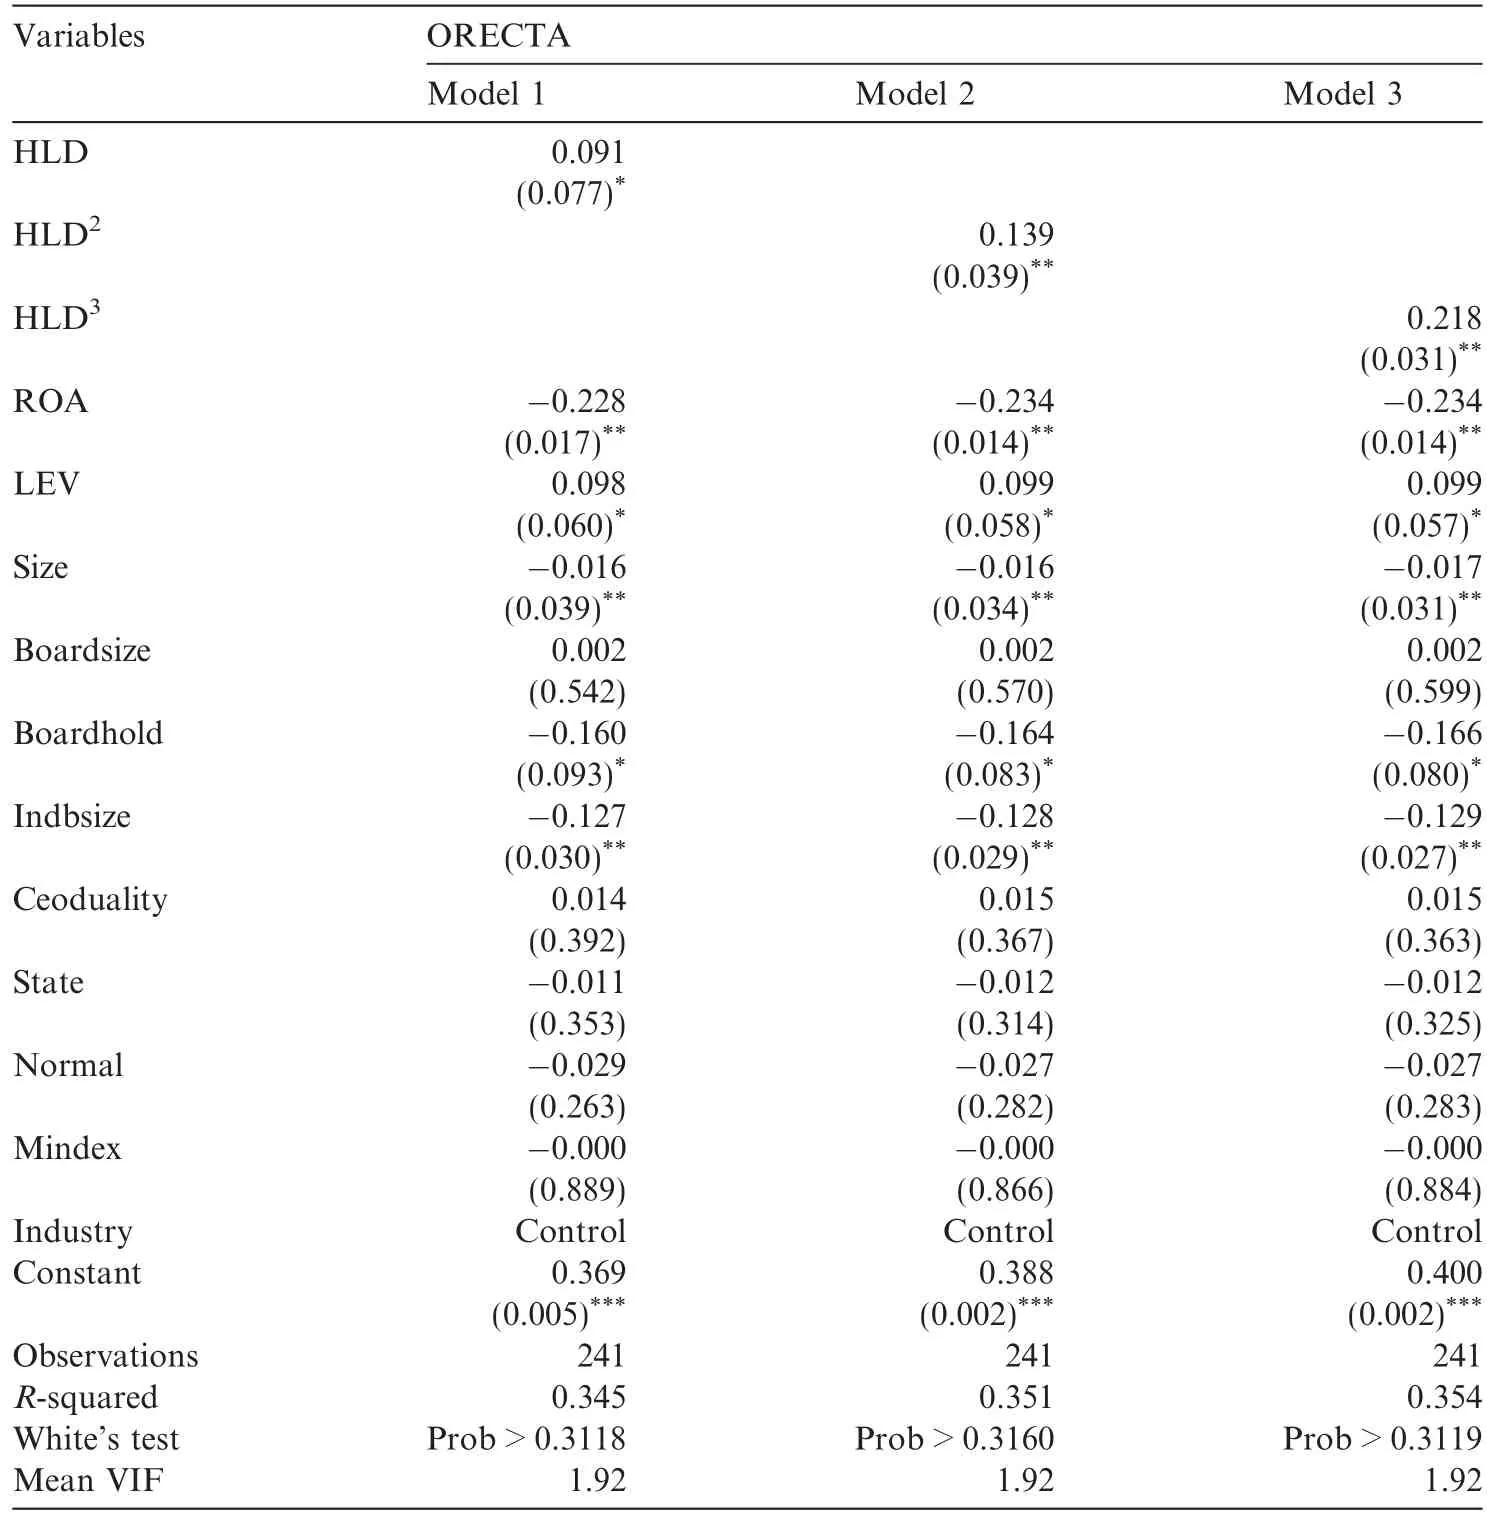
Table 8 Robustness test.This table reports re-estimation results for the relationship between shareholding ratio and tunneling of controlling shareholders with an alternative proxy of tunneling.
6.Robustness
6.1.Endogeneity
Because there is no heteroskedasticity in the models reported in Table 6,we use a Hausman specification test to find any endogenous variables in the 2SLS model.Table 7 indicates that all the variables in Model 3 are exogenous.
6.2.Alternative measures of tunneling
We use another tunneling measurement,other receivables over total assets(ORECTA)as a measure of tunneling activity.According to Jiang et al.(2010),controlling shareholders used inter-corporate loans to siphon billions of RMB from hundreds of Chinese public companies during the 1996–2006 period,and a substantial portion of these loans(between 30%and 40%of total OREC6In their study,Jiang et al.(2010)indicate that tens of billions in renminbi(RMB)have been siphoned from hundreds of Chinese firms by controlling shareholders.Typically reported as part of ‘‘other receivables” (OREC),these loans are found on the balance sheets of a majority of Chinese firms and collectively represent a large portion of the assets and market values of such firms.This situation has been referred to as the OREC problem.in the top three deciles)were made for the benefit of controlling shareholders and/or their affiliates.Thus,inter-corporate lending is a major method of tunneling.
We re-estimate the three Models using ORECTA as the tunneling proxy.Table 8 reports that the relationship between shareholding ratio and tunneling of controlling shareholders is an N shape(incline-declineincline),which confirms our conclusion.
7.Conclusion
In this paper,we present a theoretical conjecture depicting the causal effects of the shareholding ratio of controlling shareholder on tunneling activity in control transfers.We test the theoretical conjectures using data for 394 control rights transfer samples from 2001 to 2008.We use related party transactions amount to capture control shareholders’tunneling activities.
The results confirm the theoretical predictions and show that shareholding ratio of controlling shareholder has a significant effect on tunneling behavior,although the impact paths are different from the previous studies.The effect reveals a cubic function(an N shape)relationship.Furthermore,firms with shareholding ratio of controlling shareholders that range from 34.46%to 39.01%(8.99–18.04%)exhibit the most(least)severe tunneling.Firm size is significantly positively related to tunneling activities.In addition the shareholding ratio of the board and the tunneling activities are significantly negatively correlated.These findings imply the shareholding ratio decision of controlling shareholder in control transfers leads to agency problems manifested in China in a particular form of tunneling.The overall findings also expand the understanding of tunneling behavior in a transitional economy,and suggest a market-based governance mechanism to protect minority shareholders from expropriation.
Acknowledgments
The authors acknowledge financial support from the National Natural Science Foundation of China(NSFC Nos.71372149,and 71402034),the philosophy and social sciences major issue research projects of the Ministry of Education of China(Grant No.8151027501000039).The authors are especially grateful to Prof.Roni Michaely,for his comments in the academic seminar held by Sun Yat-sen Business School.The authors also thank Prof.Xue Wang from Ohio State University for her meaningful discussion in 2016 CAPANA/CJAR conference.
Aharony,J.,Lee,C.,Wong,T.,2000.Financial packaging of IPO firms in China.J.Account.Res.38,103–126.
Allen,F.,Qian,J.,Qian,M.J.,2005.Law,finance,and economic growth in China.J.Financ.Econ.77(1),57–116.
Atanasov,V.,Black,B.,Ciccotello,C.,Gyoshev,S.,2010.How does law af f ect finance?An examination of equity tunneling in Bulgaria.J.Financ.Econ.96,155–173.
Bae,K.,Kang,J.,Kim,J.,2002.Tunneling or value added?Evidence from mergers by Korean business groups.J.Finance 57,2695–2740.
Baek,J.,Kang,J.,Lee,I.,2006.Business groups and tunneling:evidence from private securities of f erings by Korean chaebols.J.Finance 61,2415–2449.
Bai,Y.X.,Wu,L.S.,2008.The impact of takeovers and change of ultimate control on operating performance of state-owned enterprises.J.Financial Res.6,130–143.
Bayne,D.C.,1963.A Philosophy of Corporate Control.University of Pennsylvania Law Review,p.112.
Bebchuk,L.A.,1994.Efficient and inefficient sales of corporate control.Q.J.Econ.109(4),957–993.
Berkowitz,D.,Lin,C.,Ma,Y.,2015.Do property rights matter?Evidence from a property law enactment.J.Financ.Econ.116,583–593.
Bertrand,M.,Mehta,P.,Mullainathan,S.,2002.Ferreting out tunneling:an application to Indian business groups.Quart.J.Econ.117,121–148.
Buchuk,D.,Larrain,B.,Munoz,F.,Urzu′a I,F.,2014.The internal capital markets of business groups:evidence from intra-group loans.J.Financ.Econ.112,190–212.
Chan,K.,Hu,S.Y.,Wang,Y.Z.,2003.When will the controlling shareholder expropriate the investors?Cash flow rights and investment opportunity perspective.Acad.Econ.Papers 31,301–331.
Cheung,Y.,Rau,P.,Stouraitis,A.,2006.Tunneling,propping,and expropriation:evidence from connected party transactions in Hong Kong.J.Financ.Econ.82,343–386.
Cheung,Y.,Rau,P.,Stouraitis,A.,2010.Helping hand or grabbing hand?Central vs.local government shareholders in Chinese listed firms.Rev.Finance 14,669–694.
Claessens,S.,Simeon,D.,Joseph,F.,Lang,L.,2002.Disentangling the incentive and entrenchment effects of large shareholdings.J.Finance 57,2741–2771.
Faccio,M.,Lang,Larry H.P.,2002.The ultimate ownership of Western European Corporation.J.Financ.Econ.65,365–395.
Fan,G.,Wang,X.L.,Zhu,H.P.,2009.NERI INDEX of Marketization of China’s Provinces 2009 Report.Economic Science Press,Beijing,pp.259–288.
Fan,J.,Wong,T.,Zhang,T.,2007.Politically connected CEOs,corporate governance,and Post-IPO performance of China’s newly partially privatized firms.J.Financ.Econ.84,330–357.
Gao,L.,Kling,G.,2008.Corporate governance and tunneling:empirical evidence from China.Pacific-Basin Finance J.16,591–605.
Green,S.,2003.China’s Stock Market.Profile Books Ltd.,London.
Jennings,R.W.,1956.Trading in corporate control.California Law Rev.44,1–39.
Jiang,G.H.,Lee,Charles M.C.,Heng,Y.,2010.Tunneling through intercorporate loans:the China experience.J.Financ.Econ.98,1–20.
Joh,S.,2003.Corporate governance and firm profitability:evidence from Korea before the economic crisis.J.Financ.Econ.68,287–322.
Johnson,S.,Boone,P.,Breach,A.,Friedman,E.,2000.Corporate governance in the Asian financial crisis.J.Financ.Econ.58,141–186.
Kahan,M.,1993.Sale of corporate control.J Law Econ Organ 9(2),368–379.
La Porta,R.,Lopez-de-Silanes,F.,Shleifer,A.,Vishny,R.W.,1998.Law and finance.J.Political Econ.106,1113–1155.
La Porta,R.,Lopez-de-Silanes,F.,Shleifer,A.,Vishny,R.,1999.The quality of government.J.Law Econ.Organ.15,222–279.
La Porta,R.,Lopez-de-Silanes,F.,Shleifer,A.,Vishny,R.W.,2000.Investor protection and corporate governance.J.Financ.Econ.58,3–27.
La Porta,R.,Lopez-de-Silanes,F.,Shleifer,A.,Vishny,R.W.,2002.Investor protection and corporate valuation.J.Finance 57,1147–1170.
Lemmon,M.,Lins,K.,2003.Ownership structure,corporate governance and firm value:evidence from the East Asian financial crisis.J.Finance 58,1445–1468.
Li,G.P.,2010.The pervasiveness and severity of tunneling by controlling shareholders in China.China Econ.Rev.21,310–323.
Li,Z.Q.,Sun,Z.,Wang,Z.W.,2004.Tunneling and ownership structure:evidence from the lending of controlling shareholder from the Chinese listed companies.Account.Res.12,3–13.
Lins,K.,2003.Equity ownership and firm value in emerging markets.J.Financ.Quant.Anal.38,159–184.
Liu,Q.,Lu,Z.,2007.Corporate governance and earnings management in the Chinese listed companies:a tunneling perspective.J.Corporate Finance 13,881–906.
MacNeil,I.,2002.Adaptation and convergence in corporate governance:the case of Chinese listed companies.J.Corporate Law Stud.2,289–344.
McConnell,John J.,Servaes,H.,1990.Additional evidence on equity ownership and corporate value.J.Financ.Econ.27,595–612.
Morck,R.,Shleifer,A.,Vishney,R.W.,1988.Management ownership and market valuation:an empirical analysis.J.Financ.Econ.20,293–315.
Of f enberg,D.,2009.Firm size and the effectiveness of the market for corporate control.J.Corporate Finance 15,66–79.
Peng,W.Qian,John Wei,K.C.,Yang,Z.S.,2011.Tunneling or propping:evidence from connected transactions in China.J.Corporate Finance 17,306–325.
Piotroski,J.,Zhang,T.,2014.Politicians and the IPO decision:the impact of impending political promotions on IPO activity in China.J.Financ.Econ.111,111–136.
Shleifer,A.,Vishny,R.W.,1986.Large shareholders and corporate control.J.Political Econ.94(3),461–488.
Shleifer,A.,Vishny,R.W.,1997.A survey of corporate governance.J.Finance 52,737–783.
Siegel,J.,Choudhury,P.,2012.A reexamination of tunneling and business groups:new data and new methods.Rev.Financial Stud.25,1763–1798.
Stulz,Rene.M.,1988.Managerial control of voting rights:financing policies and the market for corporate control.J.Financ.Econ.20,25–54.
Tang,Z.M.,Wei,Jiang.,2002.A study on the expropriation degree of large shareholders of China’s listed companies.Econ.Res.J.4,44–50.
Urzu′a I,F.,2009.Too few dividends?Groups’tunneling through chair and board compensation.J.Corporate Finance 15,245–256.
Wang,Z.H.,Zhang,Y.,2004.The block stock transfer and corporate control.Manage.World 5,116–126.
Xi,J.F.,Yu,P.Y.,2006.The study on transfer of the control right and it’s related operating performance and earnings management.Nankai Business Rev.9(4),42–48.
7 June 2016 Accepted 28 October 2016 Available online 9 December 2016
*Corresponding author at:Xili District,Shenzhen 518020,China.Fax:+86 755 26033494.
E-mail addresses:chloe_chan@139.com(W.Chen),mnslsm@mail.sysu.edu.cn(S.Li),xchen@hitsz.edu.cn(C.X.Chen).
http://dx.doi.org/10.1016/j.cjar.2016.10.001
1755-3091/?2016 Sun Yat-sen University.Production and hosting by Elsevier B.V.
This is an open access article under the CC BY-NC-ND license(http://creativecommons.org/licenses/by-nc-nd/4.0/).
JEL classification:G34 G32 G38
 China Journal of Accounting Research2017年3期
- China Journal of Accounting Research的其它文章
- Stock index adjustments,analyst coverage and institutional holdings:Evidence from China
- influence of Chinese entrepreneurial companies’internationalization on independent innovation:Input incentive effect and efficiency improvement effect
- Five-year plans,China finance and their consequences
- The significance of research—Comments on the Five-Year Plan paper
