
A 3 Billion Yuan Lithium Battery New Energy Vehicle Industrial Cluster Project Landed in Daye
2017-01-17 08:38:50
China Nonferrous Metals Monthly 2017年1期
?
A 3 Billion Yuan Lithium Battery New Energy Vehicle Industrial Cluster Project Landed in Daye
On December 24, a new industrial partner entered the friend circle of new energy vehicle industrial cluster in Daye; a new material project with a total investment of 3 billion yuan held ground-breaking ceremony, signaling its formal landing in Daye.
This Project is invested and constructed by Hubei Zhongxing New Advanced Material Co., Ltd, the Project involves total investment of 3 billion yuan, after the Project is launched into production, it is expected to generate 1.2 billion yuan of annual output value, 12000 tonnes of lithium battery each year, plus 200 million yuan of profit tax, and bring jobs to 500 persons, the Project includes 3 phases in construction, wherein Phase I involves an investment of 1 billion yuan, after completion it will become the biggest lithium battery cathode material production base in China, meanwhile it is able to manufacture multiple types of high-end lithium battery cathode materials, the Project will fulfill industrial docking with Daye Hanlong Automobile Industrial Park. According to Chairman He Zhonglin, the company plans listing on the New Third Board within three years, and listing on the main board within five years to become the first listed hi-tech enterprise in Daye.
On March 26 this year, Hanlong Automobile Industrial Park Project formally broke ground, the project occupies land area of 1000 mu, with total investment of 9 billion yuan, making it an investment invitation project with the highest investment amount since the founding of Daye. It is expected that in July next year, the first vehicle will formally go offline. After the Project is completed and reaches design capacity, each year it can manufacture 100,000 sets of energy-saving automobile components, and 200,000 sets of new energy vehicle (electric, hybrid) components, with annual output value of 30 billion yuan. After Daye enters the new energy vehicle industry, it continually extended industrial chain, and vigorously attracted investment by revolving around automobile upstream and downstream industries. On November 24, the Hanlng Automobile Supporting Industrial Park Project, which involves total investment of 8 billion yuan and consists of 6 projects, formally broke ground.
The formation of new energy vehicle industrial cluster will further optimize Daye’s industrial structure, promote industry upgrading, expand economic aggregate, accelerate the formation of growth pole and new engine for boosting Daye’s economic development. By 2020, Daye will strive to ensure the output value of high-end equipment manufacture industry, which is represented by Hanlong Automobile, to top 100 billion yuan.
Unit: metric ton

Name of province or cityProduction inNovember. 2016Total outputJan.-Nov. 2016% Change2015-2016 Zhejiang1581723 Jiangxi1313209521.04 Hunan391332060-9.9 Guangxi113210506-1.42 Yunnan86988933715.8 Total output China1638116597610.45
Unit: metric ton
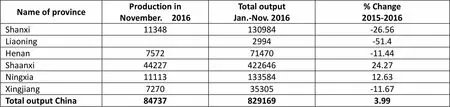
Name of provinceProduction inNovember. 2016Total outputJan.-Nov. 2016% Change2015-2016 Shanxi11348130984-26.56 Liaoning2994-51.4 Henan757271470-11.44 Shaanxi4422742264624.27 Ningxia1111313358412.63 Xingjiang727035305-11.67 Total output China847378291693.99
Unit: metric ton
Unit: metric ton
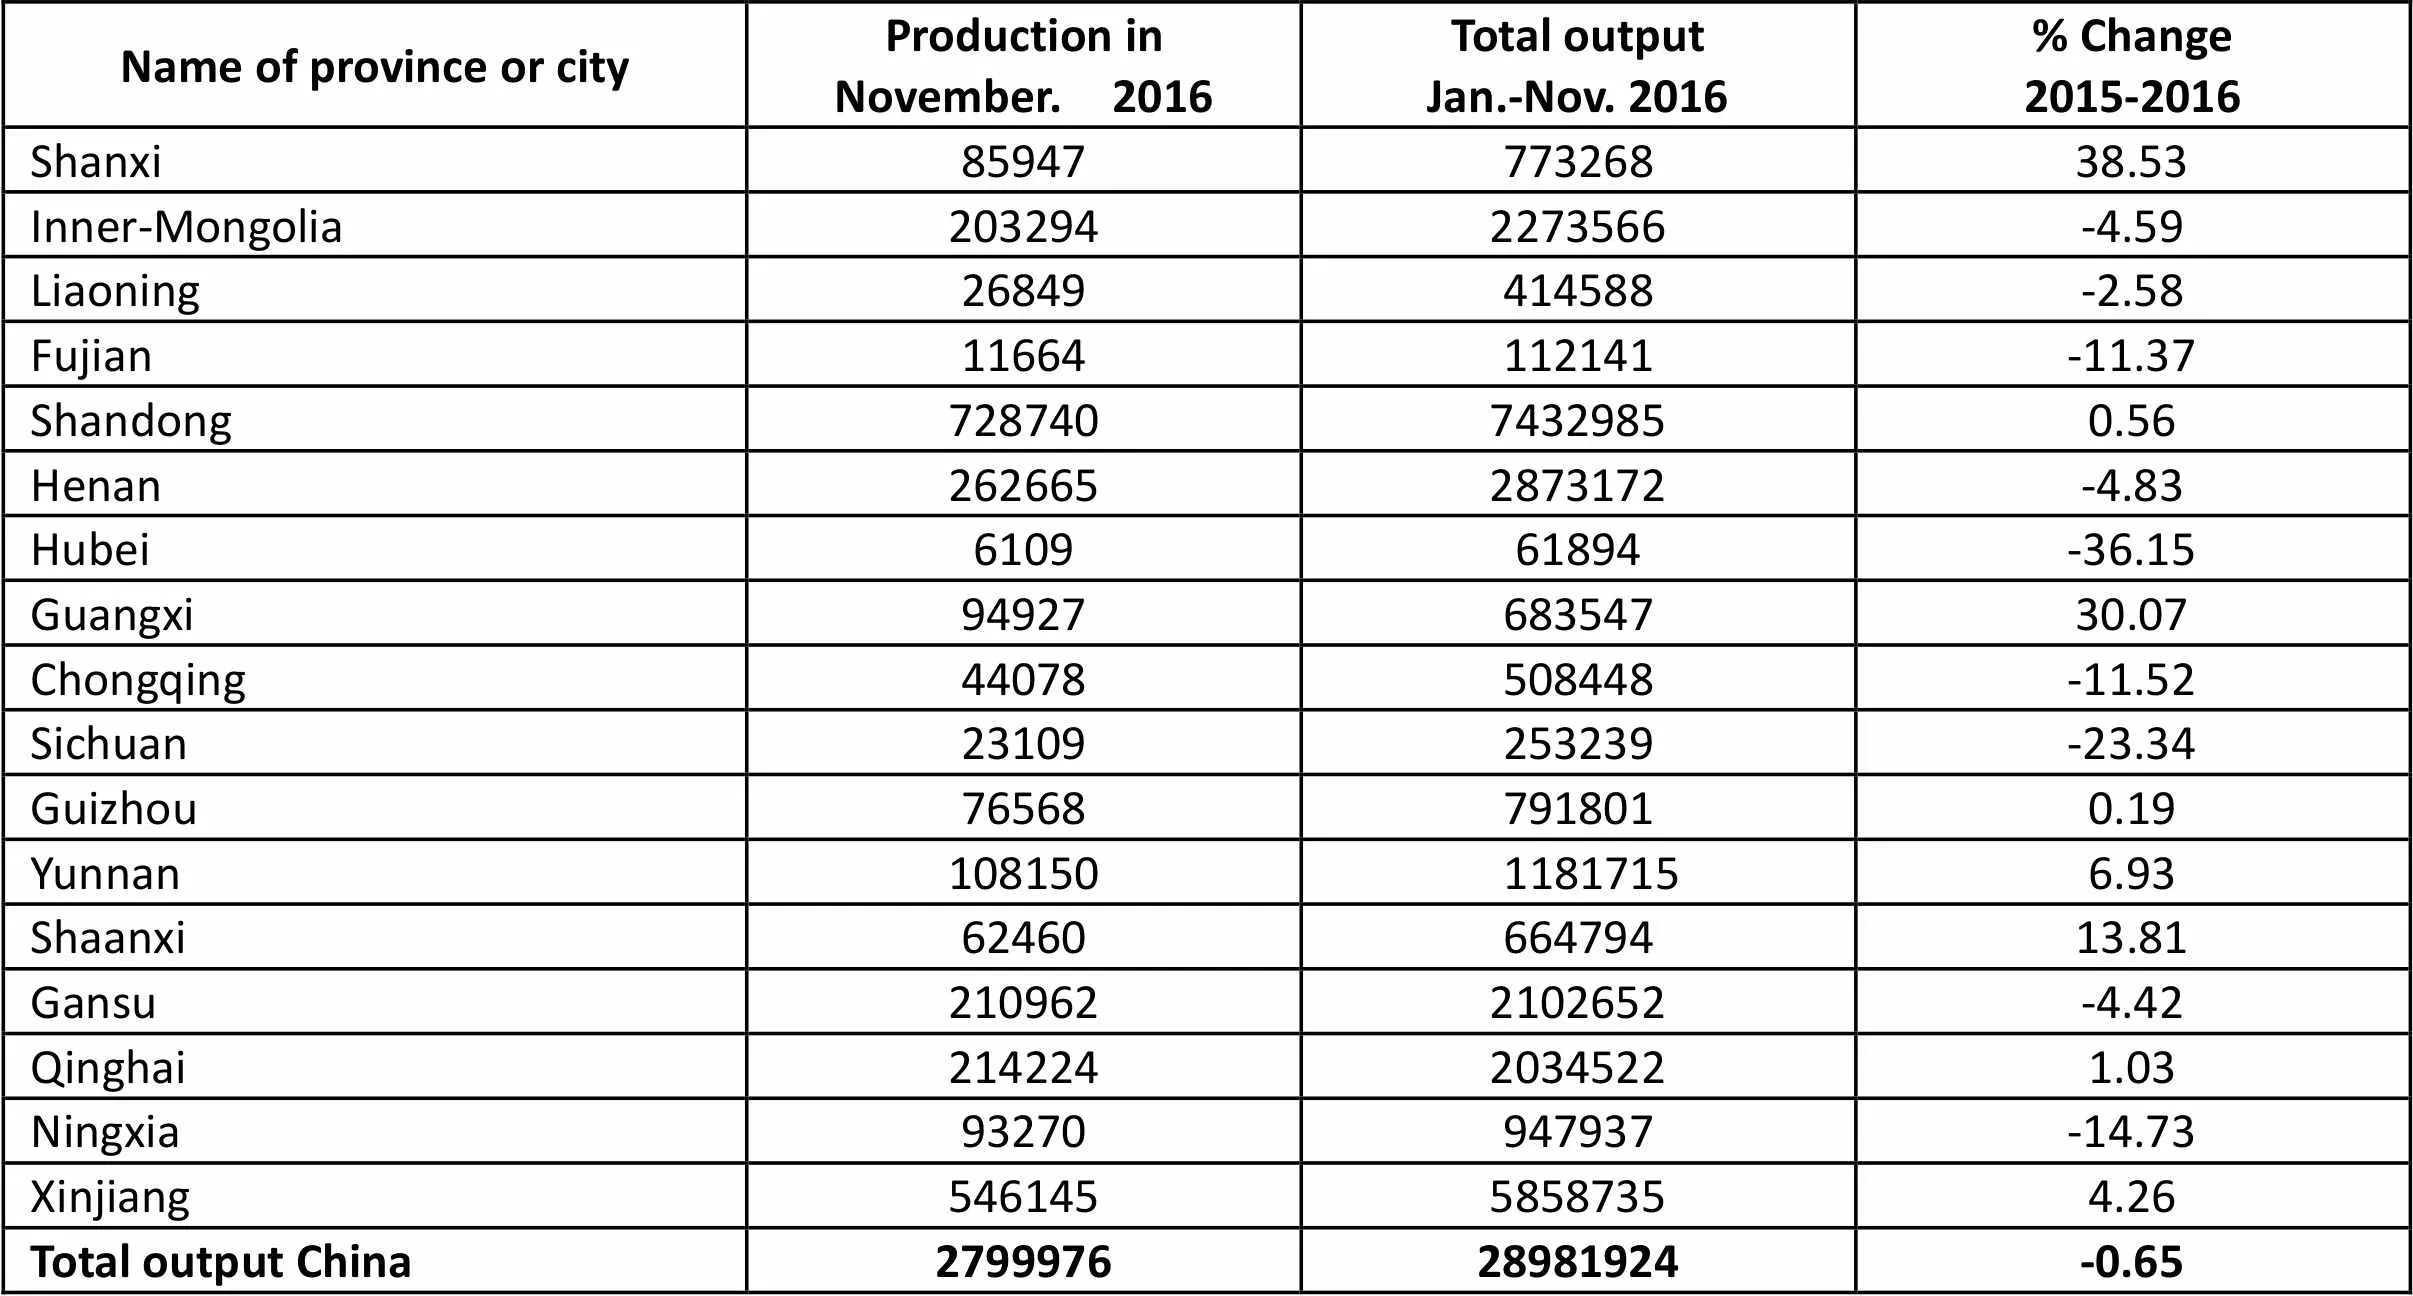
Name of province or cityProduction inNovember. 2016Total outputJan.-Nov. 2016% Change2015-2016 Shanxi8594777326838.53 Inner-Mongolia2032942273566-4.59 Liaoning26849414588-2.58 Fujian11664112141-11.37 Shandong72874074329850.56 Henan2626652873172-4.83 Hubei610961894-36.15 Guangxi9492768354730.07 Chongqing44078508448-11.52 Sichuan23109253239-23.34 Guizhou765687918010.19 Yunnan10815011817156.93 Shaanxi6246066479413.81 Gansu2109622102652-4.42 Qinghai21422420345221.03 Ningxia93270947937-14.73 Xinjiang54614558587354.26 Total output China279997628981924-0.65
Unit: metric ton
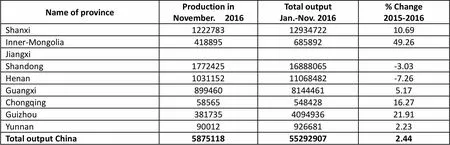
Name of province Production inNovember. 2016Total outputJan.-Nov. 2016% Change2015-2016 Shanxi12227831293472210.69 Inner-Mongolia41889568589249.26 Jiangxi Shandong177242516888065-3.03 Henan103115211068482-7.26 Guangxi89946081444615.17 Chongqing5856554842816.27 Guizhou381735409493621.91 Yunnan900129266812.23 Total output China5875118552929072.44
Unit: metric ton
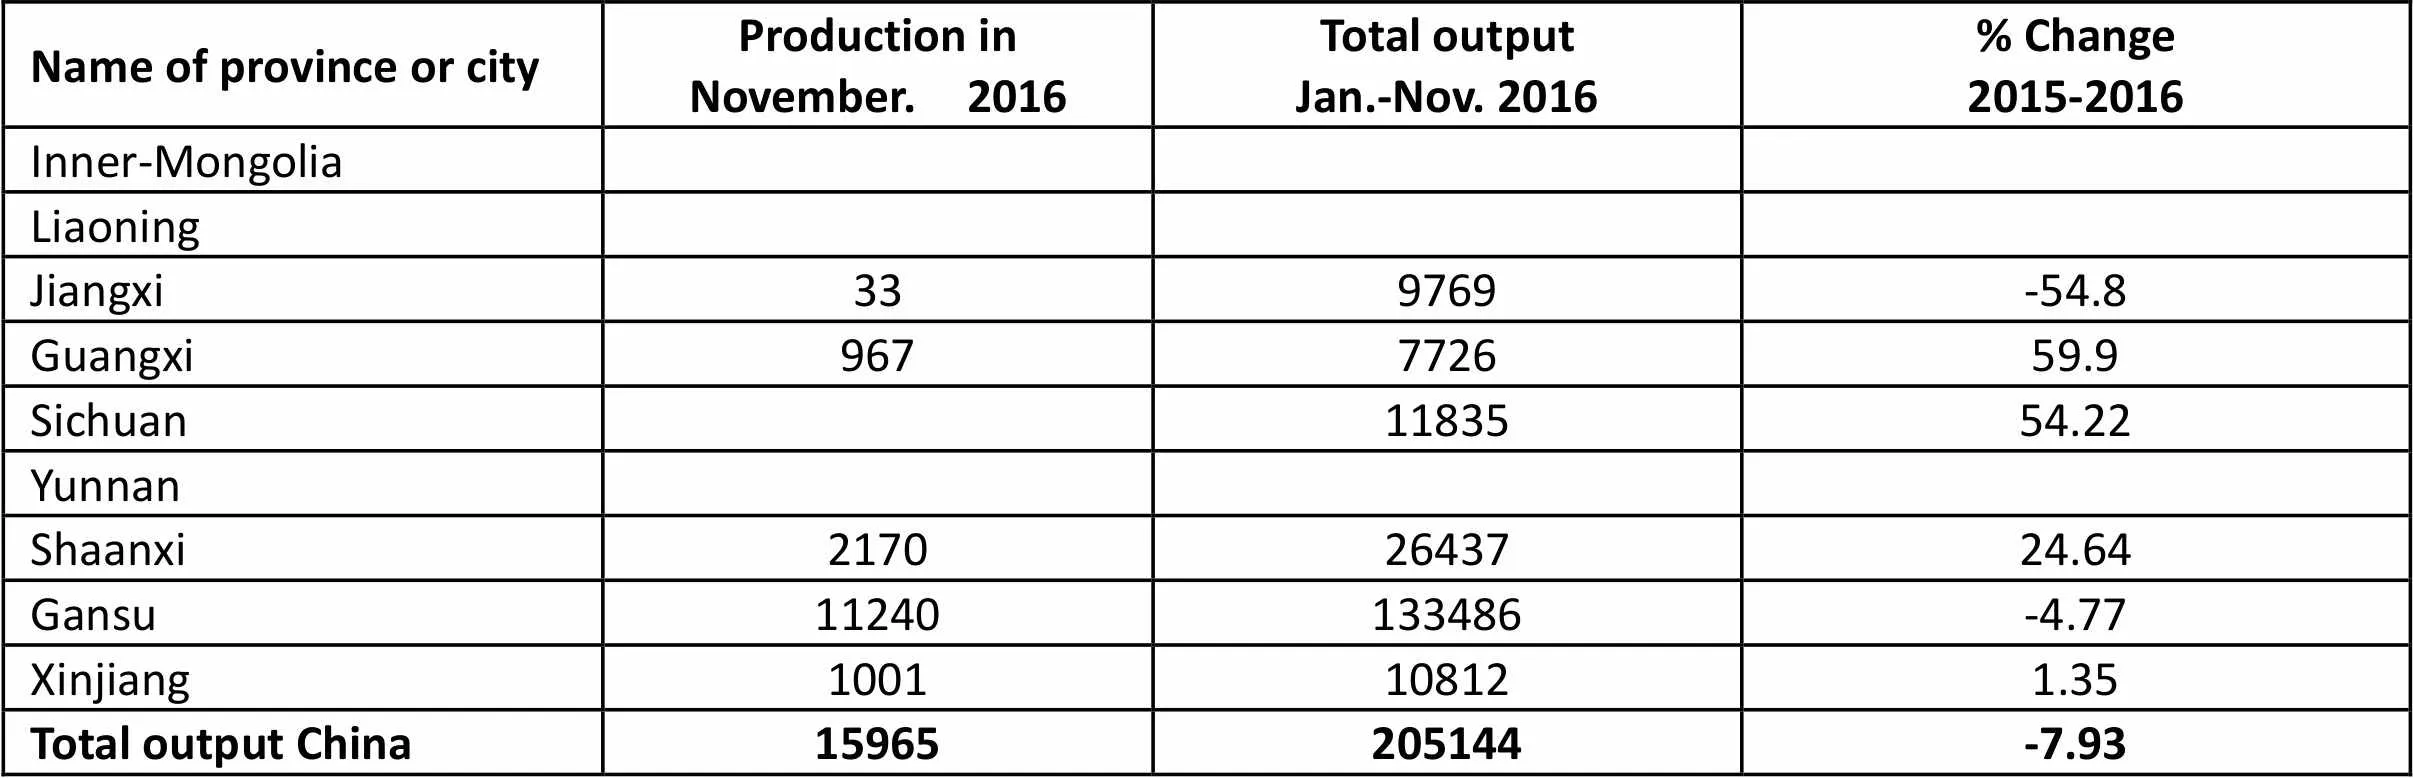
Name of province or cityProduction inNovember. 2016Total outputJan.-Nov. 2016% Change2015-2016 Inner-Mongolia Liaoning Jiangxi339769-54.8 Guangxi967772659.9 Sichuan1183554.22 Yunnan Shaanxi21702643724.64 Gansu11240133486-4.77 Xinjiang1001108121.35 Total output China15965205144-7.93
Unit: metric ton
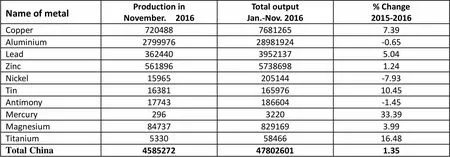
Name of metalProduction inNovember. 2016Total outputJan.-Nov. 2016% Change2015-2016 Copper72048876812657.39 Aluminium279997628981924-0.65 Lead36244039521375.04 Zinc56189657386981.24 Nickel15965205144-7.93 Tin1638116597610.45 Antimony17743186604-1.45 Mercury296322033.39 Magnesium847378291693.99 Titanium53305846616.48 Total China4585272478026011.35
Unit: metric ton

Name of province or cityProduction inNovember. 2016Total outputJan.-Nov. 2016% Change2015-2016 Beijing3723755-56.77 Tianjin81501821585-3.63 Hebei134868181618.03 Shanxi31532398817.35 Inner-Mongolia1434722603438.01 Liaoning634875886-31.2 Heilongjiang634875886-31.2 Shanghai25886259065-4.33 Jiangsu293088295718514.45 Zhejiang34328632036828.6 Anhui23602626364639.2 Fujian1676519604819.88 Jiangxi386993341122623.41 Shandong987708669986.59 Henan677965789174.98 Hubei26532290573249.66 Hunan4267544243416.59 Guangdong208450181481412.84 Guangxi850470603-1.5 Chongqin156451770933.15 Sichuan80797578215.38 Guizhou179392626.11 Yunnan177981798073.67 Shaanxi21792023613.08 Gansu2644936461057.21 Qinghai283953661-57.5 Ningxia6454491696.28 Xinjiang351334515-24.03 Total output China19515661887869712.93
Unit: metric ton
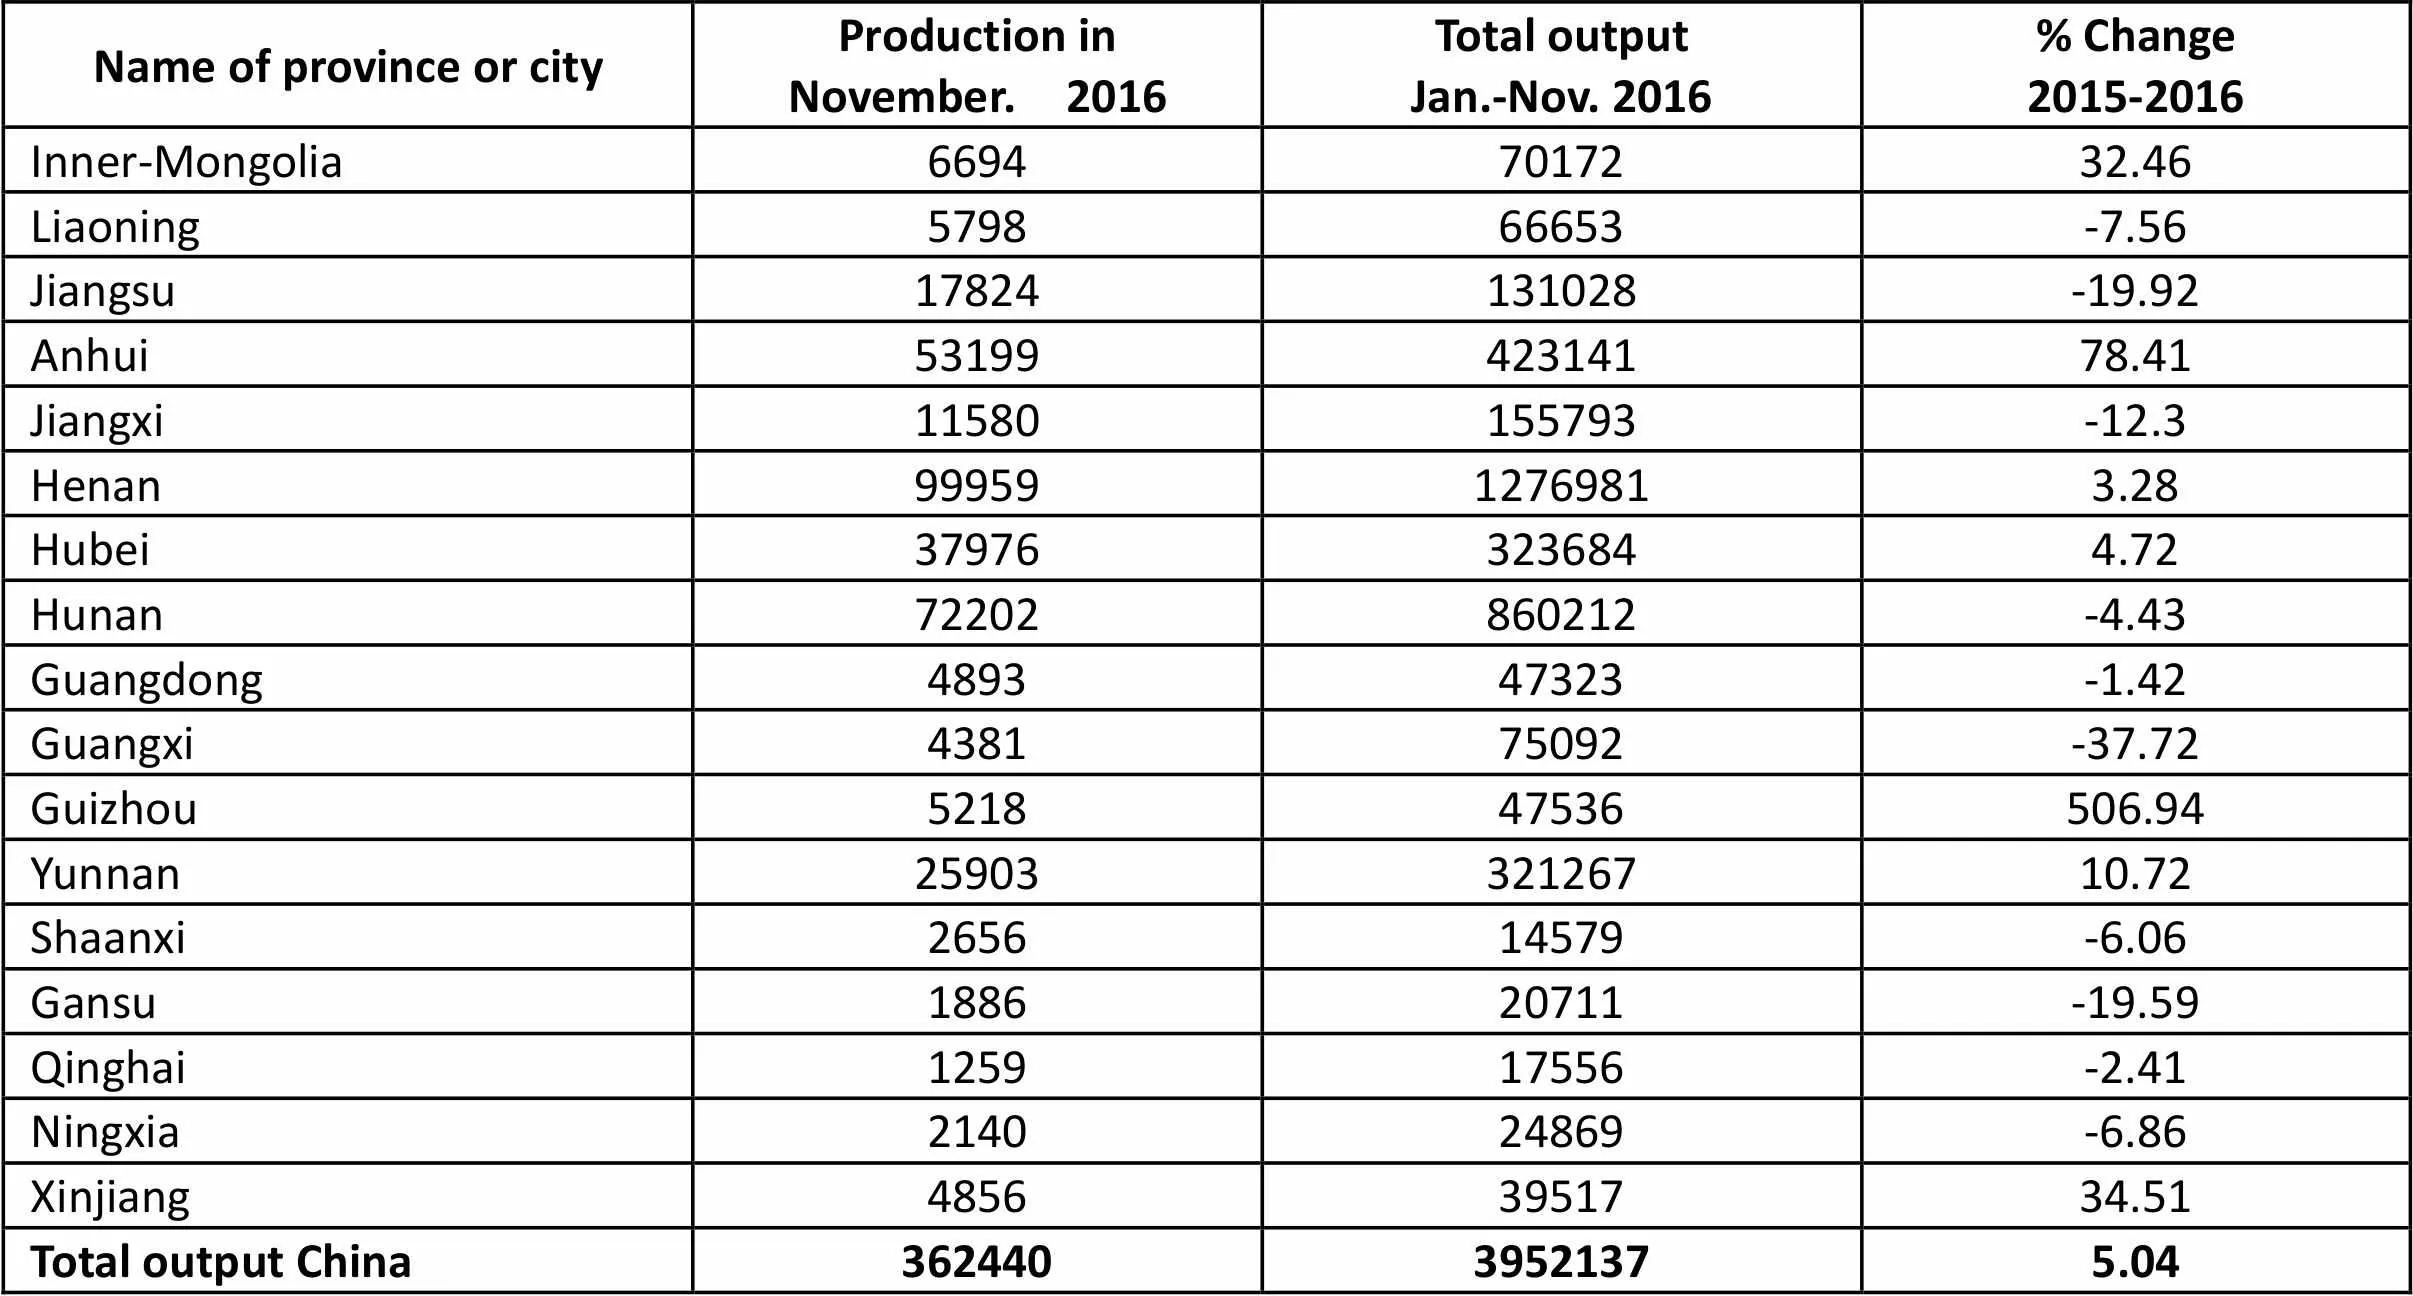
Name of province or cityProduction inNovember. 2016Total outputJan.-Nov. 2016% Change2015-2016 Inner-Mongolia 66947017232.46 Liaoning579866653-7.56 Jiangsu17824131028-19.92 Anhui5319942314178.41 Jiangxi11580155793-12.3 Henan9995912769813.28 Hubei379763236844.72 Hunan72202860212-4.43 Guangdong489347323-1.42 Guangxi438175092-37.72 Guizhou521847536506.94 Yunnan2590332126710.72 Shaanxi265614579-6.06 Gansu188620711-19.59 Qinghai125917556-2.41 Ningxia214024869-6.86 Xinjiang48563951734.51 Total output China36244039521375.04
Unit: metric ton(metal content)
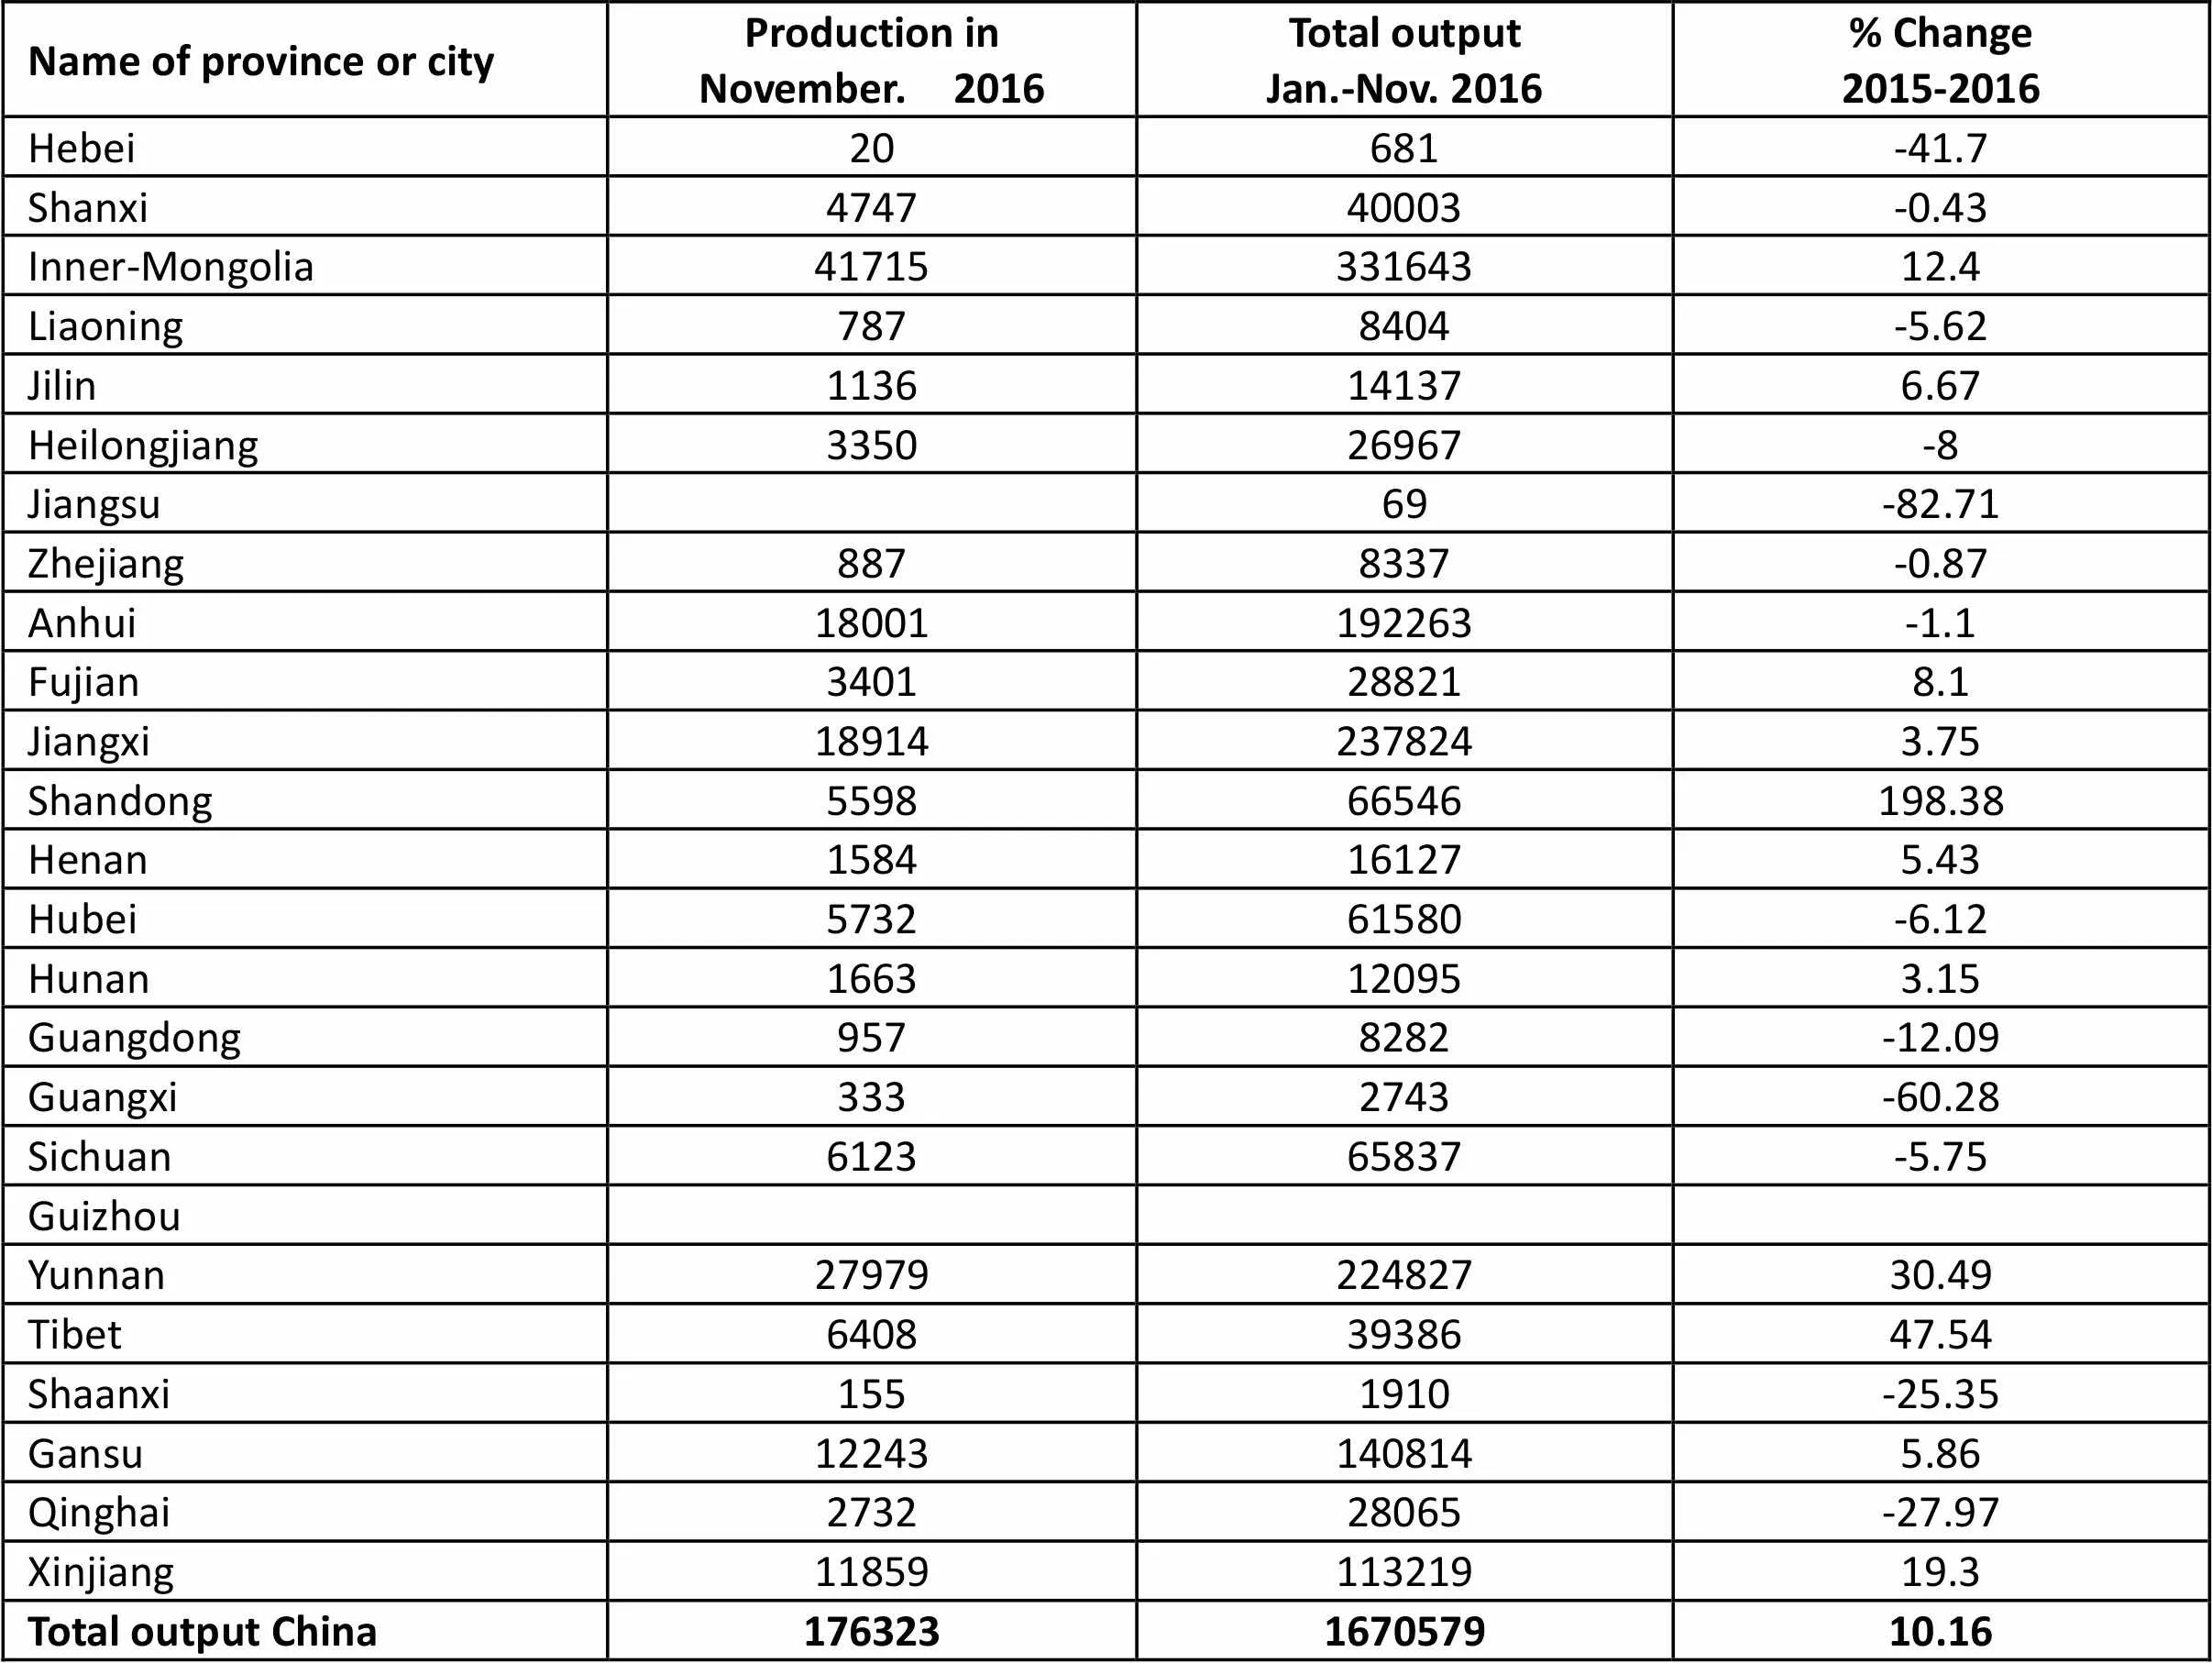
Name of province or cityProduction inNovember. 2016Total outputJan.-Nov. 2016% Change2015-2016 Hebei20681-41.7 Shanxi474740003-0.43 Inner-Mongolia4171533164312.4 Liaoning7878404-5.62 Jilin1136141376.67 Heilongjiang335026967-8 Jiangsu69-82.71 Zhejiang8878337-0.87 Anhui18001192263-1.1 Fujian3401288218.1 Jiangxi189142378243.75 Shandong559866546198.38 Henan1584161275.43 Hubei573261580-6.12 Hunan1663120953.15 Guangdong9578282-12.09 Guangxi3332743-60.28 Sichuan612365837-5.75 Guizhou Yunnan2797922482730.49 Tibet64083938647.54 Shaanxi1551910-25.35 Gansu122431408145.86 Qinghai273228065-27.97 Xinjiang1185911321919.3 Total output China176323167057910.16
(End of October. 2016)
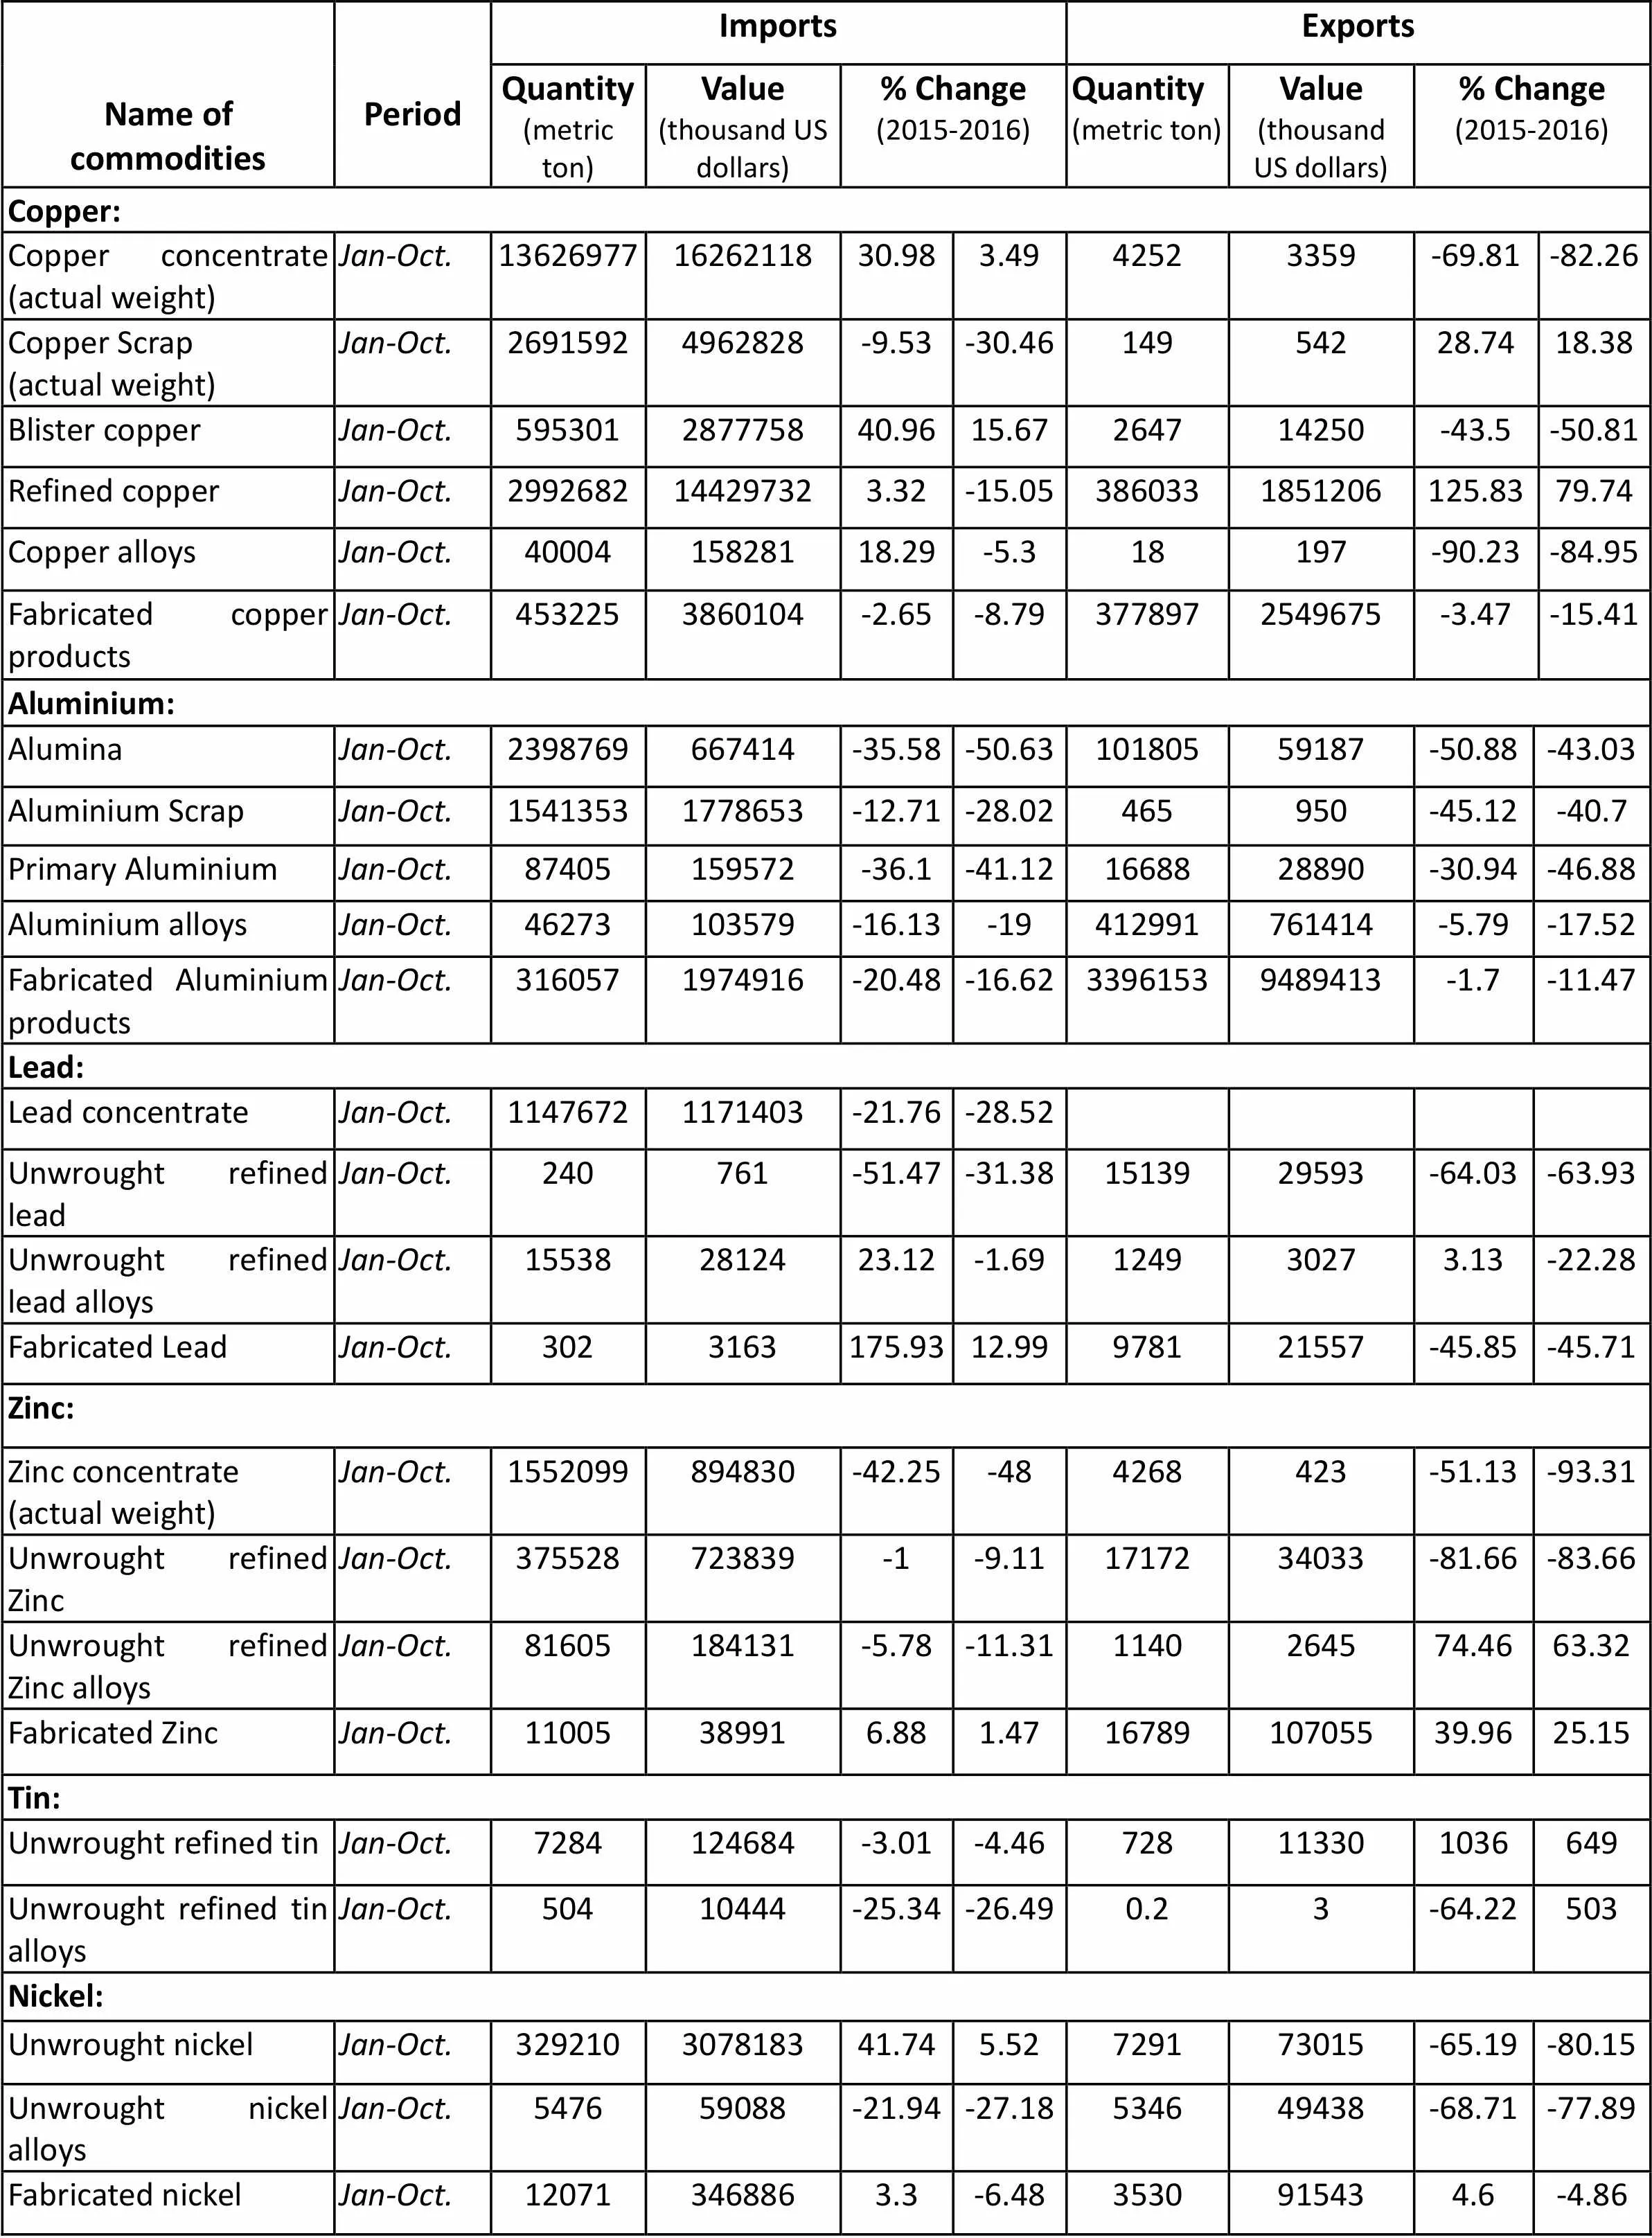
Name of commoditiesPeriodImportsExportsQuantity (metric ton)Value (thousand US dollars)% Change (2015-2016)Quantity (metric ton)Value (thousand US dollars)% Change (2015-2016)Copper:Copper concentrate (actual weight)Jan-Oct.136269771626211830.983.4942523359-69.81-82.26Copper Scrap (actual weight)Jan-Oct.26915924962828-9.53-30.4614954228.7418.38Blister copperJan-Oct.595301287775840.9615.67264714250-43.5-50.81Refined copper Jan-Oct.2992682144297323.32-15.053860331851206125.8379.74Copper alloysJan-Oct.4000415828118.29-5.318197-90.23-84.95Fabricated copper productsJan-Oct.4532253860104-2.65-8.793778972549675-3.47-15.41Aluminium:AluminaJan-Oct.2398769667414-35.58-50.6310180559187-50.88-43.03Aluminium ScrapJan-Oct.15413531778653-12.71-28.02465950-45.12-40.7Primary AluminiumJan-Oct.87405159572-36.1-41.121668828890-30.94-46.88Aluminium alloysJan-Oct.46273103579-16.13-19412991761414-5.79-17.52Fabricated Aluminium productsJan-Oct.3160571974916-20.48-16.6233961539489413-1.7-11.47Lead:Lead concentrateJan-Oct.11476721171403-21.76-28.52Unwrought refined leadJan-Oct.240761-51.47-31.381513929593-64.03-63.93Unwrought refined lead alloys Jan-Oct.155382812423.12-1.69124930273.13-22.28Fabricated LeadJan-Oct.3023163175.9312.99978121557-45.85-45.71Zinc:Zinc concentrate (actual weight)Jan-Oct.1552099894830-42.25-484268423-51.13-93.31Unwrought refined ZincJan-Oct.375528723839-1-9.111717234033-81.66-83.66Unwrought refined Zinc alloysJan-Oct.81605184131-5.78-11.311140264574.4663.32Fabricated ZincJan-Oct.11005389916.881.471678910705539.9625.15Tin:Unwrought refined tin Jan-Oct.7284124684-3.01-4.46728113301036649Unwrought refined tin alloysJan-Oct.50410444-25.34-26.490.23-64.22503Nickel:Unwrought nickel Jan-Oct.329210307818341.745.52729173015-65.19-80.15Unwrought nickel alloysJan-Oct.547659088-21.94-27.18534649438-68.71-77.89Fabricated nickelJan-Oct.120713468863.3-6.483530915434.6-4.86

Name of commoditiesPeriodImportsExportsQuantity (metric ton)Value (thousand US dollars)% Change (2014-2015)Quantity (metric ton)Value (thousand US dollars)% Change (2014-2015)Antimony:Unwrought antimony Jan-Oct.226118418222199254973334253.1422.18Antimony oxideJan-Oct.7334673-24.91-39.093244617032624.45-5.89Molybdenum:Molybdenum concentrate (actual weight)Jan-Oct.161949559151.7527.9555704103944.6916.57Ferro-molybdenumJan-Oct.45185-79.19-94.37418742827514455Molybdenum OxideJan-Oct.21254-10.86-42.02352248649143.22143.1Magnesium:Unwrought magnesiumJan-Oct.486255955.79222.762797726495624.02-2.9Magnesium turnings, particles and powderJan-Oct.7467-90.7745.6460827138577-5.16-10.64Tungsten:Tungsten ore concentrateJan-Oct.399420911-3.18-35.53139988-48.34-65.45Tungsten oxideJan-Oct.6288-83.22-69.82742813829829.630.64Ammonium Paratungstate Jan-Oct.15230-83.92-69.8228114712097.4455.02Tungsten powderJan-Oct.1044955346.82220.39905254022.59-23.94 Tungsten carbide powderJan-Oct.44194841.32-9.89377310038633.86-3.76 Ferro-tungstenJan-Oct.232-91.16-87.8918923463328.04-3.07 Silver: (unit in kg) Unwrought silverJan-Oct.599773242642-17.98-33.711459644820920-11.71-6.66 Silver powderJan-Oct.14267172726025.5649.97124063021-6.7895.26 Semi-finished silverJan-Oct.57062866971-4.05-8.294318970-95.98-98.29 Silver ornamentsJan-Oct.35347936779.0534.16222835520592-0.76-19.38 Silverware Jan-Oct.261663-79.8-61.72187554137924.1335.96 Gold: (unit in kg) Gold ornamentsJan-Oct.67204061097.5-5.531160698189069-36.58-26.23 Titanium: Fabricated titaniumJan-Oct.48423357961.97-12.961149623634717.22-0.71 Titanium concentratesJan-Oct.198381922808726.44-0.25109898107-63.33-41.34 Titanium dioxideJan-Oct.149447365641-14.17-17.1559522196229934.3418.15 Cobalt: Cobalt and Fabricated cobaltJan-Oct.1545248330642.631.19132238553-45.33-49.83 Cobalt concentratesJan-Oct.1294601760867-34.35-54.65 Cobalt oxideJan-Oct.3435444-65.81-33.49835815616027.835.32 Cobalt nitrateJan-Oct.4935653.6338.25 Cobalt carbonateJan-Oct.13134-86.37-89.76119713944-10.28-26.06
Unit: metric ton
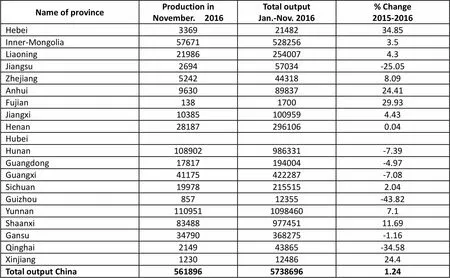
Name of provinceProduction inNovember. 2016Total outputJan.-Nov. 2016% Change2015-2016 Hebei33692148234.85 Inner-Mongolia576715282563.5 Liaoning219862540074.3 Jiangsu269457034-25.05 Zhejiang5242443188.09 Anhui96308983724.41 Fujian138170029.93 Jiangxi103851009594.43 Henan281872961060.04 Hubei Hunan108902986331-7.39 Guangdong17817194004-4.97 Guangxi41175422287-7.08 Sichuan199782155152.04 Guizhou85712355-43.82 Yunnan11095110984607.1 Shaanxi8348897745111.69 Gansu34790368275-1.16 Qinghai214943865-34.58 Xinjiang12301248624.4 Total output China56189657386961.24
 China Nonferrous Metals Monthly2017年1期
- China Nonferrous Metals Monthly的其它文章
- Steady Growth in New Energy Vehicle Boosts Power Lithium Battery Recycling Market
- In 2015 Lithium Price Tripled, Lithium Battery is In a Draught of the Industry
- Several Ministries Released Mineral Resource Plan, Tax Reform for Mineral Resource will Make Progress
- Grasp Three Basic Features of Rare Earth Industry, Propel Supply-side Structural Reform
- The ‘Development Plan of National Strategic Emerging Industries Promotes Breakthrough Development of High-end Equipment and New Material Industry
- China’s Mining Industry Embraces Golden Time for External Investment