
Study of Friction between Liquid Crystals and Crystalline Surfaces by Molecular Dynamic Simulations?
2016-05-10 07:38:18YongWenZhang張永文XiaoSongChen陳曉松andWeiChen陳衛(wèi)
Yong-Wen Zhang(張永文)Xiao-Song Chen(陳曉松)and Wei Chen(陳衛(wèi))?
1CAS Key Laboratory of Theoretical Physics,Institute of Theoretical Physics,Chinese Academy of Sciences,P.O.Box 2735,Beijing 100190,China
2School of Physical Sciences,University of Chinese Academy of Sciences,Beijing 100049,China
3Computer Network Information Center,Chinese Academy of Sciences,P.O.Box 349,Beijing 100190,China
1 Introduction
Recently,using liquid crystal(LC)molecules as lubricants or lubricant additives has been shown to produce a dramatic reduction of friction to ultralow values.[1?4]We have already performed a systematic molecular dynamics(MD)study on the friction force of the con fined LC monolayer under different shearing and sliding conditions by considering three different atomic structures for the con fining surfaces in our previous article.[5]It has demonstrated that the frictional properties of the LC molecules depend on the competition between the Effect of the pattern of surface mesh and that of the imposed sliding direction.
Many studies have also focused on the influence of the lubricant-surface interaction energy on friction force.The stick-slip events and periodic breaking-reforming transitions of atomic-scale capillary water bridges can be observed for thin water films con fined by hydrophilic mica sheets from MD simulations.However,only smooth sliding without stick-slip events is observed for water conther progress in the optimization of frictional properties of LC lubricants,in this study,we continue studying the key structural and dynamical properties of con fined LC molecules under shear conditions by performing MD simulations of a simplified rigid bead-necklace model of the LC molecules.[9?11]Previous study about the boundary lubrication characteristics of this model have shown that the coarse-grained bead-necklace model capture much of the structural and dynamic properties of LC lubricant.[5]We here consider LC molecules con fined by surfaces with different energy parameters of LC-surface interaction under temperature changing conditions,approximating a wide variety of materials.We will show that the attractive force between LC molecules and surfaces leads to the enhanced LC density layering away from the surfaces and partial alignment of LC molecules in the first fluid layer.And the slip length is found to change signi ficantly as a function of LC-surface interaction energy.
The article is arranged as follows.The details of the MD simulations procedure are described in Sec.2.The simulation results are presented and discussed in details in Sec.3.We conclude the article by a few remarks in the last section.
2 Model
In this study,LC molecule is treated as a coarsegrained rigid bead-necklace model.[5,9?11]Each LC molecule consists of nine interaction sites(beads).The non-bonded interactions between the beads belonging to different molecules are described by pairwise-additive Lennard–Jones(L-J)12-6 potentials,
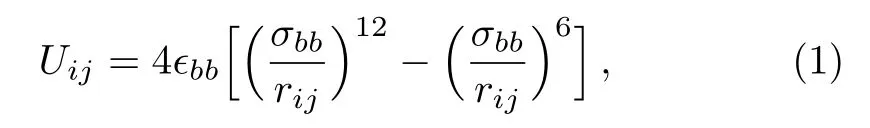


Fig.1 (Color online)The sketch of the simulation geometry.y axis is normal to the page.Blue LC molecules are con fined by two rigid crystalline plates(black atoms).The top plate is moved with a constant driving velocity V along the x direction,and the bottom plate is fixed.The distance between the two plates is kept at 20.04.
Figure 1 shows a sketch of the simulation geometry.LC molecules are con fined by two rigid crystalline surfaces.Atomic structure of the surfaces is a projection of the face-centered cubic(fcc)on the plane that is perpendicular to the(100)direction.The top and bottom surfaces have the same number of the atoms 1800,and the distance between the two surfaces is kept at 20.04.The total number of LC molecules is set to 576 in all of the MD simulations.The length of simulation box inx,yandzdirections are chosen to beLx=30.0,Ly=30.0,andLz=40.0.The periodic boundary conditions are used in all the three directions.The number densityρof the LC molecules con fined by two surfaces can be calculated byρ=576/(30.0×30.0×20.04)≈0.0319.Each molecular bead interacts with the surface atoms via the potential as Eq.(1),the parameters?bs,σbsare obtained by combination rules,
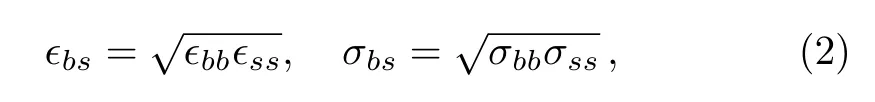
where the subscriptsdenotes surface atom.σssis always equal to 1,and?ssis selected in the range of 0.2 to 1.8 in this study.
All the MD simulations are performed in the NVT canonical ensemble(constant number of particles,constant volume and constant temperature).We consider both equilibrium and non-equilibrium properties of the con fined LC molecules.The top surface is moved with a constant driving velocityVwhich is varied in a range between zero to 0.95 along thexdirection,and the bottom surface is always kept still.A Nos′e-Hoover thermostat is implemented whenV=0 to control the temperature in the equilibrium state.A Langevin themostatting,which is widely used in MD simulations of sheared fluids,[5,12?13]is applied in theydirection to remove viscous heating generated in the shear flow whenV>0.As for the Langevin the mostatting,the equations of motion of thei-th bead are
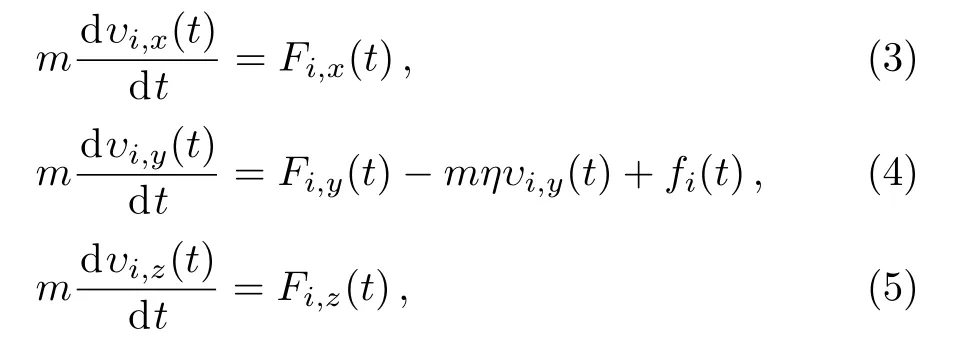
whereυi,x,υi,yandυi,zare the projection ofi-th bead velocity inx,yandzdirection respectively.Fi,x,Fi,yandFi,zare the projection of the net deterministic force acting on thei-th bead inx,yandzdirection.fi(t)is aδ-correlated stationary Gaussian process with zero mean,satisfyingands the damping factor which is set to 0.01 in our simulation.different types of liquid crystal phases have been observed in different temperature ranges.[14]Thus,we also consider the influence of temperature on the system.Temperatures are chosen to beT?=3.5,4.5,and 5.5 respectively.All of the MD simulations are performed with the Largescale Atomic/Molecular Massively Parallel simulator(LAMMPS)[15]in this study.After an initial 107time steps during which the system reaches the steady state,a typical production runs of a total of 107time steps are carried out with the integration time step of 0.001τ.
3 Results
3.1 Fixed Surfaces
The results of equilibrium MD simulations when the driving velocity is zero is reported firstly.Figure 2 shows the density pro filesρ(z)/ρof LC molecules con fined by two surfaces with different energy parameters?ssunder different temperatures.As forT?=3.5,the LC molecules maintain layered structures inzdirection.The molecules are divided into 20 layers corresponding to 20 peaks.The average kinetic energy of the LC molecule increases as the temperature increases.The layered structures of LC molecules are destroyed by thermodynamic fluctuation at high temperatures.As it is shown in Fig.2(a),atT?=5.5,only the LC molecules close to the surfaces are in the layered structure.Increasing the LC-surfaces interaction energy leads to more LC molecules are attracted by the surfaces.It can be observed that at a low LC-surfaces interaction,?ss=0.2,the height of the peaks nearest the surfaces is much smaller than those of the larger interaction energy.

Fig.2 (Color online)Reduced density pro files of the LC molecules in z direction for temperatures T?=3.5(red lines),4.5(green lines)and 5.5(blue lines)with different energy parameters(a) ?ss=0.2,(b) ?ss=1.0 and(c) ?ss=1.8.The number density ρ is equal to 0.0319.The bottom surface and the top surface are located at z=0 and z=20.02 respectively.The dashed line represents the position of the trough following the peak nearest the bottom surface,which is located at z=1.52.This position is denoted by a in this article.
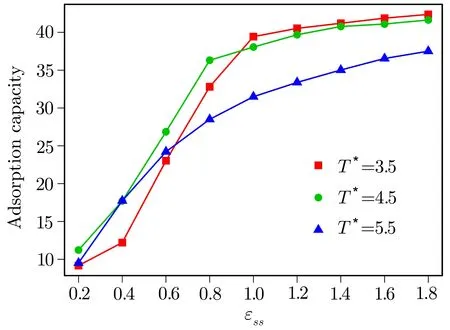
Fig.3 (Color online)Variation of the adsorption capacity of bottom surface as a function of ?ssfor temperatures T?=3.5(red squares),T?=4.5(green circles)and T?=5.5(purple triangles).

Surface structures have significant effects on interface friction by affecting the distribution of angles of the adsorbed LC molecules.It has been observed in the previ-ous work that LC molecules align their long axes roughly along the surface mesh and induce a number of domains with different local orientation orders.[5]We consider here the influence of the LC-surface interaction energy on the orientation of LC molecules close to the surfaces.The distributions of|cos(θ)|and|cos(φ)|for LC monolayer closest to the bottom surface are calculated with different?ssand temperatures.In spherical coordinate system,θangle of the unit vector of the LC molecule measures from the fixedzdirection,and theφangle of its orthogonal projection onx-yplane measures fromxdirection onx-yplane.
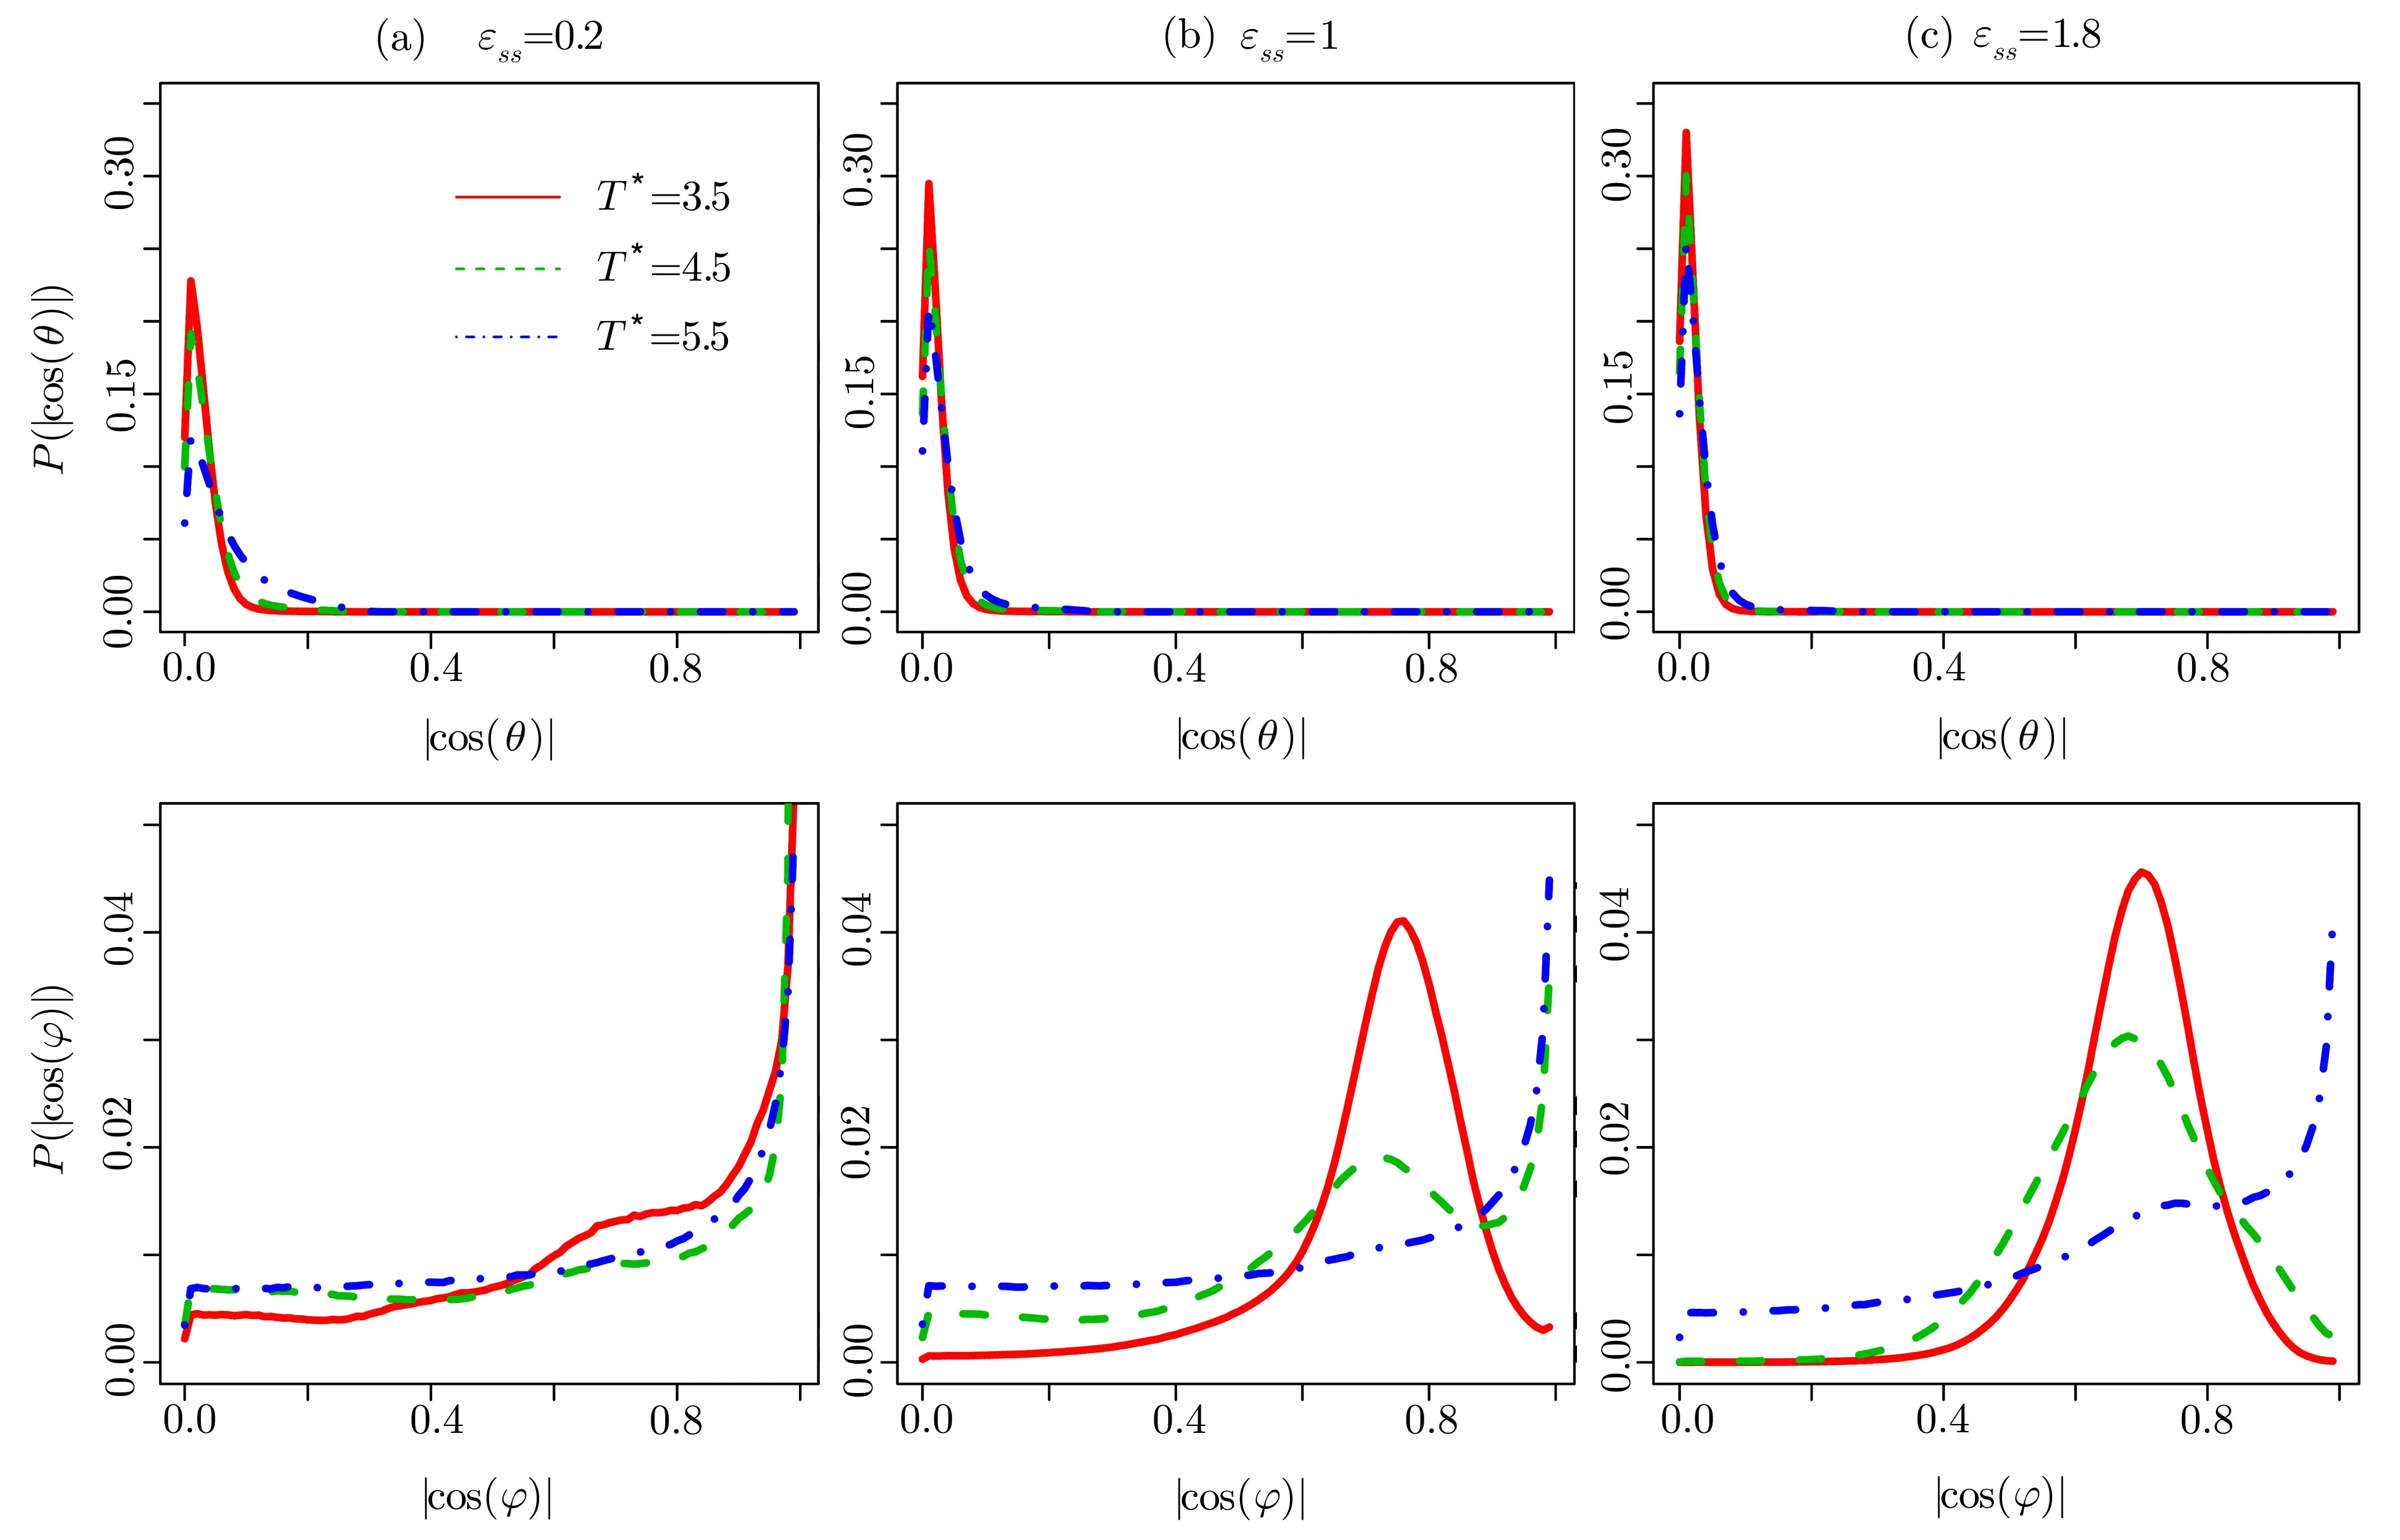
Fig.4 (Color online)The distributions of|cos(θ)|and|cos(φ)|for LC molecules closest to the surface with the energy parameters(a) ?ss=0.2,(b) ?ss=1.0,and(c) ?ss=1.8 at different temperatures.
The distributions are plotted in Fig.4.The values of|cos(θ)|are around 0.01,and they do not depend on?ssand temperature. Those results indicate thatθis very close to 90?,the LC molecules near the surfaces almost lie in thex-yplane.However,the maximum value ofdecreases with increasing temperature at a fixed?ss.In contrast,this value increases as?ssincreases at a fixed temperature.In general,the Effect of the temperature competes with the influence of the LC-surface interaction energy.The nearest atoms in the(100)surface are arranged along the 2D vectors in thex-yplane with the angles that are equal to±45?.The fraction of LC molecules withφ=±45?increases with increasing?ssfor a fixed value of temperature.The results can be understood that the larger value of?ssmakes the surfaces more attractive.However,when temperature increases for a fixed?ss,the LC molecules get less ordered due to the thermodynamic fluctuation.
3.2 Sliding Surfaces
We consider hereafter the non-equilibrium properties of the LC molecules by the shear flow simulations.
The top surface is moved with a constant nonzero driving velocityValong thexdirection.The velocity pro files of the LC molecules forV=0.2 under different temperatures are plotted in Fig.5.For?ss=0.2,the slip velocity pro file of LC molecules atT?=3.5 coincides with that ofT?=4.5,their slopes are almost zero which indicates that adjacent layers move parallel to each other with same speeds.When the temperature isT?=5.5 for?ss=0.2,each layer of LC molecules moves faster than the one just below it.For a higher LC-surface interaction energy,?ss=1.0,the velocity pro files are nonlinear forT?=3.5 andT?=4.5,a large amount of LC molecules attach to the surfaces and move with the same velocities.However,the velocity pro files are almost linear forT?=5.5.The similar behavior can be observed for?ss=1.8.Lubrication layers and sticky layers close to surfaces typically occur for the shear flow simulations at high LC-surface interaction energy,and the width of sticky layer becomes smaller as temperature increases until sticky layer disappears.ForT?=5.5,the layered struc-ture of LC molecules is destroyed,there are only lubrication layers at the LC-surfaces interface.Our results are similar as that reported in Ref.[16],where polymer solution forms lubrication layers at weakly attract surfaces,the sticky surface layers only appear for more attractive surfaces.Obviously,the temperature can also change the velocity pro files from nonlinear to linear.Figure 6 shows the results of fitting the velocity pro files for three different energy parameters?ssand different shearing velocitiesVof top surface atT?=5.5.

Fig.5 (Color online)Velocity pro files vx(z)for temperatures T?=3.5,4.5,and 5.5 with the different energy parameters(a) ?ss=0.2,(b) ?ss=1.0 and ?ss=1.8.We take 20 bins in z direction to calculate vx(z).Top surface speed V=0.2.
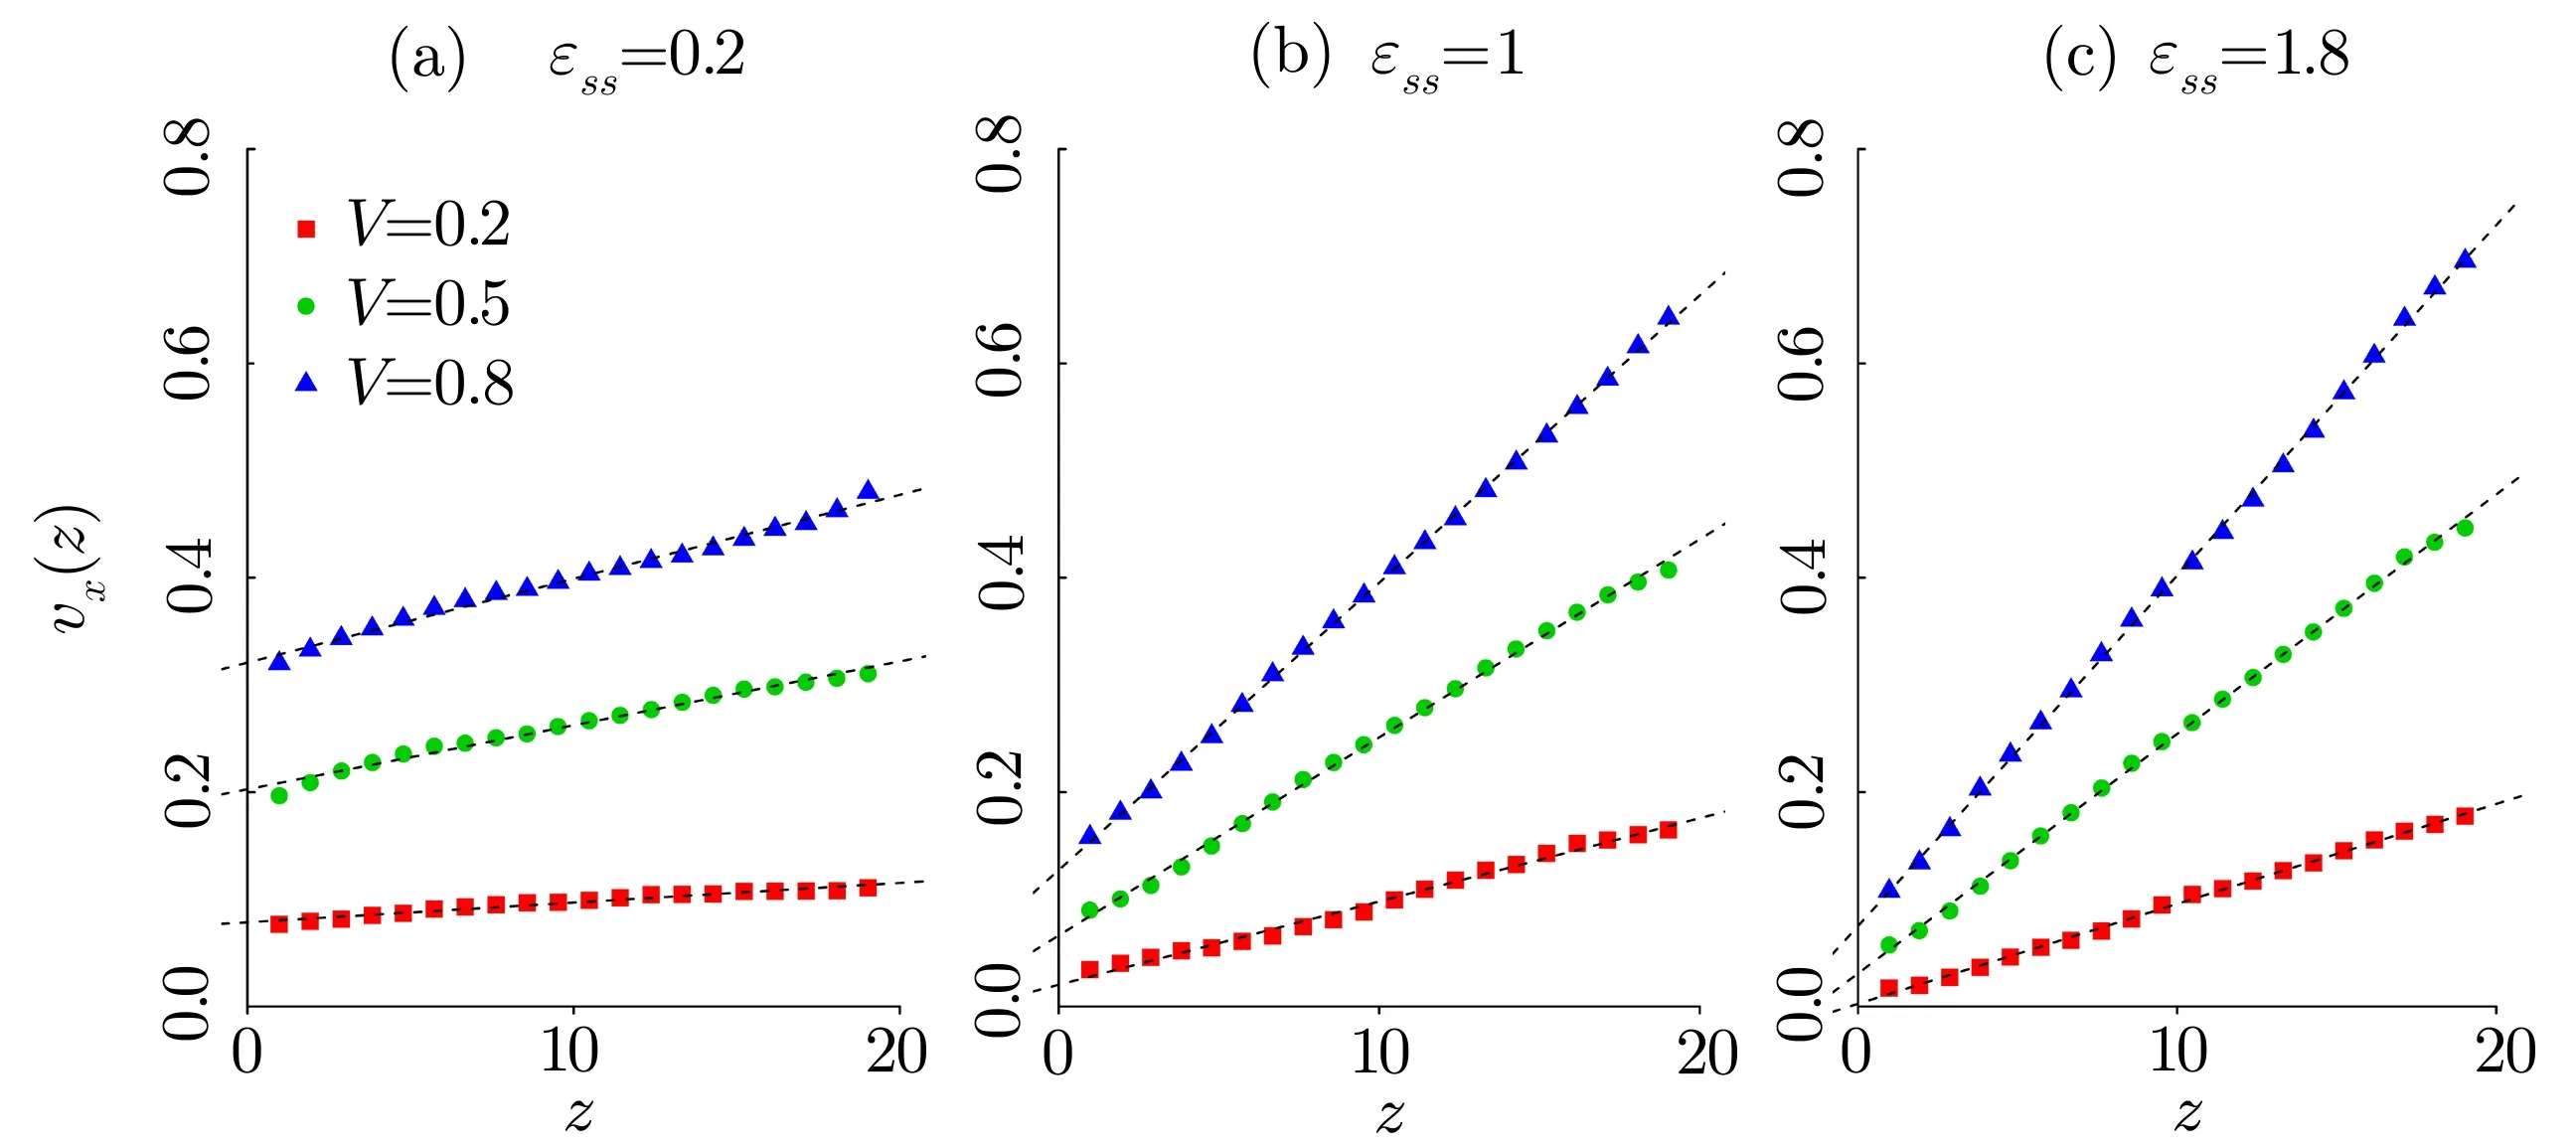
Fig.6 (Color online)Velocity pro files for the energy parameters(a) ?ss=0.2,(b) ?ss=1.0 and ?ss=1.8.Top surface speeds V=0.2(red),V=0.5(green)and V=0.8(blue).The dashed lines are linear regression lines and their extrapolation length in z direction are the slip length b.The temperature is kept at T?=5.5.

Fig.7 (Color online)Variation of the slip length b as a function of the parameter ?ssfor different shearing velocities of top surface,V=0.2(orange),V=0.5(green)and V=0.8(blue);The dash lines are linear regression lines.

Figure 7 shows the results of variation of the slip lengthbas a function of the parameters?ssfor three different shearing velocitiesV=0.2,V=0.5,andV=0.8.It can be observed that the slip length increases with decreasing interaction energies.The slip lengthbvaries according tolinearly.The value of slip lengthbis small with strong interaction between LC molecules and surfaces.When this interaction becomes weaker,there are larger values for the slip lengthb.The similar behavior can also be observed in the MD simulations of polymer solution,[16]where the slip lengthbincreases with decreasing liquid-surface interaction energy.

Fig.8 (Color online)Variation of the slip length b as a function of the slip velocity of top surface at different energy parameters ?ss.The red lines are linear regression fitting lines and the shadowed area is 95%con fidence region.
It has been shown from the experimental results on the Effect of humidity for mica surfaces,[19]that as for the water con fined by hydrophilic surfaces,the friction force decreases with increasing shearing velocities.This Effect is basically the result of the hydrogen bond network forming between hydrophilic surfaces.However,the trend is inversed on bare mica surfaces and other hydrophobic surfaces,because there is no hydrogen bond network formation kinetics in this process.As expected,the increase of energy parameter?ssleads to an increase in the wettability of the surface,[20]thus complementary simulations are performed to study the dependence of the slip length on shearing velocity at different energy parameters.For simulations on simple liquid system,[21]a gradual transition in shear rate dependence of the slip length from linear to highly nonlinear is observed upon reducing the strength of wall-liquid interactions.The slip length is a linear function of shear rate at high wall-liquid interaction energies,and it is a power-law function for weak interaction energies.Figure 8 shows the results for LC molecules atT?=5.5,it can be observed that the slip length depends on the shearing rate linearly at large values of?ss,we can also observe nonlinear behavior at?ss=0.2,0.3,and 0.4,but it does not comply with the power-law,the widths of 95%confidence region for the linear regression fit are much greater than those of large values of?ss.
Friction depends on shearing velocity has been confirmed.When the surface materials are different,velocity dependence of friction will be changed.The chemical nature of the surface,which can form H-bond network,exhibit a friction that decreases with shear velocity,but if the surface can not form such networks,this behavior is opposite.[19]So exploring influence of variation of the slip lengthbas a function of shearing velocity by different wall fluid interaction energies is signi ficant.When the shearing velocity changes,we get different values of the slip lengthbunder same energy parameter?ss(In Fig.7).For simulations on simple liquid system,[21]a gradual transition in shear rate dependence of the slip length from linear to highly nonlinear is observed upon reducing the strength of wall- fluid interactions.The slip length is a linear function of shear rate at high wall- fluid interaction energies,it is a power-law function for weak wall- fluid interaction energies.Our results are similar to simple liquid at high wall- fluid interaction energies,for weak wall- fluid interaction energies,we also observe nonlinear behavior but it does not comply with the power-law.Figure 8 shows this result.We add a linear regression line to each picture of?ss.For low values of?ss=0.2,0.3,and 0.4,the widths of 95%confidence region for the regression fit are large,wherefore variation of the slip length as the slip velocity increases are nonlinear and no clear trend.When the energy parameter?sstakes larger values,we can get better linear regression lines and the slip lengthbincreases as the shearingVincreases linearly.
4 Conclusion
In summary,molecular dynamics simulation was applied to study the friction between liquid crystals and crystalline surfaces for different LC-surface interaction en-ergies,temperatures,and shearing velocities.Our results show that the LC molecules nearest the surfaces exhibit significant orientational order at high LC-surface interaction energies and low temperatures,but get less ordered when the temperature increases or interaction energies decrease.Our findings reveal that the slip length varies as a function of the LC-surface interaction energy,which can be well described though a theoretical curve.We find that the slip length increases linearly with increase in the shearing velocity at high LC-surface interaction energies,but for weak interaction energies,no signi ficant trend can be observed.
References
[1]R.J.Bushby and K.Kawta,Liquid Crystals38(2011)1415.
[2]T.Amann and A.Kailer,Wear271(2011)1701.
[3]T.Amann and A.Kailer,Tribol Lett.41(2011)121.
[4]T.Aman and A.Kailer,Tribol Lett.37(2010)343.
[5]W.Chen,S.Kulju,A.S.Foster,M.J.Alawa,and L.Laurson,Phys.Rev.E90(2014)012404.
[6]W.Chen,A.S.Foster,M.J.Alawa,and L.Laurson,Phys.Rev.Lett.114(2015)095502.
[7]J.Chen,I.Ratera,J.Y.Park,and M.Salmeron,Phys.Rev.Lett.96(2006)236102.
[8]S.Ohmishi and A.Stewart,Langmuir18(2002)6140.
[9]P.Tian,D.Bedrov,G.D.Simith,and M.Glaser,J.Chem.Phys.115(2001)9055.
[10]P.Tian and G.D.Smith,J.Chem.Phys.116(2002)9957.
[11]P.Tian,D.Bedrov,G.D.Smith,M.Glaser,and J.E.Maclennan,J.Chem.Phys.117(2002)9452.
[12]P.A.Thompson and S.M.Troian,Nature(London)389(1997)360.
[13]N.V.Priezjev,J.Chem.Phys.136(2012)224702.
[14]A.J.McDonald and S.Hanna,Phys.Rev.E75(2007)041703.
[15]S.Plimpton,J.Comp.Phys.117(1995)1.
[16]J.Servantie and M.Muller,Phys.Rev.Lett.101(2008)026101.
[17]D.M.Huang,C.Sendner,D.Horinek,R.R.Netz,and L.Bocquet,Phys.Rev.Lett.101(2008)226101.
[18]C.Sendner,D.Horinek,L.Becquet,and R.R.Netz,Langmuir25(2009)10768.
[19]J.Chen,I.Rathera,J.Y.Pack,and M.Salmeron,Phys.Rev.Lett.96(2006)236102.
[20]T.Werder,J.H.Walther,R.I.Ja ff e,T.Halicioglu,and P.Koumoutsakos,J.Phys.Chem.107(2003)1345.
[21]N.V.Prizezjev,Phys.Rev.E75(2007)0501605.
 Communications in Theoretical Physics2016年10期
- Communications in Theoretical Physics的其它文章
- Relativistic Correction on Neutrino Emission from Neutron Stars in Various Parameter Sets?
- A Complex Network Model for Analyzing Railway Accidents Based on the Maximal Information Coefficient?
- E ff ect of Mis fit Strain on Pyroelectric Properties of(111)Oriented Pb(Zr1?xTix)O3 Thin Films?
- First-Principles Study of Structural,Magnetic,Electronic and Elastic Properties of PuC2?
- Critical Behavior of Spatial Evolutionary Game with Altruistic to Spiteful Preferences on Two-Dimensional Lattices?
- In fluence of Defects and Crystallographic Orientation on Mechanical Behavior of Nanocrystalline Aluminium?